 Junping Zhang
 Jing Li
 Liwen Zhang
 Zhouqiang Liu
 Zuqian Jiang
- 1Earthquake Engineering Research and Test Center, Guangzhou University, Guangzhou, China
- 2School of Civil Engineering, Guangzhou University, Guangzhou, China
Foam concrete, a new kind of building material, has attracted wide attention due to its high energy absorption capability and low density. However, the low strength and poor toughness of foam concrete have become obstacles to hinder its further application. Coir fiber (CF), as a renewable recycled plant fiber, has shown a significant effectiveness for improving the mechanical properties of cement-based materials in some previous studies. In this paper, CF was introduced into foam concrete to develop its dynamic performance. A total of 54 foam concrete specimens with different CF contents (0.0%, 0.5%, 1.0%, 1.5%, 2.0%, and 2.5%) were prepared and divided into six groups. A single-impact test was carried out at three driving gas pressures (0.20, 0.25, and 0.30 MPa) by means of Split Hopkinson pressure bar experimental technology to investigate the effect of CF content on the dynamic performance of foam concrete, including the failure mode, dynamic compressive strength, stress-strain behavior, and energy absorption capacity. Furthermore, to explain the change mechanism of CF-foam concrete, a microstructure analysis was conducted through a scanning electron microscope and X-ray diffraction. The results revealed that an appropriate amount of CF could significantly improve the dynamic performance of foam concrete. The foam concrete’s ductility attained an optimal level at the CF content of 1.5%. The dynamic compressive strengths reached their highest values of 2.27 MPa (at 0.20 MPa gas pressure), 3.18 MPa (at 0.25 MPa gas pressure), and 4.21 MPa (at 0.30 MPa gas pressure) at the CF content of 1.5%. The peak values of energy absorption were 8.9 J (at 0.20 MPa gas pressure) at a CF content of 2.0%, 14.9 J (at 0.25 MPa gas pressure) at a CF content of 1.5%, and 22.4 J (at 0.30 MPa gas pressure) at a CF content of 1.5%, respectively. However, this improvement would deteriorate when CF was in excess.
Introduction
Foam concrete has been used as a filling material for crash barriers due to its good energy-absorbing performance. However, its significant disadvantages, including low strength, poor toughness, and easy cracking, may affect the structural performances and safety of crash barriers (Kearsley and Wainwright, 2001; Etkin et al., 2010; Kudyakov and Steshenko, 2015). Lots of existing studies have confirmed that incorporating fibers into foam concrete can benefit the improvement of strength, toughness, crack resistance, and energy absorption performance (Zhang et al., 2011; Ma et al., 2012; Shen et al., 2012). Fibers commonly used in engineering, such as steel fiber, glass fiber or other synthetic fiber, usually have the disadvantages of high-energy absorption and high-resource input (Zhan et al., 2009; Wang, 2011; Shang and Song, 2016), which may result in environmental pollution and the rise of project costs. Thus, there is a need to develop new alternative materials. Coir fiber (CF) is such a renewable recycled plant fiber with the advantages of good energy saving, favorable environmental protection, and excellent mechanical properties (Calado et al., 2000). Some previous studies have demonstrated that the mechanical performance of cement-based materials can be improved by incorporating CF. Wang and Chouw (Wang and Chouw, 2017) studied the dynamic behavior of CF reinforced concrete (CFRC) under the drop weight impact loadings. They found that the performance of CFRC under repeated impact was affected by CF length, and CF with a length of 25 and 50 mm had better impact resistance than that of 75 mm. Danso and Manu (Danso and Manu, 2020) conducted research concerning the effects of CF contents (0.2–0.8% by weight) and lime contents (0–15% by weight) on the behavior of soil-cement mortar, indicating that the optimum strength was recorded at 0.2% CF and 5% lime addition of the specimen. Ali et al. (2012) investigated the effects of CF contents (1, 2, 3, and 5% by mass of cement) and CF lengths (2.5, 5 and 7.5 cm) on the mechanical and dynamic properties of CF reinforced concrete (CFRC) members. Results revealed that CFRC with a CF length of 5 cm and a CF content of 5% had the best properties.
As shown above, CF has been proven to have potential to take the place of those conventional fibers for the requirement of energy conservation and environment protection. However, most existing research focused on ordinary concrete added with CF or foam concrete added with conventional fibers. The number of studies directed at the application of CF in foam concrete was very few. Mohamad et al. (2018) carried out an experimental study on the effects of CF contents (0.1, 0.2, and 0.3% of the total weight of cement) on mechanical properties and flexural behavior of foam concrete. It was pointed out that the foam concrete with 0.3% CF experienced the smallest crack propagation, and the compressive strength, tensile strength and modulus of elasticity of foam concrete increased with the CF percentage increasing. Mohamad’s study provided some positive results. However, this was still insufficient.
On that ground, it is necessary to systematically and comprehensively study the mechanical behavior of CF-foam concrete to further understand the effect of CF on foam concrete performance. In previous work, the effects of CF contents on the static behavior of CF-foam concrete, including the compressive property and flexural performance, has been studied. Results revealed that CF significantly improved the static performance of foam concrete. The static compressive strength increased from 0.83 to 1.51 MPa with CF content increasing from 0.0 to 1.5%, the static energy absorption increased from 55.37 to 106.32 J with CF content increasing from 0.0 to 2.0%, and the static flexural strength increased from 0.33 to 0.73 MPa with CF content increasing from 0.0 to 2.0%. However, growth of foam concrete performance went into reverse when CF exceeded the threshold. On that basis, further research is needed to explore the mechanical response of CF-foam concrete under impact load, which is significantly different from that under static load.
In this paper, the dynamic performance of CF-foam concrete was investigated using the split Hopkinson pressure bar (SHPB) experimental technology, a classical experimental method to test the dynamic properties of materials Gray (2000). A total of 54 foam concrete round-cake specimens, divided into six groups with six different CF contents, were employed to study the effect of CF content on the failure mode, dynamic compressive strength, stress-strain behavior, and energy absorption capacity of foam concrete at three gas pressures. Moreover, microstructure analyses using scanning electron microscope (SEM) and X-ray diffraction (XRD) were carried out to illuminate the microscopic mechanism of CF-foam concrete for explaining these dynamic behaviors.
Experimental Program
Raw Materials and Specimen Preparation
The CF-foam concretes used in this study were prepared by mixing foam concrete with CF of six different volume fractions (0, 0.5, 1.0, 1.5, 2.0, and 2.5%). It should be noted that the CF contents given in this study referred to volume fractions.
Taking the composite Portland cement P.C32.5R, Cocamidopropyl betaine CAB-35 (foaming agent), Hydroxypropyl methyl cellulose (foam stabilizer), Nano-silicon dioxide (foam reinforcing agent) as raw materials, detailed property parameters of which were provided in T1-5, the foam concrete was produced through the following steps: Firstly, the foam was prepared by mixing the foam stabilizer, reinforcing agent, foaming agent, and water according to a weight ratio of 0.05:0.2: 1:7.5. Secondly, the cement mortar was produced in a mortar mixer with the water cement ratio of 0.5. Thirdly, the foam was poured into cement mortar in a volume ratio of 1:2 and then mixed in the mortar mixer for 3 min.
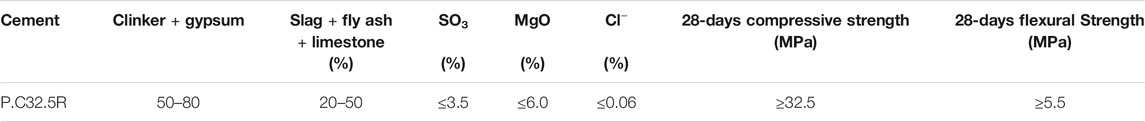
TABLE 1. Property parameters of cement.

TABLE 2. Property parameters of foaming agent.
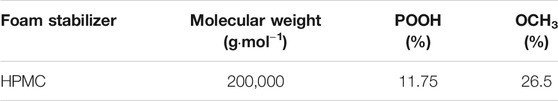
TABLE 3. Property parameters of foam stabilizer.
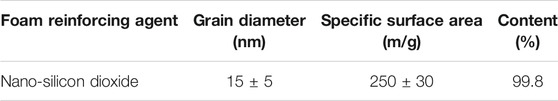
TABLE 4. Property parameters of foam reinforcing agent.

TABLE 5. Property parameters of CF.
Before adding CF to the foam concrete, the CF should be preprocessed for better performance (Wang and Chouw, 2017). In this study, CF was soaked for 30 min after repeated cleaning, and boiled for 2 h in the electric thermostatic water cabinet. After that, the boiled CF was dried at a constant temperature of 60°C for 24 h by using the electric thermostatic drying oven. These dried CF was then cut into small pieces with a length of 20 mm ± 2 mm.
The production of CF-foam concrete was completed after CF was added gradually into the foam concrete mortar and stirred for about 2 min to ensure the CF pieces were evenly distributed in the concrete mortar.
A total of 54 round-cake specimens, 75 mm in diameter and 35 mm in thickness, were casted by following these steps: firstly, the molds were brushed with oil in advance for easy demolding. Secondly, CF-foam concrete mortar was poured into the molds and vibrated mechanically to avoid honeycombs and holes. Finally, all the 54 specimens, equally divided into six groups according to CF contents, were cured for 28 days after demolding. The specimen is described as in Figure 1, and the production process of CF-foam concrete is shown in Figure 2.
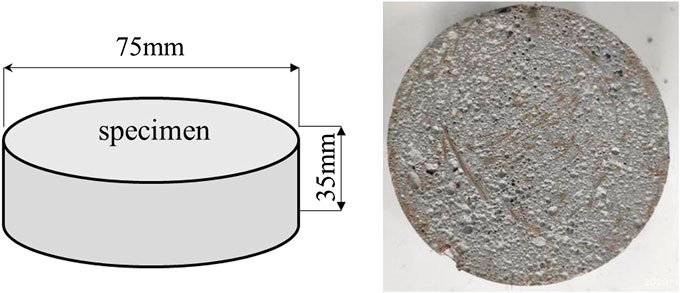
FIGURE 1. Specimen.
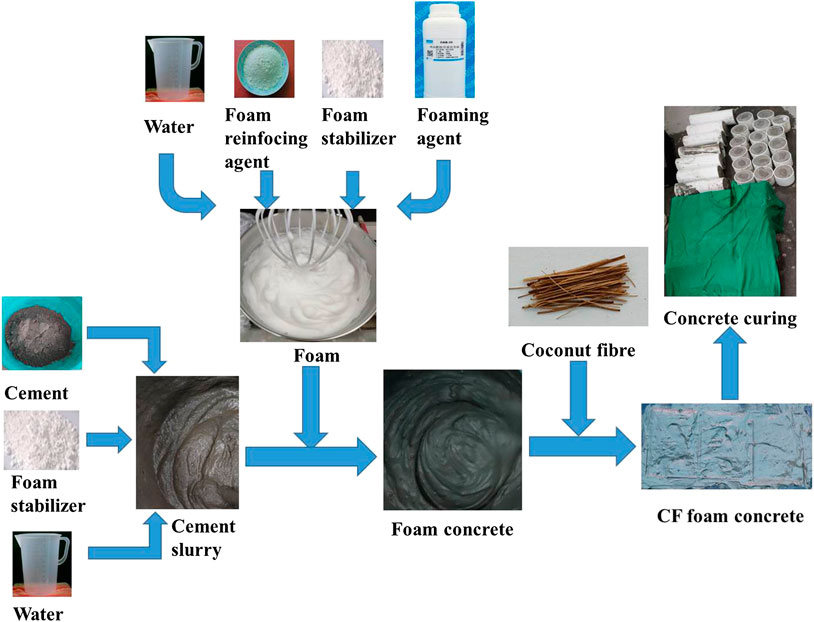
FIGURE 2. Production process of CF-foam concrete.
Test Methods
A single impact compression test was carried out by means of SHPB experimental technology to measure the mechanical properties of specimens under dynamic impact (Davies and Hunter, 1963; Frew et al., 2001). A Φ75 mm SHPB set-up, consisting mainly of the loading system, the measuring system, and the data acquisition and processing system, was adopted in this study. In this SHPB set-up, the bullet was 75 mm in diameter and 500 mm in length, the incident bar was 75 mm in diameter and 5.5 m in length, and the transmission bar was 75 mm in diameter and 3.5 m in length. The distances from the two strainmeters on the incident bar to the impact point were 2.54 and 2.76 m respectively, while the distance from the strainmeters on the transmission bar to the impact point was 1 m. A detailed schematic diagram of experimental set-up was displayed in Figure 3.
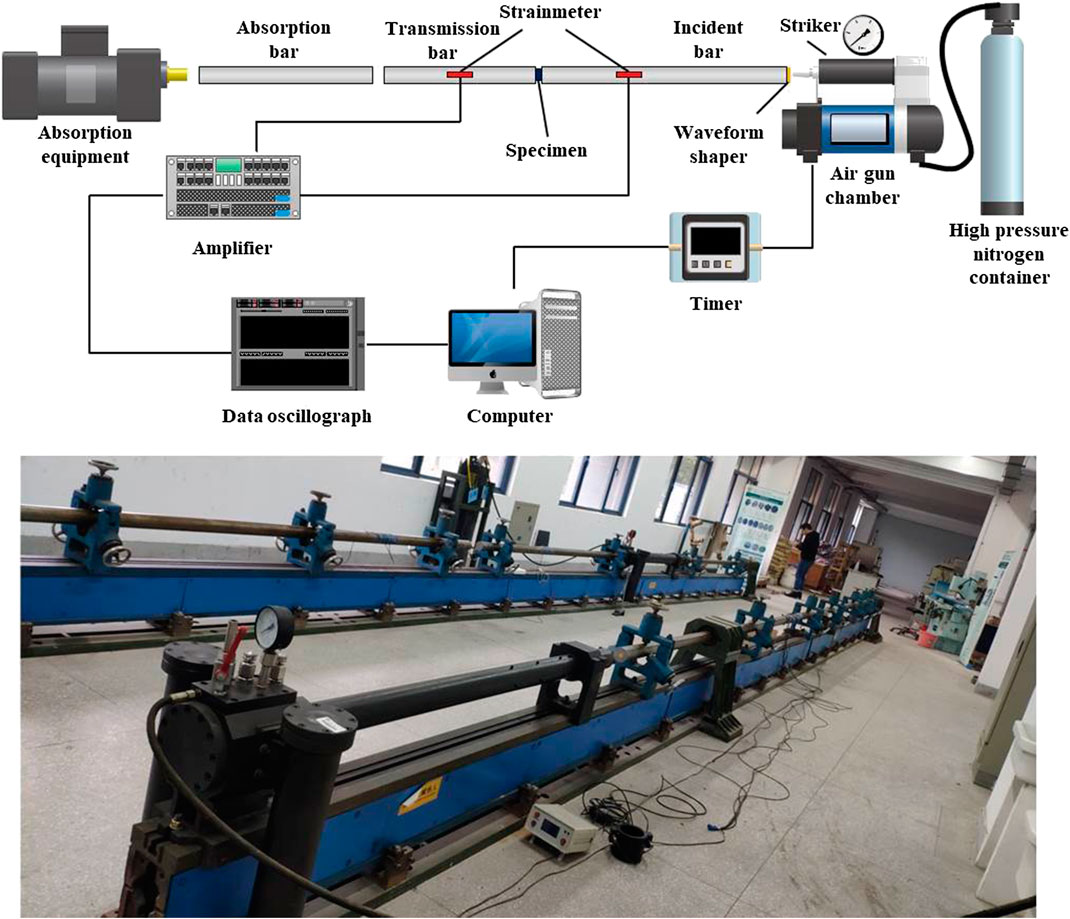
FIGURE 3. Test equipment.
Experimental operating procedure was presented as follows: Firstly, the specimen was polished using a high precision grinding machine to ensure the smoothness and parallelism of their two surfaces. Secondly, the specimen with petrolatum applied to its two surfaces was placed between the incident bar and the transmission bar. Thirdly, the signal acquisition system was calibrated, and the gas pressure was set up. Finally, the valve of the air gun was released and the incident bar was then hit by the bullet.
The SHPB experimental technique was based on the assumption of one-dimensional elastic wave and the assumption of homogeneity of the stress and strain. The working principle of SHPB set-up was described as follows: The bullet, driven by the high-pressure gas, hit the incident bar with a certain velocity V0. A stress wave εi (t) was thus generated and propagated in the incident bar. As a result, a high speed deformation of specimen occurred under the action of this wave. In the meantime, a wave εr (t) was reflected from the specimen to the incident bar while a wave εt (t) was transmitted from the specimen to the transmission bar. After that, the three strain signals were measured by strainmeters and collected by a dynamic strain indicator. Then, the data signals were processed using the professional SHPB software, and the dynamic properties of specimens could then be obtained (Wang et al., 2011).
According to the one-dimensional elastic wave theory, the stress, strain and strain rate of the specimen can be formulated as follows:
Where εi (t), εr (t) and εt (t) are the incident stress wave, the reflect stress wave, and the transmitted stress wave, respectively. A0 is the cross sectional area of the bar. E0 is the Young’s modulus of the bar material. C0 is the wave velocity. As and Ls are the original cross sectional area and the length of the specimen, respectively.
Based on the assumption of homogeneity of the stress and strain in the specimen, a relationship among the stress, strain and strain rate can be gained as below:
Substituting Eq. 4 into Eq. 1Eq. 3 then turns into
The dynamic properties of the specimen were calculated according to the above equations. In SHPB set-up, by setting different driving gas pressures (0.20, 0.25, and 0.30 MPa), the impact speed of the bullet was adjusted to generate different stress waves εi (t), εr (t) and εt (t), which were corresponding to different strain rates. Nine identical specimens in each of the six groups were equally divided into three sets and subjected to impact loads under the three different driving gas pressures. Each specimen was numbered in a sequence of CF content-gas pressure-sequence number in each set. For instance, a specimen numbered CF1.5-AP0.25-3 is the third one of the set at the gas pressure of 0.25 MPa with a CF content of 1.5%. More detailed test parameters are offered in Table 6.
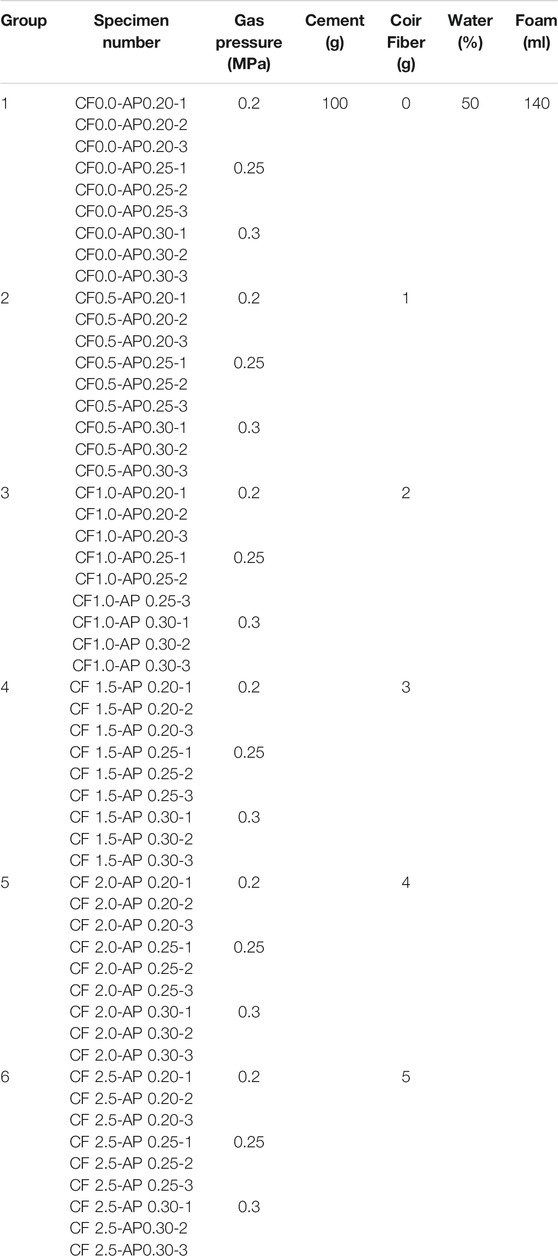
TABLE 6. Specimen parameters.
In addition, a microscopic study based on SEM and XRD was conducted to further explain the changing mechanism of CF-foam concrete performance. After SHPB tests, in total of 18 typical damaged specimens, evenly selected from the six groups, were processed for microstructure analysis. The specimens’ morphologies were observed by SEM and the specimens’ phase constitutions were characterized by means of XRD. Besides, the pore structure parameters of specimens were determined using the image analysis method (Zhang et al., 2015; Raiyani et al., 2016).
Results and Analyses
Experimental results were collated and analyzed to explore the influence of CF content on the dynamic performance of foam concrete. It should be noted that the experimental data of specimens with a CF content of 2.5% at the gas pressure of 0.3 MPa was missing due to some problems in the test equipment.
Failure Modes
For facilitating the discussion of failure modes, one representative specimen was selected from each set for analysis. F4F6 describe the damaged specimens incorporated with different CF contents at three gas pressures. Specimens without CF ruptured into small pieces or crumbled into powder, obviously performing brittle failures, as shown in Figures 4A, 5A, 6A. With CF content increasing from 0.5 to 1.5%, specimens presented less damage and basically kept their integrity with only slight ruptures and peelings on their edges, as shown in Figures 4B–D, 5B–D, 6B–D. Even at a high gas pressure of 0.3 MPa, as shown in Figures 6B–D, these specimens with adequate CF contents also only ruptured on their edges instead of crumbling into powder or rupturing into small pieces, indicating that the incorporation with sufficient CF could effectively improve the deformation resistance of foam concrete and promote the specimen’s failure mode from brittle failure to ductile failure. This was mainly attributed to the improvement effect of CF on the integrity and shock resistance of the concrete matrix. However, failure modes showed slight changes for specimens with CF contents of 2.0 and 2.5%, as described in Figures 4E,F, 5E,F, 6E. These specimens with excessive amounts of CF tended to display remarkably similar failure modes, indicating that the effectiveness of CF was limited in improving the plasticity and impact resistance of foam concrete.
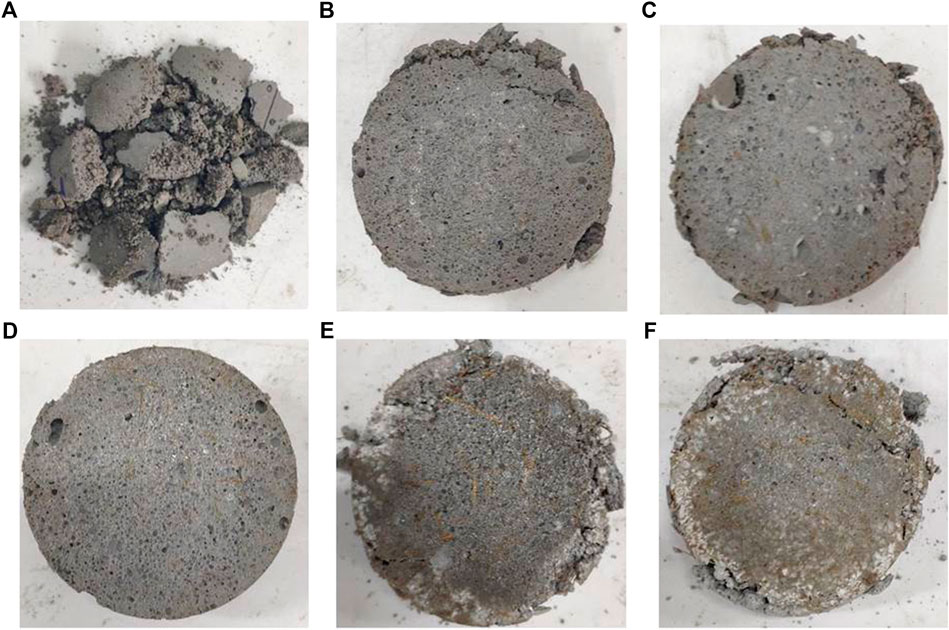
FIGURE 4. Failure modes at the gas pressure of 0.2 MPa (A) CF0.0-AP0.20-1 (B) CF0.5-AP0.20-3 (C) CF1.0-AP0.20-1 (D) CF1.5-AP0.20-2 (E) CF2.0-AP0.20-3 (F) CF2.5-AP0.20-3.
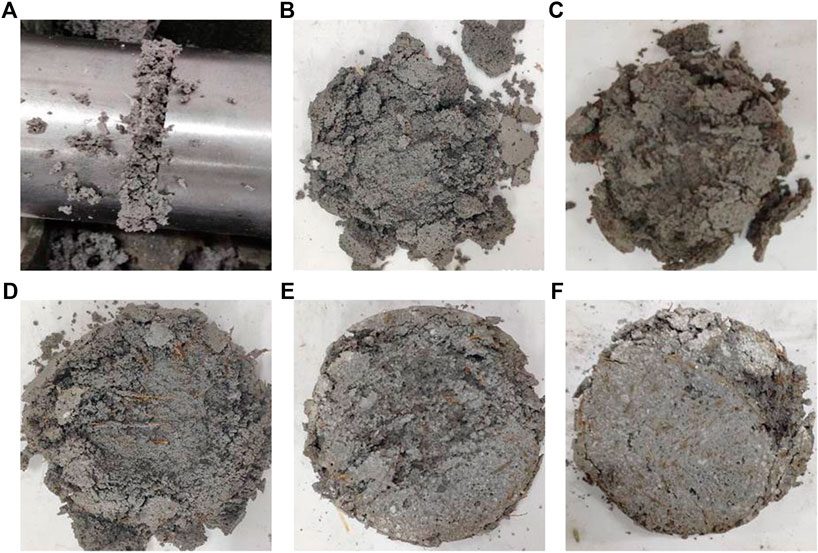
FIGURE 5. Failure modes at the gas pressure of 0.25 MPa (A) CF0.0-AP0.25-2 (B) CF0.5-AP0.25-3 (C) CF1.0-AP0.25-3 (D) CF1.5-AP0.25-1 (E) CF2.0-AP0.25-3 (F) CF2.5-AP0.25-1.
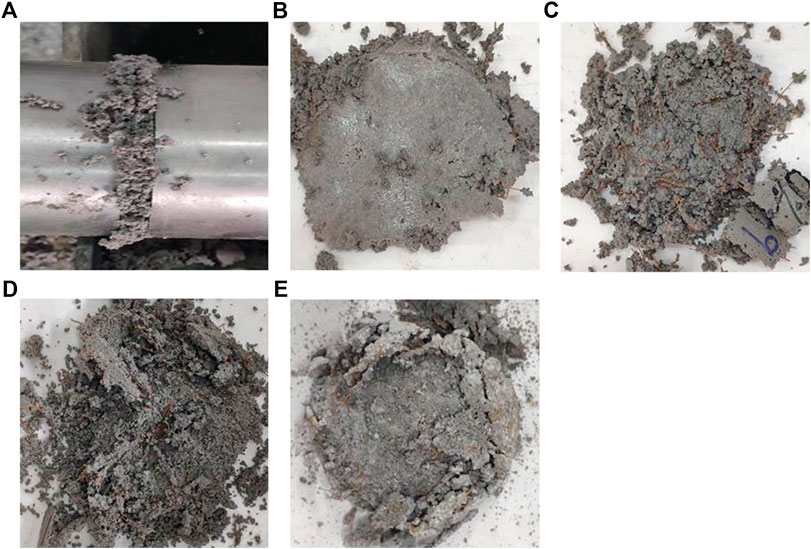
FIGURE 6. Failure modes at the gas pressure of 0.3 MPa (A) CF0.0-AP0.30-3 (B) CF0.5-AP0.30-3 (C) CF1.0-AP0.30-2 (D) CF1.5-AP0.30-1 (E) CF2.0-AP0.30-3.
Dynamic Compression Strength
Figure 7 provides the dynamic compression strengths and dynamic increase factors of specimens, with different colors representing different gas pressures: gray for 0.2 MPa, red for 0.25 MPa, and blue for 0.3 MPa.
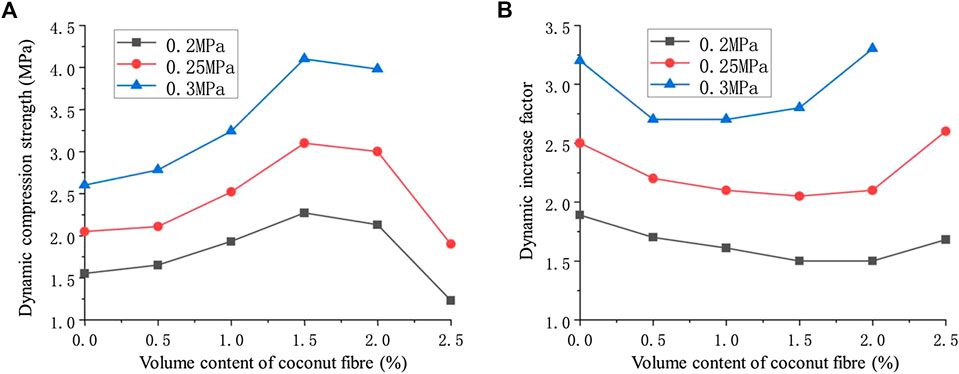
FIGURE 7. Dynamic compression strength and dynamic increase factor (A) Dynamic compression strength (B) Dynamic increase factor.
It could be observed from Figure 7A that the varying tendencies of dynamic compressive strengths with the increasing CF content increasing were basically identical at different gas pressures, that is, increased first and then decreased. Take the changing curve of the dynamic compressive strength with CF content at the gas pressure of 0.20 MPa for example (the gray curve in Figure 7A). The compressive strengths of specimens with CF contents of 0.0, 0.5, 1.0, 1.5, 2.0, and 2.5% were 1.55, 1.65, 1.93, 2.27, 2.13, and 1.23 MPa, respectively. It could be found that the specimen without CF had a low compressive strength of 1.55 MPa. With CF added, the compressive strength rose fast and reached a maximum value of 2.27 MPa at the CF content of 1.5%. The growth rate of the compressive strength was 46.45%. Similarly, for the other two changing curves at gas pressures of 0.25 and 0.3 MPa, the optimal CF content to get the maximum dynamic compressive strength was also 1.5%. When incorporated with 1.5% CF, the specimens had their highest dynamic compressive strengths of 3.18 MPa (at 0.25 MPa gas pressure) and 4.21 MPa (at 0.30 MPa gas pressure). This revealed that CF had an obvious improvement effect on the dynamic compressive property of foam concrete.
However, the dynamic compressive strengths of specimens stated to fall once the CF content exceeded 1.5% and dropped to their minimum values at CF content of 2.5%. Also take the gray curve (at 0.20 MPa gas pressure) in Figure 7A for example, the dynamic compressive strength of the specimen with the CF content of 2.5% was 1.23 MPa, which was even lower than that of the specimen without CF. This demonstrated that CF’s improvement the dynamic compressive property of foam concrete, which was highly dependent on the CF content, would be cut off when the CF content exceeded the threshold (1.5% in this study).
Additionally, all specimens appeared higher in strength at a higher gas pressure due to a strain rate effect (Sun et al., 2018). A higher impact load (i.e., a higher gas pressure) corresponded to a larger loading strain rate, which contributed to an increase in compression strength.
In a previous study, the static compressive strength of CF-foam concrete with the same mix design has been tested and obtained. The result showed that with CF content growing from 0.0 to 2.5%, the static compressive strengths first increased and then decreased, the values of which were 0.82, 0.96, 1.20, 1.51, 1.42, and 0.73 MPa, respectively. Obviously, the changing law of static compressive strength was coincided basically with that of dynamic compressive strength. This revealed that CF showed the same effect on both dynamic and static compressive strengths.
In order to further understand the change mechanism of concrete performance, the effect of CF on concrete performance was discussed based on SEM and XRD results from both positive and negative aspects.
On the positive side, CF showed an improvement effect on concrete performance. It was known that the mechanical strength of concrete was mainly attributed to Calcium Silicate Hydrate gel (C-S-H gel), a major hydration product of the cement, which possessed great compression performance, but behaves poorly in tension and toughness. After CF was added into the foam concrete, the matrix, an aggregation of crystal hydrates comprising unreacted cement particles and hydration products, connected with CF to form a space net structure with good integrity, as shown in Figure 8. The hydrogen bonding between CF lignin and C-S-H gel as well as the high tensile strength of CF contributed to an excellent interfacial bond behavior between CF and the matrix, leading to the significant improvement of concrete strength (Uygunolu, 2008; Yang et al., 2010).
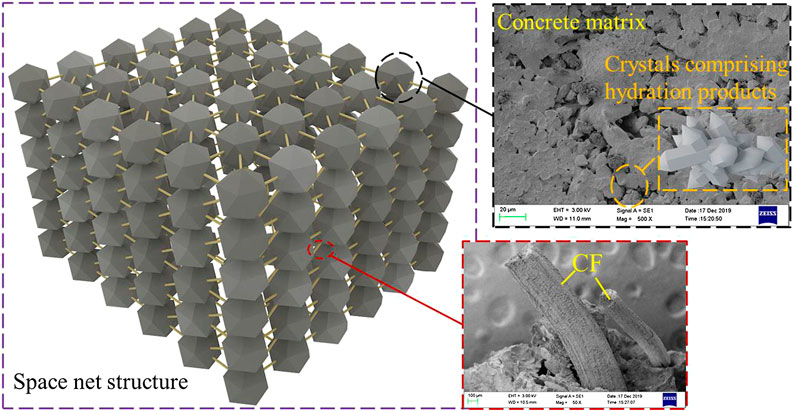
FIGURE 8. Space net structure.
Meanwhile, calcium hydroxide, another hydration product of the cement, increased in intensity from 870 to 1,473 a. u. with CF content rising from 0.0 to 2.5%, as displayed in the XRD spectrum from Figure 9A. This indicated that CF caused an increase of calcium hydroxide although it did not participate in cement hydration reaction. As observed from Figure 9B, calcium hydroxide could fill pores within concrete to increase the compactness of concrete, improve the interfacial bond between CF and the cement matrix, and prevent the cracks in concrete from occurring and expanding, resulting in better concrete performance.
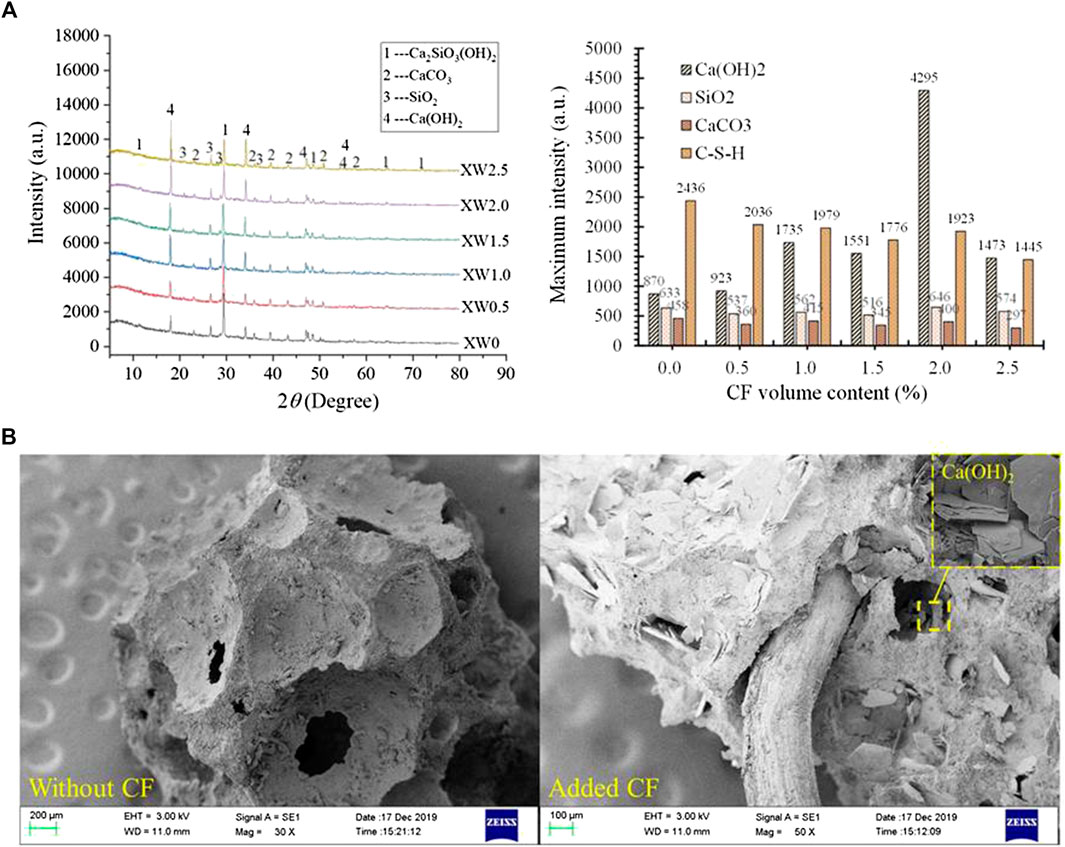
FIGURE 9. Microstructure (A) XRD spectrum (B) SEM result.
Moreover, as can be seen from Figure 10, the pores became fewer, smaller, and more uniform with CF added. The porosity and the average pore diameter decreased with CF content increasing. The difference between the roundness value and 1.0 (the optimal value of roundness), which represented the regularity of the pore shapes, also decreased after adding CF. This also confirmed that the proper content of CF improved the concrete performance by contributing to a better concrete pore structure (Zhu et al., 2017; Zhou et al., 2019).
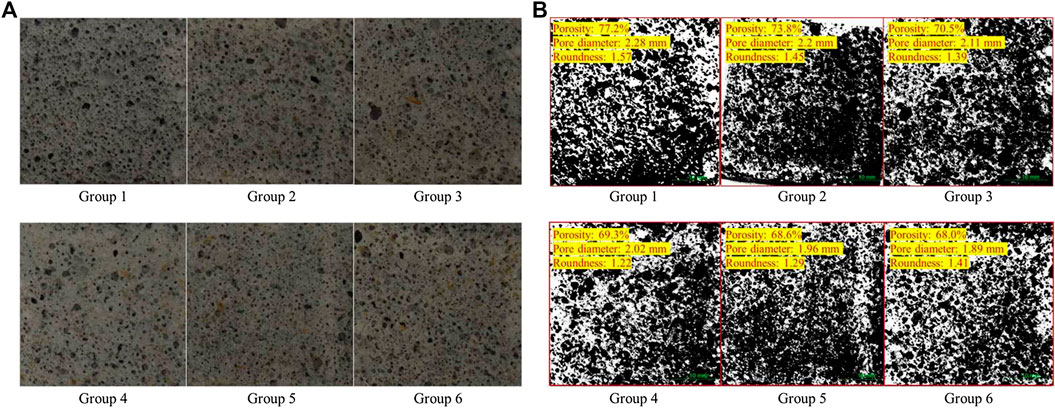
FIGURE 10. Pore structure (A) High-definition photo of specimen sections (B) Pore structure parameters.
However, CF also presented a negative effect on concrete performance. CF caused the C-S-H gel intensity to drop from 2,436 to 1,445 a. u., as displayed in Figure 9A, which was detrimental to concrete strength. An excessive amount of CF absorbed too much water and joined together to form agglomerates, causing dry shrinkage cracks and poor fluidity of cement slurry. Besides, internal bubbles were cut through by excess CF and merged into bar-shape pores. As for pore structure, pores tended to be too small and non-uniform.
These above findings suggested that when CF content was less than the threshold, the positive effect played a dominant role, leading to an increase of concrete strength. However, once CF content exceeded the threshold, the negative effect started to outweigh the positive one, resulting in a degradation of concrete strength.
The dynamic increase factor was calculated using Eq. 8 according to (de Andrade Silva et al., 2011):
where DIF is the dynamic increase factor, fc,d is the dynamic compressive strength, and fc,s is the static compressive strength.
DIF generally presented a trend of falling first and then rising, as in Figure 7B. Take the two red curves (at gas pressure of 0.25 MPa) in Figures 7A,B as examples, DIF obviously had a totally opposite changing trend to dynamic compression strength. With CF content increasing from 0.0 to 1.5%, dynamic compression strength rose while DIF dropped instead. When CF content was more than 1.5%, dynamic compression strength began decreasing while DIF started rising slowly. After CF content exceeded 2.0%, both the descent speed of dynamic compression strength and the growth rate of DIF increased sharply. This demonstrated a smaller effect of CF content on the dynamic compression strength than on the static compressive strength. Comparison between the dynamic compression strength and static compression strength also showed that the dynamic compression strength presented a smaller change rate than the static compressive strength.
Moreover, the threshold of CF content was smaller in the case of higher gas pressures. As presented in Figure 7B, the threshold of CF content for the starting of DIF increase was 2% at 0.2 MPa gas pressure, but 1.5% at 0.25 MPa gas pressure and only 0.5% at the highest of 0.3 MPa gas pressure. That was ascribed to the lower static compression strengths of specimens with less CF and the more significant dynamic effect at higher gas pressure.
Stress-Strain Curves
Dynamic compression stress-strain (S-S) curves could be divided into three segments as shown in Figure 11A: ascending segment (O–A), platform segment (A–B), and descending segment (B--C). Figures 11B–D provide the S-S curves of specimens with different CF contents at 3 gas pressures, where six different colors represent 6 CF contents: black for 0.0%, red for 0.5%, blue for 1.0%, green for 1.5%, purple for 2.0%, and yellow for 2.5%.
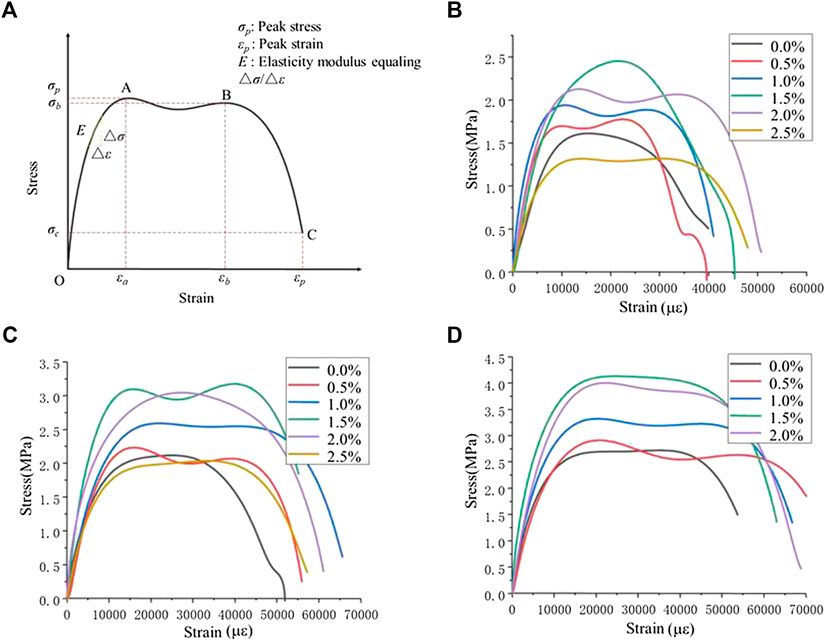
FIGURE 11. Stress-strain curves (A) Schematic (B) S-S curves at the gas pressure of 0.2 MPa (C) S-S curves at the gas pressure of 0.25 MPa (D) S-S curves at the gas pressure of 0.3 MPa.
In the ascending segment (O–A), all specimens displayed similar S-S behaviors. The stress increased approximately linearly up to the peak value (point A) at a rapid speed, indicating that the specimen exhibited an elastic behavior. With CF content increasing, the peak stress (point A) first rose to the maximum value when CF content was 1.5%, and then fell to the minimum value when CF content was 2.5%. Simultaneously, the peak strain of O–A (strain at point A) first decreased and then increased with the increase of CF content. This could be explained by the microstructure analysis in Dynamic Compression Strength.
The elasticity modulus, i.e., the slope of O–A as shown in Figure 11A, was approximately equal to σp/εa in this stage. From Figures 11B–D, it could be observed that the elasticity modulus first increased and then decreased with CF content growing. The elasticity modulus at the gas pressure of 0.25 MPa (i.e., the slopes of curves in Figure 11C), e.g., first increased to the maximum when CF content increased to 1.5%, then decreased to the minimum when CF content increased to 2.5%. The increase in elasticity modulus was attributed to the improvement effect of CF on concrete performance, while the decrease in elasticity modulus could be explained according to the composite material theory (Swamy, 1970): In CF-foam concrete, the elastic modulus of concrete matrix was compromised by the lower elastic modulus of CF. When CF content was no more than 1.5%, CF deducted the elastic modulus of the concrete matrix limitedly but improved it dominantly. Whereas once CF was in excess, the reduction effect of CF became increasingly obvious, gradually offset and outweighed the improvement effect, and eventually led to the ultimate reduction of elastic modulus.
In the platform segment (A–B), cracks had propagated to larger widths, causing sufficient tensile stress in CF to neutralize the compressive stress in the matrix. Thus, after point A, the stress no longer showed a significant change while the strain still kept growing, indicating that CF-foam concrete entered the plastic deformation. The stress plateau, consistent with the peak stress, first increased and then declined with CF content increasing, with its value at 2.0 MPa gas pressure, e.g., close to 1.55, 1.75, 1.9, 2.5, 2.1, and 1.25 MPa when CF contents were 0.0, 0.5, 1.0, 1.5, 2.0, and 2.5%, respectively.
As displayed in Figure 11A, the width of stress plateau A–B (i.e., εb minus εa) could be used to evaluate the plastic deformation capacity of the specimen. Take the S-S curves in Figure 11C as an example, plateau widths at the gas pressure of 2.5 MPa first grew and then decreased with the CF content growing, indicating that the plasticity of concrete matrix was improved with the proper amount of CF involved, but was reduced when CF was in excess. This was because that the connection performance of CF with the matrix was first enhanced and then weakened with CF content increasing, which could also be explained by the microstructure analysis elaborated in Dynamic Compression Strength.
In the descending segment (B–C), the curve started to drop after point B, with decreasing stress and increasing strain, suggesting that the specimen was losing its load-bearing capacity. This was because with the farther development of cracks, CF was pulled out from the matrix or ruptured, resulting in the connection failure between CF and the matrix. Moreover, it could be observed from Figures 11B–D that the width of O–C (i.e., the total strain), representing the dynamic deformation capacity of CF-foam concrete, increased with the gas pressure rising, which was due to the strain rate effect mentioned in Dynamic Compression Strength.
Energy Absorption
Dynamic compressive energy absorption, the value of which equals to the area under the S-S curve, was calculated using Eq. 9 (Su et al., 2010):
where S is the energy absorption, σ is the stress, ε is the strain, and εp is the peak strain. Figure 12A offers the schematic for energy absorption calculation.
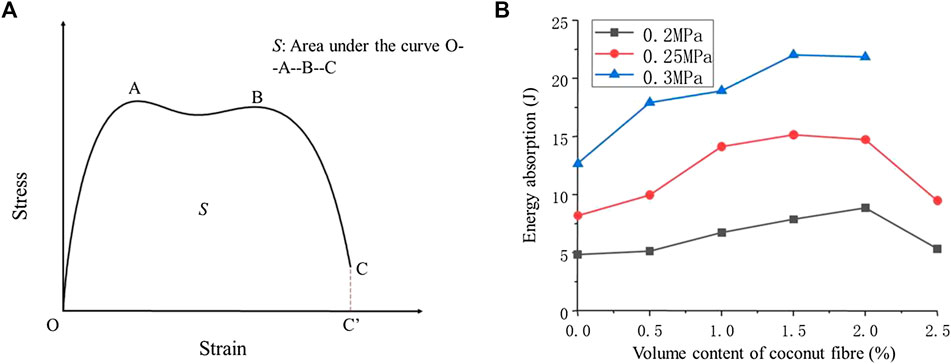
FIGURE 12. Energy absorption capability (A) Schematic (B) Energy absorptions of specimens.
Change curves of energy absorption with CF content were obtained and shown in Figure 12B, with three different colors distinguishing three gas pressures: gray for 0.2 MPa, red for 0.25 MPa, and blue for 0.3 MPa.
Test results showed that the energy absorption had a trend of increasing earlier and declining later with CF content increasing. Take the gray curve (at 0.2 MPa gas pressure) as an example, the energy absorptions of specimens were 4.8, 5.1, 6.7, 7.9, 8.9, and 5.3 J with CF contents of 0.0, 0.5, 1.0, 1.5, 2.0, and 2.5%, respectively. It was found that the specimen without CF had the low energy absorption of 4.8 J. After adding CF, the energy absorption increased obviously. The specimen with the CF content of 2.0% was proved to have the best energy absorption of 8.9 J. The growth rate of the energy absorption was 85.42% with CF content increasing from 0.0 to 2.0%. Similarly, for the other two changing curves at gas pressures of 0.25 and 0.3 MPa, the energy absorptions reached their maximum values of 14.9 and 22.4 J respectively at the CF content of 1.5%.
Further more, in the previous study on the static performance of CF-foam concrete with the same mix design, CF has been proved to have the same effect on the static compressive energy absorption of foam concrete. The result showed that the static compressive energy absorption increased from 55.37 to 106.32 J with CF content growing from 0.0 to 2.0%. The growth rate was up to 92.02%.
These all confirmed that the energy absorption property of foam concrete could be effectively enhanced by incorporating with CF.
However, the growth of energy absorption went into reverse when CF content exceeded the threshold. Continuing the example of the gray curve mentioned above, the energy absorption of the specimen with the CF content of 2.5% was 5.3 J, which was only 10.42% more than that of the specimen without CF. This demonstrated that the CF’s improvement on the energy absorption property of foam concrete was highly dependent on the CF content. Too much CF could instead lead to a decrease in concrete performance.
The reason for this change was as follow: CF distributed in concrete formed a powerful space net structure, which inhibited the cracks in concrete from generating and developing, and encouraged energy absorption during crack propagation. However when CF in concrete was excess, the fluidity of foam concrete slurry decreased and an obvious stress concentration occurred at the CF-concrete matrix interface, resulting in the degradation of energy absorption performance. This was in accordance with the proposed microstructure analysis in Dynamic Compression Strength.
Moreover, from the gray curve, it could also be observed that the increase in energy absorption of specimen with 0.5% CF content was rather negligible compared to the specimen without CF. While the blue curve (at 0.3 MPa gas pressure) suggested the energy absorption of foam concrete could be significantly improved with just a little CF. This could be explained as follows: when at a lower gas pressure (lower strain rate), a small amount of CF incorporated was not sufficient to inhibit entirely the generation and expansion of micro-cracks inside the concrete. Meanwhile, the stress concentration phenomenon induced by these micro-cracks impaired the energy absorption capacity of concrete, which offset the improvement effect of CF on energy absorption. However, when at a higher gas pressure (higher strain rate), the impact loading time was noticeably shorter, thus the stress concentration did not occur before the failure of specimen. Consequently, a higher strain rate was beneficial to the improvement effect of CF on the energy absorption capacity of concrete.
Conclusion
This experimental study has proved the feasibility and validity of CF being used in concrete reinforcement as an alternative to conventional fibers. The results revealed the changing law of foam concrete performance with CF content and clarified the optimal content of CF for improving the dynamic performance of foam concrete. Hence, this study provided a valuable reference for the application of CF as an additive material in concrete.
(1) The incorporation with CF can effectively improve the plastic deformation capacity of foam concrete. Test specimens undergo a brittle to ductile transition as CF content increases, and present most excellent integrity and plasticity with the CF content of 2.0%. However, the failure modes of specimens show negligible change once the CF content exceeds 2.0%.
(2) An Appropriate amount of CF can improve the dynamic compression strength of foam concrete, while excess CF has the opposite effect. For getting the maximum dynamic compressive strength, the optimal CF content is 1.5% in this study. Moreover, the dynamic compressive strength is higher at a higher gas pressure due to the strain rate effect. In addition, dynamic increase factor shows a reverse change trend to that of dynamic compression strength.
(3) The addition of appropriate CF contributes to a higher elasticity modulus and plastic deformation capacity of foam concrete, but excess CF has adverse effect. Moreover, the failure strain of CF-foam concrete increases with the gas pressure rising.
(4) With CF content increasing, the energy absorption capacity of foam concrete increases significantly. However, specimens with excessive CF show poor energy absorption performances. In addition, CF has a better improvement effect on the energy absorption capacity of foam concrete at a higher gas pressure.
Data Availability Statement
The raw data supporting the conclusions of this article will be made available by the authors, without undue reservation.
Author Contributions
JL was responsible for experiment scheme design, test execution, data analysis and writing the original manuscript. JZ and LZ were responsible for experiment scheme guidance, theoretical guidance and manuscript revision. ZL and ZJ were responsible for participating in experimental scheme design, test execution and data analysis.
Conflict of Interest
The authors declare that the research was conducted in the absence of any commercial or financial relationships that could be construed as a potential conflict of interest.
Acknowledgments
The authors are thankful to the National Natural Science Foundation of China (Project No. 51608137) and Graduate Student Innovation Ability Cultivation Fund of Guangzhou University (Project No. 2019GDJC-M38) for their financial support to help us complete the experiment in this paper.
References
Ali, M., Liu, A., Sou, H., and Chouw, N. (2012). Mechanical and dynamic properties of coconut fibre reinforced concrete. Construct. Build. Mater. 30 (30), 814–825. doi:10.1016/j.conbuildmat.2011.12.068
Calado, V., Barreto, D. W., and Dalmeida, J. R. (2000). The effect of a chemical treatment on the structure and morphology of coir fibers. J. Mater. Sci. Lett. 19 (23), 2151–2153. doi:10.1023/a:1026743314291
Danso, H., and Manu, D. (2020). Influence of coconut fibres and lime on the properties of soil-cement mortar. Case Stud. Constr. Mater. 12, e00316. doi:10.1016/j.cscm.2019.e00316
Davies, E. D. H., and Hunter, S. C. (1963). The dynamic compression testing of solids by the method of the split Hopkinson pressure bar. J. Mech. Phys. Solid. 11 (3), 155–179. doi:10.1016/0022-5096(63)90050-4
Etkin, A., Foley, K. J., and Goldman, J. H. (2010). Effect of double-additives fly ash and expanded perlite on properties of foam concrete. Fly Ash Comp. Util., 36 (25), 1482–1484. doi:10.1103/PhysRevLett.36.1482
Silva, F. d. A., Butler, M., Mechtcherine, V., Zhu, D., and Mobasher, B. (2011). Strain rate effect on the tensile behaviour of textile-reinforced concrete under static and dynamic loading. Mater. Sci. Eng. 528 (3), 1727–1734. doi:10.1016/j.msea.2010.11.014
Frew, D. J., Forrestal, M. J., and Chen, W. (2001). A split Hopkinson pressure bar technique to determine compressive stress-strain data for rock materials. Exp. Mech. 41 (1), 40–46. doi:10.1007/bf02323102
Gray, G. T. I. (2000). Classic split-hopkinson pressure bar testing. Mech. Test. Eval. 8, 462–476. doi:10.31399/asm.hb.v08.a0003296
Kearsley, E. P., and Wainwright, P. J. (2001). The effect of high fly ash content on the compressive strength of foamed concrete. Cement Concr. Res. 31 (1), 105–112. doi:10.1016/s0008-8846(00)00430-0
Kudyakov, A. I., and Steshenko, A. B. (2015). Shrinkage deformation of cement foam concrete. IOP Conf. Ser. Mater. Sci. Eng, 71 (1), 012019. doi:10.1088/1757-899x/71/1/012019
Ma, Y. P., Li, G. Y., and Yang, L. X. (2012). Effect of the apparent density and polypropylene Fiber on drying shrinkage cracking properties of foam concrete. Mater. Rev., 026 (006), 121–125. doi:10.3969/j.issn.1005-023X.2012.06.033
Mohamad, N., Iman, M. A., Othuman Mydin, M. A., Samad, A. A. A., Rosli, J. A., and Noorwirdawati, A. (2018). Mechanical properties and flexure behaviour of lightweight foamed concrete incorporating coir fibre. IOP Conf. Ser. Earth Environ. Sci. 140, 012140. doi:10.1088/1755-1315/140/1/012140
Raiyani, S., Morbia, U., and Karanjiya, P. (2016). “XRD and SEM analysis of biofiber reinforced concrete,” 7th national conference on emerging vistas of technology in 21st century, Vadodara, India, 8–9 April, 2016.
Shang, S. S., and Song, X. B. (2016). Experimental research on mechanicals performance of carbon nanotubes reinforced concrete. Appl. Mech. Mater. 858, 173–178. doi:10.4028/www.scientific.net/amm.858.173
Shen, H. R., She, Y. X., and Gao, P. W. (2012). The influence of polypropylene fiber on the performance of concrete pavement. Amministrare 178–181, 1099–1103. doi:10.4028/www.scientific.net/amm.178-181.1099
Su, H. Y., Xu, J. Y., and Li, M. (2010). Energy-absorption property of ceramic fiber reinforced concrete. Adv. Mater. Res. 168-170, 1970–1975. doi:10.4028/www.scientific.net/amr.168-170.1970
Sun, X., Zhao, K., Li, Y., Huang, R., Ye, Z., Zhang, Y., et al. (2018). A study of strain-rate effect and fiber reinforcement effect on dynamic behavior of steel fiber-reinforced concrete. Construct. Build. Mater. 158, 657–669. doi:10.1016/j.conbuildmat.2017.09.093
Swamy, P. A. V. B. (1970). Efficient inference in a random coefficient regression model. Econometrica 38, 311–323. doi:10.2307/1913012
Uygunolu, T. (2008). Investigation of microstructure and flexural behavior of steel-fiber reinforced concrete. Mater. Struct. 41 (8), 1441–1449. doi:10.1617/s11527-007-9341-y
Wang, H. W. (2011). Effect of polypropylene fiber on mechanical properties of concrete containing fly ash. Adv. Magn. Reson. 346, 26–29. doi:10.4028/www.scientific.net/amr.346.26
Wang, S., Zhang, M. H., and Quek, S. T. (2011). Effect of specimen size on static strength and dynamic increase factor of high-strength concrete from SHPB test. J. Test. Eval. 39 (5), 898–907. doi:10.1520/jte103370
Wang, W., and Chouw, N. (2017). The behaviour of coconut fibre reinforced concrete (CFRC) under impact loading. Construct. Build. Mater. 134, 452–461. doi:10.1016/j.conbuildmat.2016.12.092
Yang, S., Gao, D., and Zhao, J. (2010). Microstructure of fiber reinforced concrete with slag power after effect of high temperatures. J. Southeast Univ. 40 (2), 102–106.
Zhan, B. G., Guo, J. L., and Lin, X. S. (2009). Properties of foamed concrete with fiber glass reinforcement. J. Hefei Univ. Technol. (Nat. Sci.) 32 (2), 226–229. doi:10.1109/CLEOE-EQEC.2009.5194697
Zhang, P., Li, Q., and Zhang, H. (2011). Combined effect of polypropylene fiber and silica fume on mechanical properties of concrete composite containing fly ash. J. Reinforc. Plast. Compos. 30 (16), 1349–1358. doi:10.1177/0731684411425974
Zhang, Q., Liu, G. L., and Cheng, C. H. (2015). Mechanical experimental research on high strength concrete after high temperature based on XRD. China Concr. Cement Prod. 3, 9–11. doi:10.19761/j.1000-4637.2015.03.003
Zhou, J., Kang, T., and Wang, F. (2019). Pore structure and strength of waste fiber recycled concrete. J. Eng. Fibers Fabr. 14 (5), 155892501987470. doi:10.1177/1558925019874701
Keywords: foam concrete, coir fiber, dynamic performance, impact experiments, microstructure
Citation: Zhang J, Li J, Zhang L, Liu Z and Jiang Z (2020) Dynamic Performance of Foam Concrete With Recycled Coir Fiber. Front. Mater. 7:567655. doi:10.3389/fmats.2020.567655
Received: 30 May 2020; Accepted: 25 August 2020;
Published: 30 October 2020.
Edited by:
Baolin Wan, Marquette University, United StatesReviewed by:
Hazizan Md. Akil, University of Science Malaysia, MalaysiaMahbub Hasan, Bangladesh University of Engineering and Technology, Bangladesh
Copyright © 2020 Zhang, Li, Zhang, Liu and Jiang. This is an open-access article distributed under the terms of the Creative Commons Attribution License (CC BY). The use, distribution or reproduction in other forums is permitted, provided the original author(s) and the copyright owner(s) are credited and that the original publication in this journal is cited, in accordance with accepted academic practice. No use, distribution or reproduction is permitted which does not comply with these terms.
*Correspondence: Liwen Zhang, bHd6aGFuZ0Bnemh1LmVkdS5jbg==