 Haoyang Peng1
 Peng Lin
- 1Department of Hydraulic Engineering, Tsinghua University, Beijing, China
- 2Institute for Network Sciences and Cyberspace, Tsinghua University, Beijing, China
- 3China Three Gorges Corporation, Beijing, China
During the concrete pouring process of a dam construction, timely and accurate temperature monitoring is of great significance to reveal the thermal distribution characteristics and evolution process, and control concrete cracking. In this study, a positioning method of temperature sensors (PMTS) in a concrete dam is developed to determine the arrangement of temperature sensors quantitatively. The proposed positioning method is related to the restructured thermal field based on the natural neighbor interpolation algorithm, and the cross-validation. Based on the method, thermometers, distributed optical fibers and infrared thermal imagers are optimally installed in a super-high arch dam for real-time measurement of concrete temperature. The results show that the PMTS is reasonable and reliable for obtaining the dam global thermal field. The on-site temperature monitoring data indicate that the time and space temperature distribution law of the restructured thermal field is consistent with the actual situation of the super-high arch dam. In addition, the cons and pros, and improvement of the PMTS are further discussed. The proposed PMTS is a valuable method to monitor the global thermal field of concrete dams.
Introduction
Concrete dams usually have a large pouring size during construction. Due to the large amount of heat released by cement hydration, the concrete temperature rises sharply. As concrete age increases, the concrete temperature would decrease because of the ambient temperature influence. Different concrete areas have temperature differences during the process of temperature change. Under certain constraints, a remarkable thermal stress could be generated (Lin et al. 2014). Since mass concrete usually contains few steel bars, the thermal stress is almost entirely borne by the concrete. Concrete is a fragile material, and the tensile strength is generally 1/10 of the compressive strength. The ultimate tensile deformation during short-term loading is only (0.6–1) × 10−4, and (1.2–2) × 10−4 during the long-term loading (Zhu 1999). Therefore, if a larger tensile stress is generated due to the temperature change, a greater impact on the crack resistance of the concrete would be inevitable (Jaafar et al. 2007; Lin et al. 2015; Schackow et al. 2016; Lin et al. 2018; Lin et al. 2019). In order to effectively control the temperature change process of mass concrete and reduce the risk of concrete cracking, timely and accurate temperature monitoring is of great significance during a concrete dam construction (Lin et al. 2012; Peng et al. 2019). Generally, with the pouring of dam concrete, a number of temperature sensors are synchronously buried to obtain the real-time temperature.
At present, there are mainly three types of concrete temperature sensors:
1) thermometers for point temperature measurement inside concrete. In concrete dams, the most commonly used temperature sensors are thermometers. In order to verify the cooling effect and observe the long-term temperature change, 440 resistance thermometers are installed in the concrete during the Hoover Dam construction (Fan et al. 2016). Most of these thermometers are placed on two symmetrical cross-sections about 30 m away from the central cross-section. Almost all thermometers are placed 15 m–23 m away from the galleries. About 70 resistance thermometers installed at a depth of some centimeters from the external surface in the Alto Lindoso dam are used to monitor the temperature of air, water and concrete (Mata et al. 2014). There are 26 thermometers installed in the La Baells double curvature arch dam. The water temperature is measured by means of five water thermometers installed at the upstream surface of the dam. The concrete temperature is measured by means of 21 concrete thermometers at midpoints between dam surfaces (Santillán et al. 2014; Santillan et al. 2015). The Tichy Haf arch dam is equipped with 12 thermometers for temperature monitoring. The thermometers are usually located at 4 m–5 m away from the upstream or downstream surface, or in the middle of the concrete blocks (Belmokre et al. 2019). In buttress No.13 of the SefidRud concrete buttress dam, the approximate location of the thermometers are near the upstream and downstream surface to monitor the concrete temperature (Mirzabozorg et al. 2019).
2) distributed optical fibers for line temperature measurement inside concrete. In recent years, due to the development of the optical fiber sensing technology, optical fibers have also been adopted in concrete dams for line temperature monitoring. In the Baise Hydropower Station, the temperature-sensing optical fibers are installed at the No. 5 overflow dam monolith of the RCC main dam and the No. 6A of the highest gravity dam monolith. The snake-shaped optical fibers are embedded on the dam pouring layer (Bao et al. 2006). In the Guangzhao Hydropower Station, there are 7 optical fiber loops below EL615.50 m, and 16 optical fiber loops above EL615.50 m. In addition, two vertical optical fibers are arranged from EL560 m to the dam crest to obtain the temperature distribution along the vertical direction. Most optical fibers are buried as a straight line (Jiang and Guo 2008). The Jinghong Hydropower Station is designed to install optical fibers in the dam monoliths 12# and 17# to monitor the concrete temperature. The optical fibers are laid in a “S” shape, with a total length of 1,600 m (Shi 2008). In the Xiluodu arch dam, optical fibers are embedded in 4 dam monoliths 5#, 15#, 16# and 23#, and the total length of fibers is 13500 m. It is generally buried from the upstream or downstream surface to the middle of the concrete blocks, and straight-line layout scheme is usually adopted (Zhou et al. 2017). In the Baihetan arch dam, the optical fibers are embedded in 5 dam monoliths to acquire the concrete temperature and three types of layout schemes on the horizontal surface are applied, including “I”, “L”, and “Z” shape from upstream surface to downstream surface (Zhou et al. 2019). In the Qianping reservoir, the optical fibers are mainly used to control the temperature cracking of the intake tower. The total length of the mentioned optical fibers is about 4,000 m (Ouyang et al. 2019).
3) infrared thermal imagers for concrete surface temperature measurement. Infrared thermal imaging nondestructive testing technology is usually adopted to obtain the temperature of concrete surface. Based on the surface temperature of concrete piers measured by infrared thermal imagers at different time, Gong et al.(2012) and Chen et al.(2012) acquire the temperature distribution of the concrete structure and calculate the thermal deformation. Chen et al.(2013) obtain the temperature difference of asphalt concrete pavement between the non-manhole position and the manhole position by infrared thermal imagers to facilitate the construction compaction and quality control. Song (2016) monitors the temperature change of the concrete surface by infrared thermal imagers to determine the location and scope of the concrete defect. Zhao et al.(2014) make use of the infrared thermal imagers to monitor the temperature of LNG concrete storage tank and find the fault structure of LNG storage tank according to the thermal field change.
Although thermometers and optical fibers have been widely used in concrete dams for temperature monitoring for a long time (Pei et al. 2014), the embedding method and the quantity of thermometers or optical fibers mainly rely on empirical design. Generally, thermometers or optical fibers are embedded in the representative elevation of a typical dam monolith. Moreover, although the infrared thermal imaging nondestructive testing technology has many advantages, such as fast measurement speed, large observation area, non-contact, and high measurement accuracy (Shepard and Steven 1997), this technology has not been widely used in hydropower projects. Therefore, a reasonable design method for the number and positioning of temperature sensors in concrete dams is necessary (Huang et al. 2019). However, this problem is rarely reported in the related literatures. In this study, based on the principle of the cross-validation method, a positioning method of temperature sensors (PMTS) is developed to achieve a scientific and reasonable layout of concrete temperature sensors. Combined with the temperature data measured by the thermometers, optical fibers and infrared thermal imagers in the arch dam, the thermal field of low-heat cement concrete is obtained and analyzed. Finally, the cons and pros, and improvement of the PMTS are further discussed.
Positioning Method of Temperature Sensors (PMTS)
The Principle of the PMTS
The global thermal field of a concrete dam refers to the real temperature distribution in the entire three-dimensional (3D) space. In order to obtain the global thermal field, the temperature sensors should be embedded reasonably in the dam concrete, including the reasonable quantity and position of the sensors. Excessive temperature sensors would increase unnecessary economic costs, and add a lot of trouble during construction. Few temperature sensors cannot comprehensively monitor the temperature of the dam concrete. When the number of temperature sensors is appropriate, the global thermal field cannot be accurately obtained if the arrangement is unreasonable. Therefore, the principle of the PMTS is proposed to accurately reflect the concrete temperature and get the best economic benefits. Details are as follows:
(1) Considering the economy and technical feasibility, the number of temperature sensors should be as minimal as possible. Generally, about 2–4 thermometers are installed in each concrete block, and the distributed optical fibers are embedded in 2–3 dam monoliths of the riverbed and bank slope dam monolith. 2 to 3 infrared thermal imagers are installed to monitor the dam surface temperature.
(2) The embedded position should be reasonable, which can reflect the real concrete thermal field. When the number of sensors is limited, the position must be optimized in order to obtain a more accurate thermal field.
(3) The temperature sensors must have sufficient temperature measurement accuracy to represent the real temperature. Generally, the temperature measurement accuracy of the thermometers, distributed optical fibers and infrared thermal imagers is 0.3°C, 1°C, 1°C–2°C, respectively.
Algorithm Implementation
The positioning steps of the temperature sensors are shown in Figure 1. The specific details are as follows:
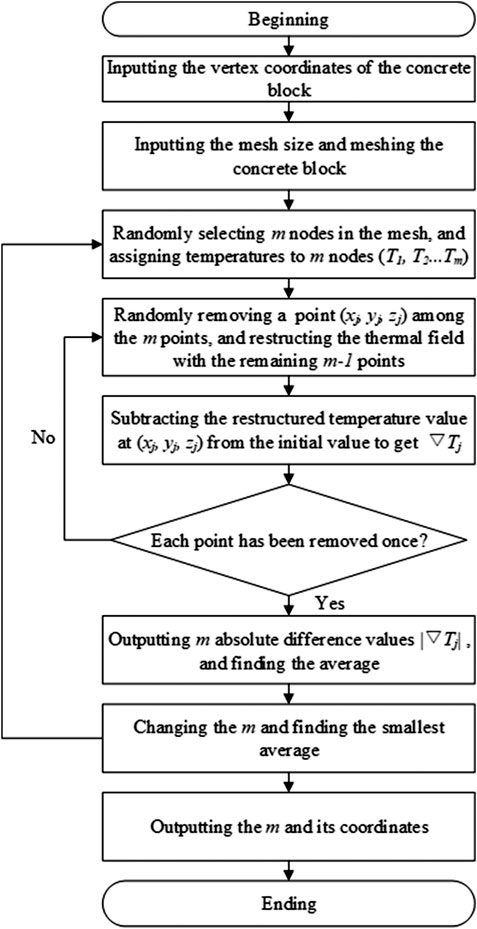
FIGURE 1. The flow chart of the PMTS.
First, assuming that the coordinates of a dam block vertex are (
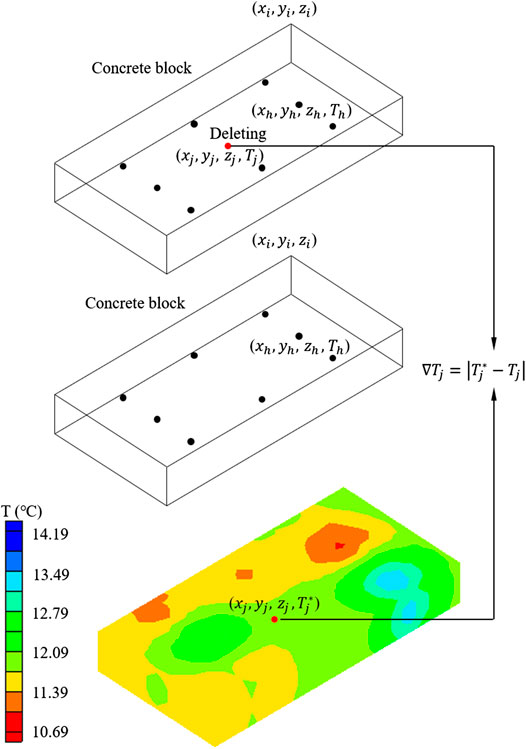
FIGURE 2. Accuracy of the thermal field judged by the cross-validation method.
The one deleted point from the initial
Next, another point is deleted from the initial temperature points, and the thermal field is restructured by the remaining temperature points. The restructured temperature value is compared with the initial temperature value of this point, and this step is repeated until all temperature points have been compared once. Finally,
The smaller
The number and the position of temperature points related to the
Calibration of the PMTS
In order to further illustrate the implementation of the PMTS, a square concrete block is selected. This block size and its mesh size are assumed to be 5 m × 5 m and 1 m × 1 m, respectively. First, the concrete block thermal field is simulated according to the thermodynamic parameters of concrete (Figure 3). In this case, the concrete thermal conductivity is
where
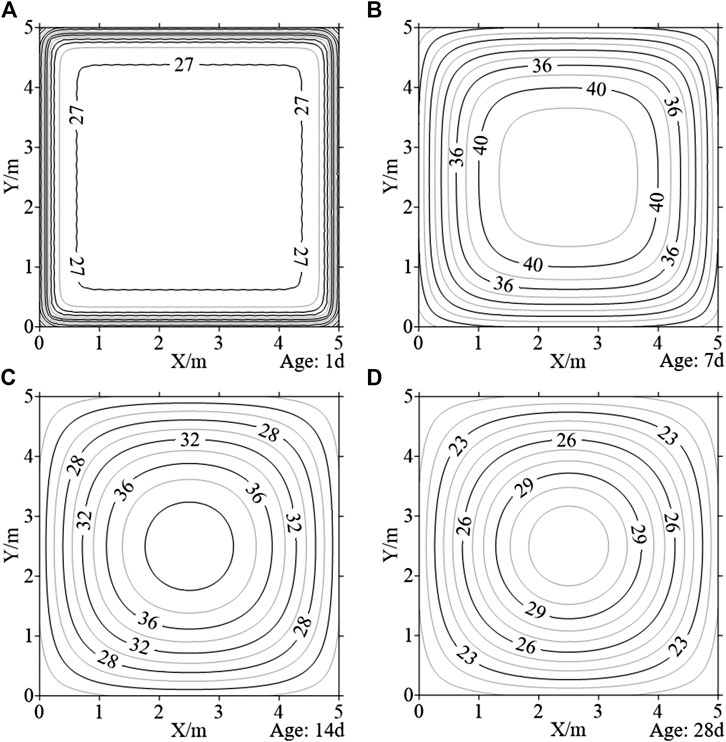
FIGURE 3. The simulated thermal field of the concrete block: (A) 1 day; (B) 7 days; (C) 14 days; (D) 28 days.
The simulated thermal field of the concrete is selected as the initial temperature. Assuming the temperature measurement points m = 10, the final optimized position of temperature points is obtained based on the positioning optimization algorithm in Algorithm Implementation. According to the position and temperature of the measurement points, the thermal field is restructured at the age of 1, 7, 14, and 28 days, respectively (Figure 4). By comparing the restructured thermal field and initial temperature, it can be found that the thermal field distribution law is the same as the simulated field. It is illustrated that with a certain number of the temperature measuring points, the restructured thermal field can reflect the actual concrete temperature distribution based on the PMTS by optimizing the position.
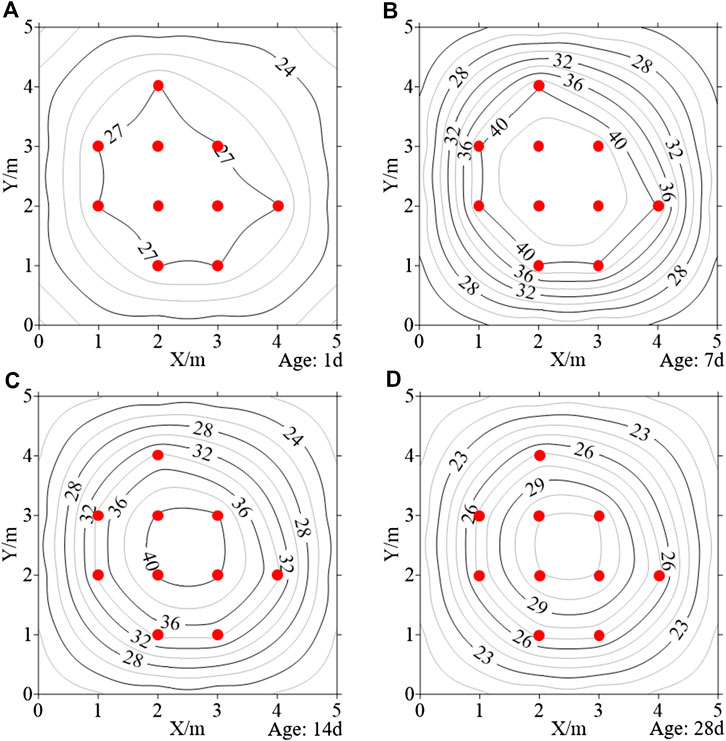
FIGURE 4. The restructured thermal field of the concrete block based on m = 10: (A) 1 day; (B) 7 days; (C) 14 days; (D) 28 days (the red points represent temperature sensors).
Comparing different temperature measurement points m = 3, 5, 7 and 10, it can be seen that the more temperature monitoring points are arranged, the closer the restructured thermal field is to the initial thermal field (Figure 5). However, the number of temperature measurement points should be reasonable and appropriate considering the economic costs and construction interference in actual projects. Therefore, it is particularly important to optimize the position of temperature measurement points. In addition, the construction conditions of the concrete dam are complex, and the temperature sensors are greatly affected by the external factors, such as the influence of the cooling water pipe. In order to avoid the influence of cooling water on the temperature, the temperature sensors are usually as far away as possible from the water pipes. Hence, the layout of temperature monitoring sensors is more complicated in the engineering.
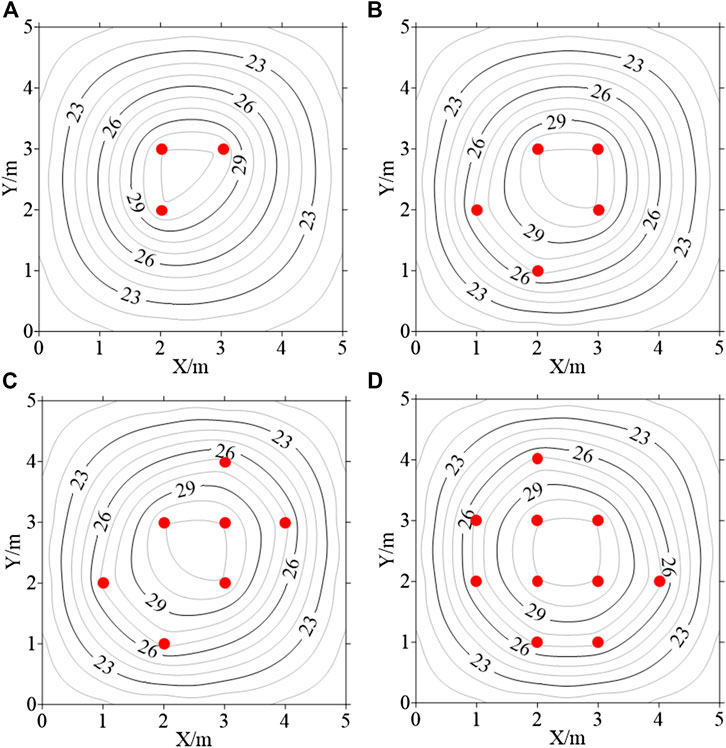
FIGURE 5. The restructured thermal field of the concrete block: (A)m = 3; (B)m = 5; (C)m = 7; (D)m = 10 (the red points represent temperature sensors).
Engineering Application in a Super-High Arch Dam
A super-high arch dam studied in this paper is a double-curved concrete dam with a height of 270 m and a thickness-height ratio of 0.19 (Figure 6), which is the thinnest 300 m level arch dam in the world. The dam crest elevation is 988 m, and the dam concrete volume is 27 million m3. The whole dam is constructed by low-heat cement concrete, which is the first time in the dam construction history. The dam is located at dry and hot valley. The climate is hot and rainy in summer, dry and windy in winter, and large temperature difference about 14°C during day and night. Hence, it is very difficult to control the arch dam concrete temperature.
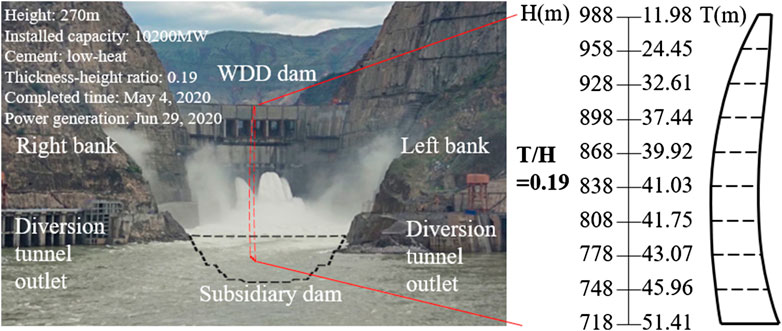
FIGURE 6. General view of the super-high arch dam.
Necessity and Challenges of Temperature Monitoring
(1) The thinnest 300 m level arch dam
The thinner the arch dam, the more sensitive it is to air and water temperature, and the greater the temperature change in the dam concrete. For the temperature load, the early calculation is mainly based on the US Bureau of Reclamation's empirical formula (Creager et al., 1945), which is shown in Eq. (5):
where
In 1970s, the dam temperature
Since the
Except the free boundary at the dam crest, the other three boundaries of the arch dam are constrained by the bedrock, and the temperature deformation is constrained greatly. Therefore, the greater the temperature change of the dam, the greater the thermal stress. As the world's thinnest 300 m level super-high arch dam, the temperature control is particularly significant. Reliable and accurate temperature monitoring is a prerequisite to ensure effective temperature control of the dam concrete.
(2) The whole dam constructed by low-heat cement concrete for the first time
(3) The whole dam constructed by low-heat cement concrete for the first time
Low-heat cement has the characteristics of slow hydration rate, low hydration heat, high strength in the later period and great durability (Wang et al. 2018). It can effectively improve the crack resistance ability of hydraulic mass concrete and reduce the risk of concrete cracking. The super-high arch dam uses low-heat cement for the construction of the entire dam, which has no precedent in arch dam construction history. The engineering level of this dam is high. The quality of low-heat cement and the construction method are all different from other dams. In addition, the law of low-heat cement hydration and concrete temperature distribution are unclear. In order to obtain the temperature change law of the arch dam concrete, thermometers are embedded in all concrete blocks and the distributed optical fibers are buried in dam monoliths 7# and 12#. Moreover, the infrared thermal imagers are installed on the upstream surface and the right bank abutment platform for temperature monitoring. On this basis, the dam concrete temperature control measures can be optimized and adjusted.
Layout of Temperature Sensors
Based on the optimization principle of the PMTS, the real 3D spatial thermal field of the super-high arch dam studied in this paper is realized by thermometers, distributed optical fibers and infrared thermal imagers.
1) the position of thermometers
In the arch dam, thermometers are embedded in each concrete block to monitor the concrete temperature. The number and position of thermometers buried in the dam concrete during construction are as follows:
When the elevation of concrete blocks is below EL910 m, 3 and 4 thermometers are embedded in the 3 m and 4.5 m pouring blocks, respectively. When the thickness of concrete blocks is 3 m, thermometers should be arranged in each of the upstream, middle and downstream areas (about 1/4 length of the concrete blocks along the water flow direction) between the two layers of cooling water pipes (Figures 7A,B). When the thickness of concrete blocks is 4.5 m, thermometers should be arranged in each of the upstream, middle and downstream areas between the first and second layers of cooling water pipes. There is also a thermometer embedded in the middle area between the second and third layers of cooling water pipes (Figures 7C,D).
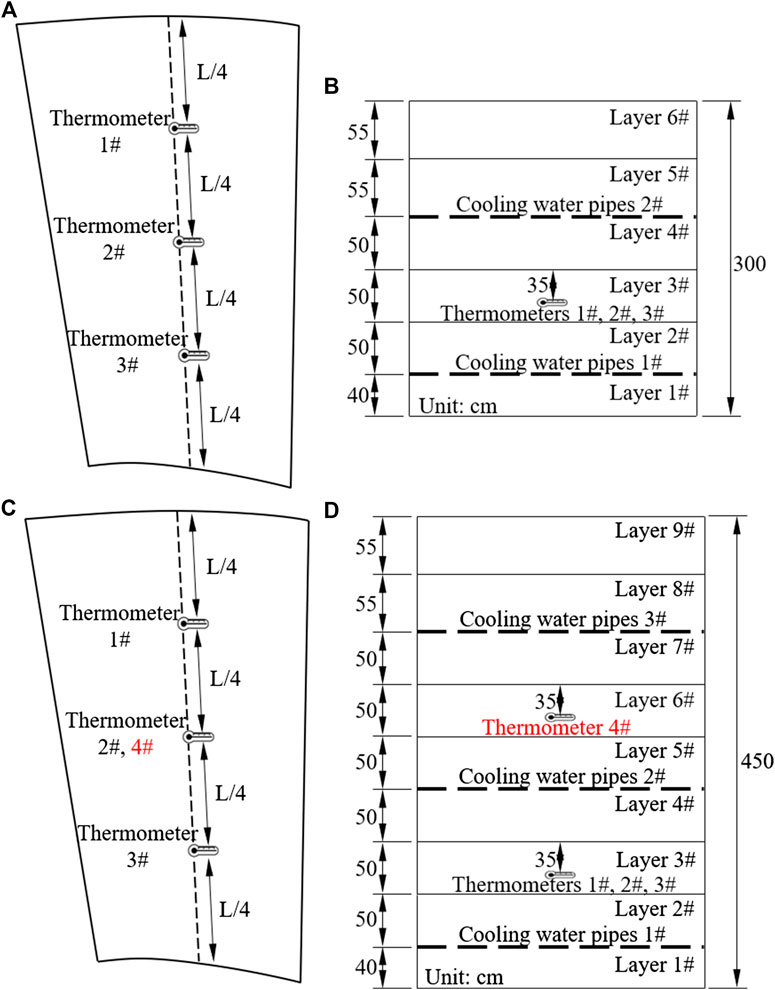
FIGURE 7. Position of thermometers in concrete blocks below EL910m: (A) in horizontal direction (3 m); (B) in vertical direction (3 m); (C) in horizontal direction (4.5 m); (D) in vertical direction (4.5 m).
When the elevation of concrete blocks is above EL910 m, 2 and 3 thermometers are embedded in the 3 m and 4.5 m pouring blocks, respectively. When the thickness of concrete blocks is 3 m, thermometers should be arranged in each of the upstream and downstream areas (about 1/3 length of the concrete blocks along the water flow direction) between the two layers of cooling water pipes (Figures 8A,B). When the thickness of concrete blocks is 4.5 m, thermometers should be arranged in each of the upstream, and downstream areas between the first and second layers of cooling water pipes. There is also a thermometer embedded in the middle area between the second and third layers of cooling water pipes (Figures 8C,D).
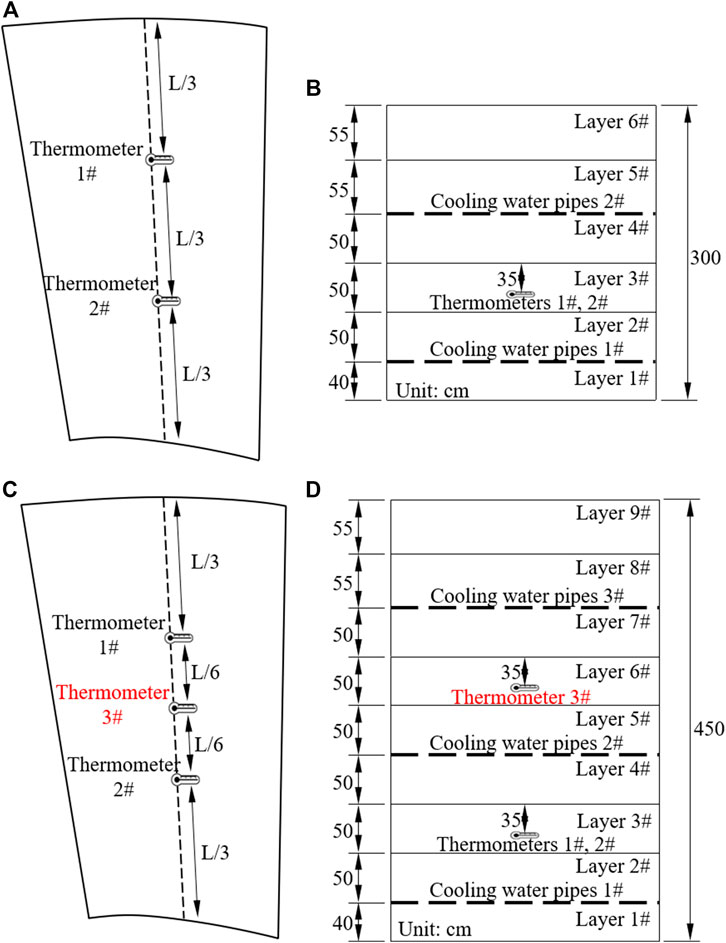
FIGURE 8. Position of thermometers in concrete blocks above EL910m: (A) in horizontal direction (3 m); (B) in vertical direction (3 m); (C) in horizontal direction (4.5 m); (D) in vertical direction (4.5 m).
2) the layout of distributed optical fibers
The concrete blocks of the arch dam have two shapes. One is a quadrilateral block, mainly located at the riverbed dam monoliths and the high elevation of bank slope dam monoliths. The other is a triangular block, mainly located at the low elevation of the bank slope dam monoliths.
For quadrilateral concrete blocks, optical fibers are arranged as a "Z" shape and embedded in the same layer with the thermometers. Taking the dam monolith 7# of the arch dam as an example, Z-shaped optical fibers are embedded in two forms (Figure 9A), the first of which (①-①) is as follows: the embedded starting point is 1 m and 3 m away from the upstream surface and the transverse joint 6#, respectively. Then, the optical fibers are buried along the water flow direction and turned at the thermometer in the middle of the concrete block. Next, the optical fibers are embedded along the direction transverse to the water flow direction until they are 3 m away from the transverse joint 7#. Finally, the optical fibers are embedded along the water flow direction again and end at the point 1 m away from the downstream surface. The second (②-②) and the first embedded forms are symmetric about the center line of the concrete block. When the two embedded forms alternate along the vertical direction, the optical fibers can be coupled with each other to obtain a more accurate and real thermal field.
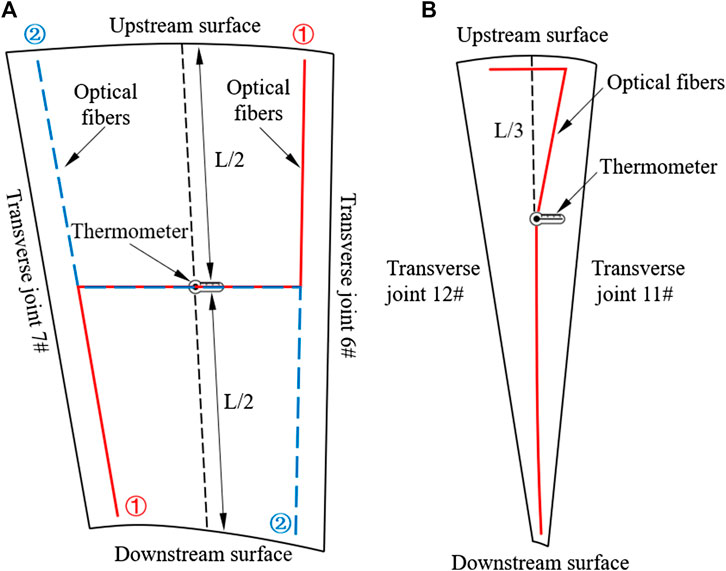
FIGURE 9. Layout scheme of distributed optical fibers: (A) in quadrilateral concrete blocks; (B) in triangular concrete blocks.
For the triangular concrete blocks, due to the short length along the direction transverse to the water flow direction, the optical fibers are embedded as a "7" shape. Taking the dam monolith 12# of the arch dam as an example, the embedded starting point of optical fibers is 1 m and 3 m away from the upstream surface and the transverse joint 12#, respectively. Then, the optical fibers are buried along the direction transverse to the water flow direction, turned to the thermometer in the upstream area of the concrete block. Finally, the optical fibers are embedded along the center line of the concrete block and end at the point 1 m away from the downstream surface (Figure 9B).
3) the layout of infrared thermal imagers
The infrared thermal imaging nondestructive testing technology is an indirect temperature measurement and has great advantages, which can overcome the complex environmental influence, e.g. strong wind, fog, high temperature, etc. Moreover, the longest monitoring distance can be up to approximately 300 m, and the temperature accuracy can reach 1°C–2°C. According to the infrared thermal radiation characteristics of the object, an infrared thermal imager is used to receive the thermal radiation of the concrete surface. Considering the monitoring range of the infrared thermal imager, two infrared thermal imagers are installed on the upstream surface and the right bank abutment platform to monitor the surface temperature of the studied super-high arch dam, respectively. The thermometers, optical fibers and infrared thermal imagers installed in the studied super-high arch dam are shown in Figure 10.
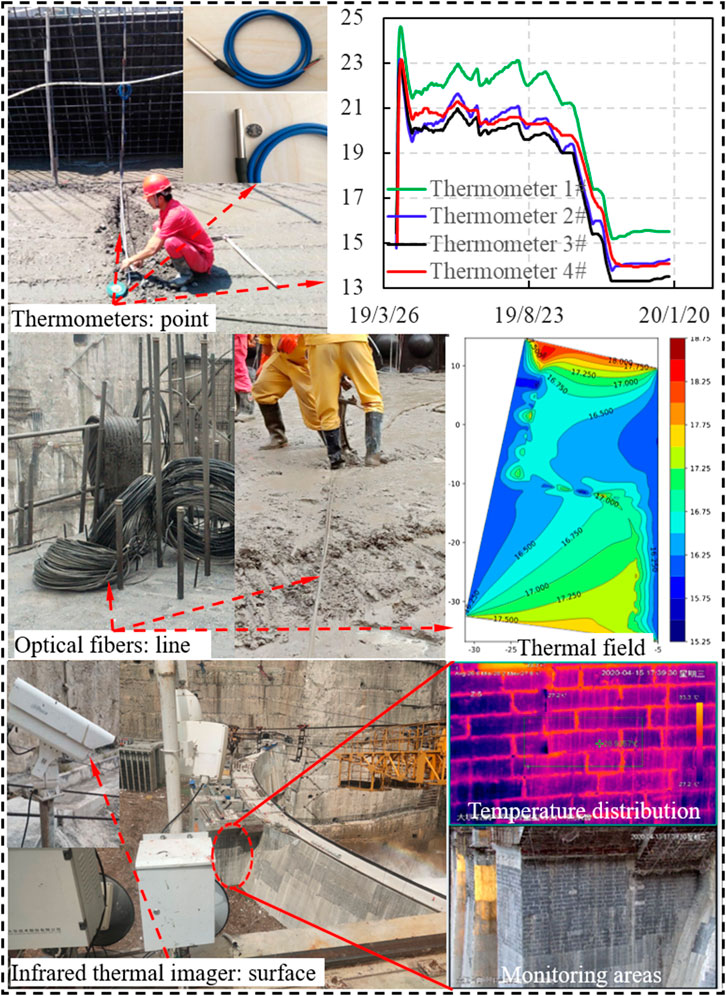
FIGURE 10. Layout of thermometers, distributed optical fibers and infrared thermal imagers in the super-high arch dam.
Global Thermal Field Realization
According to the temperature measured by thermometers, distributed optical fibers and infrared thermal imagers, the real 3D spatial thermal field is obtained. Illustrated by the example of concrete blocks 12#-0033, 0034, 0035, 0036 (Figure 11), the concrete thermal field is restructured on May 1, Aug 1, Nov 1, 2019 and Jan 1, 2020. The restructured 3D thermal fields of different time are shown in Figures 12,13.
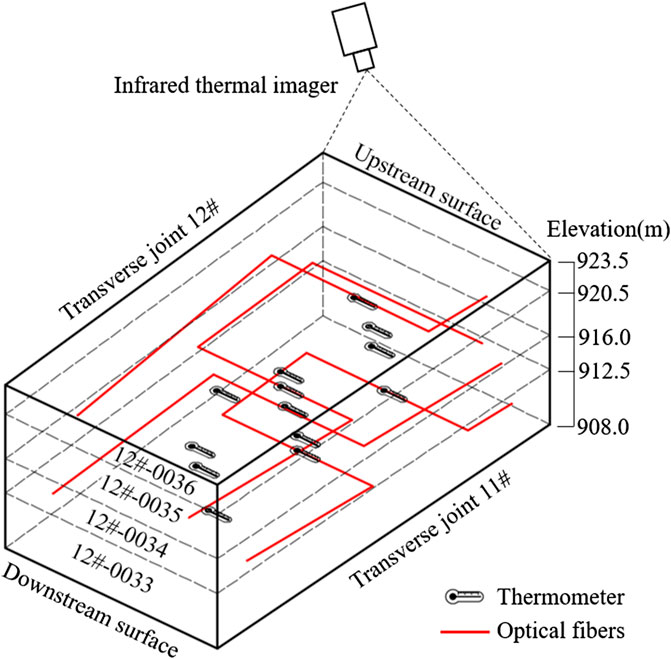
FIGURE 11. The arrangement of thermometers, distributed optical fibers and infrared thermal imagers in the concrete blocks 12#-0033, 0034, 0035, 0036.
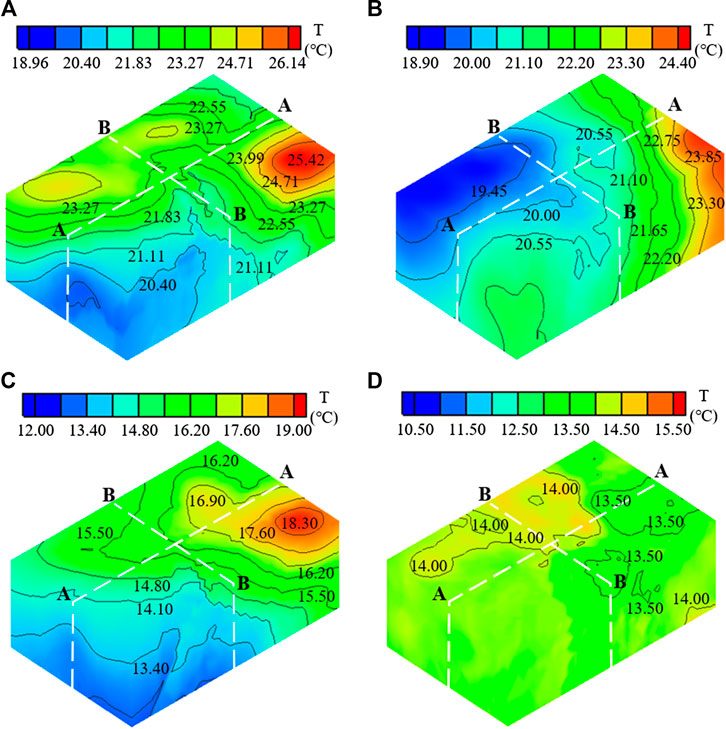
FIGURE 12. The 3D thermal field in the concrete blocks 12#-0033, 0034, 0035 and 0036: (A) May 1, 2019; (B) Aug 1, 2019; (C) Nov 1, 2019; (D) Jan 1, 2020.
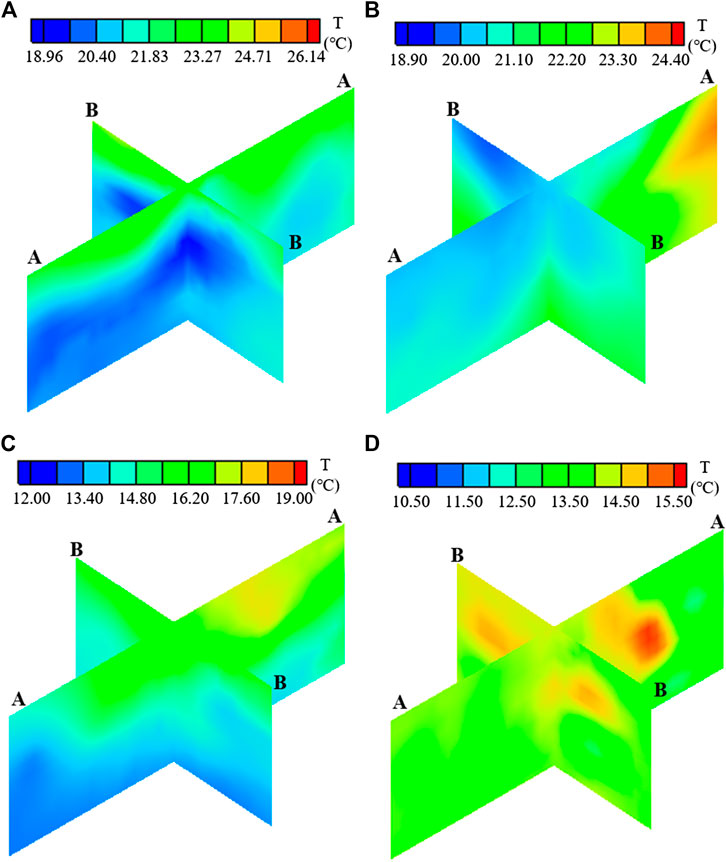
FIGURE 13. The thermal field in section A-A and B-B in the concrete blocks 12#-0033, 0034, 0035 and 0036: (A) May 1, 2019; (B) Aug 1, 2019; (C) Nov 1, 2019; (D) Jan 1, 2020.
As can be seen from Figures 12A,13A, on May 1, 2019, the temperature of concrete blocks at the high elevation is higher than that of the concrete blocks at the low elevation. The main reasons are the late pouring time of the high elevation concrete blocks, the great cement hydration heat and the less heat exchange between cooling water and concrete. The concrete temperature of the downstream area is lower than that of the upstream area along the water flow direction. The higher the concrete blocks elevation, the greater the temperature difference between the upstream and downstream area. The temperature difference of the high elevation concrete blocks is about 3°C, whereas the temperature difference of the low elevation concrete blocks is less than 1.5°C.
According to the Figures 12B,13B, with the increase of concrete age, the concrete temperature decreases due to water cooling and heat dissipation. On Aug 1, 2019, the maximum temperature of concrete blocks 12#-0033, 0034, 0035, 0036 dropped by about 1.6°C compared with that on May 1, 2019. The concrete temperature of the downstream area is lower than that of the upstream area along the water flow direction. For instance, the temperature difference between the upstream and downstream area of the concrete block 12-0036 is about 4.4°C.
t can be seen from Figures 12C,13C that the maximum concrete temperature on Nov 1, 2019 decreased by about 5.4°C compared with that on Aug 1, 2019. The main reason is that the concrete blocks 12#-0033, 0034, 0035, 0036 are in the initial temperature control stage and the concrete temperature should be controlled at about 22°C–24°C on Aug 1, 2019. However, the concrete blocks 12#-0035, 0036 are in the intermediate temperature control stage and the concrete temperature should be controlled at about 18°C–20°C on Nov 1, 2019. The concrete blocks 12#-0033, 0034 are in the late temperature control stage and the concrete temperature should be controlled at 14°C on Nov 1, 2019. Hence, the temperature decrease is large during this period.
As shown in Figures 12D,13D, the maximum concrete temperature on Jan 1, 2020 decreased by about 3.5°C compared with that on Nov 1, 2019. The 3D concrete thermal field tends to be uniform, and most of the temperature is approximately 13.5°C–14°C. According to the design standard of the studied super-high arch dam, the concrete blocks 12#-0033, 0034, 0035, 0036 should be in the late temperature control stage on Jan 1, 2020. In order to satisfy the requirement of transverse joints grouting, the temperature should be controlled at about 14°C. It can be seen that the space-time distribution law of the restructured thermal field is consistent with the actual situation of the super-high arch dam.
Discussion
Compared with the method of determining the position of temperature sensors empirically, the PMTS proposed in this study, which can obtain the thermal field of concrete dams more efficiently and provide method support for the arrangement of temperature sensors, is more reasonable and reliable. However, the PMTS may be affected by the complex construction and economic conditions in engineering application. When the thermometers, optical fibers and infrared thermal imagers are arranged mutually, the construction interference is usually large, which reduces the survival rate of the sensors. Moreover, concrete is a relatively complex material and multiple temperature control measures may be applied simultaneously during construction, which result in a particularly complex temperature change and bring great challenges to temperature monitoring.
Under such complex conditions, the PMTS proposed in this paper has been successfully applied to the construction of a super-high arch dam, which provides a basis for the temperature control measures. Up to now, the studied super-high arch dam has not produced a single temperature crack during construction and impounding period. In the PMTS method, the natural neighbor interpolation algorithm and cross-validation are used in this study to restructure the thermal field and verify the accuracy of the restructured thermal field, respectively. However, there are many methods for restructuring and verifying the thermal field. For instance, the restructuring methods of the thermal field include kriging and inverse distance weighting interpolation algorithm. The verification methods can utilize average error or root mean square error methods. Therefore, two key points of the PMTS will be further studied in future research, that is the thermal field restructuring method and the accuracy verification method of restructured thermal field, in order to facilitate the wide engineering application of the PMTS.
Conclusions
A positioning method of temperature sensors is developed to determine the arrangement of temperature sensors in concrete dams scientifically and quantitatively. The proposed method is then applied to the arrangement of thermometers, distributed optical fibers and infrared thermal imagers in a super-high arch dam for real-time measurement of concrete temperature. According to this study, several conclusions are as follows:
(1) The proposed PMTS based on the natural neighbor interpolation algorithm and the cross-validation is reasonable and reliable, which is illustrated by the accurate acquisition of the super-high arch dam thermal field based on point, line, surface temperature measurement.
(2) The temperature change of the studied super-high arch dam is consistent with the design temperature control process, which indicates that the dam has achieved precise control of concrete temperature.
(3) The PMTS may be affected by the complex engineering site. Therefore, future studies will focus on the application of the PMTS considering construction interference and the integration of the advantages of other thermal field restructuring methods and the accuracy verification methods.
Data Availability Statement
The original contributions presented in the study are included in the article, further inquiries can be directed to the corresponding author.
Author Contributions
HP: methodology, and writing original draft. PL, and YX: supervision and writing original draft. WC: algorithm implementation. SZ, NY, and YQ: review and editing. All authors contributed to the final version of the manuscript.
Conflict of Interest
Authors SZ, NY, and YQ are employed by the company China Three Gorges Corporation.The remaining authors declare that the research was conducted in the absence of any commercial or financial relationships that could be construed as a potential conflict of interest.
Funding
This research work was supported by the National Natural Science Foundation of China (Grant No: 51979146), and the China Three Gorges Corporation Research Program (WDD/0490, BHT/0805).
References
Bao, H., Cai, D., Tang, T., and Xu, S. (2006). Design of optical fiber senor network for temperature monitoring and research on its embedded technology in the RCC dam. Water Power 32 (2), 26–29. doi:10.3969/j.issn.0559-9342.2006.02.009
Belmokre, A., Mihoubi, M. K., and Santillán, D. (2019). Analysis of dam behavior by statistical models: application of the random forest approach. KSCE J. Civ. Eng 23 (2), 4800–4811. doi:10.1007/s12205-019-0339-0
Chen, B., Li, X. J., Pan, H. M., and Zheng, J. (2012). Solar radiation-induced temperature variation of concrete bridge piers. Appl. Mech. Mater., 178–181, 2451–2455. doi:10.4028/www.scientific.net/AMM.178-181.2451
Chen, L. Y., Wang, M. Y., Lin, D. F., and Trsi, S. R. (2013). Assessing the quality of asphalt concrete pavement at special location with infrared thermal imager. Adv. Mater. Res. 723, 35–40. doi:10.4028/www.scientific.net/AMR
Creager, W. P., Justin, J. D., and Hinds, J. (1945). Engineering for dams. New York, NY: John Wiley & Sons, Inc., 425–558.
Fan, Q., Li, W., Li, X., Chen, G., and Yang, H. (2016). Application of low heat Portland cement concrete in Hoover Dam and its revelation. Water Power 42 (12), 46–49+59. doi:10.3969/j.issn.0559-9342.2016.12.012
Gong, P. S., Chen, B., Song, C. F., and Li, X. L. (2012). Assessment on the thermal stresses of concrete bridge piers under solar radiation. Appl. Mech. Mater. 204–208, 2045–2050. doi:10.4028/www.scientific.net/AMM.204-208.2045
Huang, Y., Xie, T., Li, C., and Yin, X. (2019). Optimization analysis of the position of thermometers buried in concrete pouring block embedded with cooling pipes. Math. Probl. Eng. 2019, 1–13. doi:10.1155/2019/5256839
Jaafar, M. S., Bayagoob, K. H., Noorzaei, J., and Thanoon, W. A. M. (2007). Development of finite element computer code for thermal analysis of roller compacted concrete dams. Adv. Eng. Softw. 38 (11–12), 886–895. doi:10.1016/j.advengsoft.2006.08.040
Jiang, J., and Guo, F. (2008). Application discussion on distributed optical fiber temperature measurement in Guangzhao RCC dam. Water Power 34 (3), 55–58. doi:10.3969/j.issn.0559-9342.2008.03.017
Lin, P., Guan, J., Peng, H., and Shi, J. (2019). Horizontal cracking and crack repair analysis of a super high arch dam based on fracture toughness. Eng. Fail. Anal. 97, 72–90. doi:10.1016/j.engfailanal.2019.01.036
Lin, P., Li, Q., and Hu, H. (2012). A flexible network structure for temperature monitoring of a super high arch dam. Int. J. Distributed Sens. Netw. 2012 (4), 1238–1241. doi:10.1155/2012/917849
Lin, P., Li, Q., and Jia, P. (2014). A real-time temperature data transmission approach for intelligent cooling control of mass concrete. Math. Probl. Eng. 2014, 1–10. doi:10.1155/2014/514606
Lin, P., Wei, P., Wang, W., and Huang, H. (2018). Cracking risk and overall stability analysis of xulong high arch dam: a case study. Appl. Sci. 8 (12), 2555. doi:10.3390/app8122555
Lin, P., Zhou, W., and Liu, H. (2015). Experimental study on cracking, reinforcement, and overall stability of the xiaowan super-high arch dam. Rock Mech. Rock Eng. 48 (2), 819–841. doi:10.1007/s00603-014-0593-x
Mata, J., de Castro, A. T., and Costa, J. S. D. (2014). Constructing statistical models for arch dam deformation. Struct. Control Hlth. 21 (3), 1–15. doi:10.1002/stc.1575
Mirzabozorg, H., Ghaemian, M., and Roohezamin, A. (2019). The reason of cracking in bottom gallery of SefidRud Buttress Dam and earthquake and post earthquake performance. Structural Monitoring and Maintenance 6 (2), 103–124. doi:10.12989/smm.2019.6.2.103
Ouyang, J., Chen, X., Huangfu, Z., Lu, C., Huang, D., and Li, Y. (2019). Application of distributed temperature sensing for cracking control of mass concrete. Constr. Build. Mater. 197, 778–791. doi:10.1016/j.conbuildmat.2018.11.221
Pei, H. F., Teng, J., Yin, J. H., and Chen, R. (2014). A review of previous studies on the applications of optical fiber sensors in geotechnical health monitoring. Measurement 58 (3), 207–214. doi:10.1016/j.measurement.2014.08.013
Peng, H., Lin, P., Yang, N., Li, M., and Qiao, Y. (2019). Real time thermal field analysis on Wudongde super high arch dam during construction. Global Energy Interconnection 2 (3), 264–269. doi:10.1016/j.gloei.2019.07.019
Santillán, D., Salete, E., Vicente, D. J., and Toledo, M. Á. (2014). Treatment of solar radiation by spatial and temporal discretization for modeling the thermal response of arch dams. J. Eng. Mech. 140 (11), 05014001. doi:10.1061/(ASCE)EM.1943-7889.0000801
Santillan, D., Saleteb, E., Toledob, M. A., and Granados, A. (2015). An improved 1D-model for computing the thermal behaviour of concrete dams during operation. Comparison with other approaches. Comput. Concrete 15 (1), 103–126. doi:10.12989/cac.2015.15.1.103
Schackow, A., Effting, C., Gomes, I. R., Patruni, I. Z., Vicenzi, F., and Kramel, C. (2016). Temperature variation in concrete samples due to cement hydration. Appl. Therm. Eng. 103, 1362–1369. doi:10.1016/j.applthermaleng.2016.05.048
Shepard, , , and Steven, M. (1997). Introduction to active thermography for non-destructive evaluation. Anti-Corros. Method. M. 44 (4), 236–239. doi:10.1108/00035599710183199
Shi, L. (2008). Application of temperature measurement technology with optical fiber in jinghong hydropower project. Water Power 34 (4), 65–67. doi:10.3969/j.issn.0559-9342.2008.04.021
Song, F. (2016). Experimental study on the quality of concrete strengthened by the means of infrared thermal imager. Am. J. Civ. Eng. 4 (2), 55. doi:10.11648/j.ajce.20160402.13
Wang, L., Yang, H. Q., Zhou, S. H., Chen, E., and Tang, S. W. (2018). Mechanical properties, long-term hydration heat, shinkage behavior and crack resistance of dam concrete designed with low heat Portland (LHP) cement and fly ash. Constr. Build. Mater. 187, 1073–1091. doi:10.1016/j.conbuildmat.2018.08.056
Zhao, L., Zhang, G. W., Zhang, Q., and Zhang, Y. K. (2014). Multi-point temperature monitoring system for the LNG storage tank. Appl. Mech. Mater. 511–512, 282–285. doi:10.4028/www.scientific.net/AMM.511-512.282
Zhou, H., Pan, Z., Liang, Z., Zhao, C., Zhou, Y., and Wang, F. (2019). Temperature field reconstruction of concrete dams based on distributed optical fiber monitoring data. KSCE J. Civ. Eng. 23 (5), 1911–1922. doi:10.1007/s12205-019-0787-6
Zhou, H., Zhou, Y., Zhao, C., Fang, W., and Liang, Z. (2017). Feedback design of temperature control measures for concrete dams based on real-time temperature monitoring and construction process simulation. KSCE J. Civ. Eng. 22 (6), 1584–1592. doi:10.1007/s12205-017-1935-5
Keywords: positioning method of temperature sensors, global thermal field, cross-validation, restructured thermal field, concrete dam
Citation: Peng H, Lin P, Xiang Y, Chen W, Zhou S, Yang N and Qiao Y (2020) A Positioning Method of Temperature Sensors for Monitoring Dam Global Thermal Field. Front. Mater. 7:587738. doi: 10.3389/fmats.2020.587738
Received: 27 July 2020; Accepted: 24 November 2020;
Published: 22 December 2020.
Edited by:
Juncai Xu, Case Western Reserve University, United StatesReviewed by:
Junfeng Guan, North China University of Water Conservancy and Electric Power, ChinaHongyuan Liu, University of Tasmania, Australia
Copyright © 2020 Peng, Lin, Xiang, Chen, Zhou, Yang and Qiao. This is an open-access article distributed under the terms of the Creative Commons Attribution License (CC BY). The use, distribution or reproduction in other forums is permitted, provided the original author(s) and the copyright owner(s) are credited and that the original publication in this journal is cited, in accordance with accepted academic practice. No use, distribution or reproduction is permitted which does not comply with these terms.
*Correspondence: Peng Lin, Y2VsaW5wZUB0c2luZ2h1YS5lZHUuY24=