 Zhuoliang Li
 Hua Ding
 Yu Chen
 Jizhong Li4
- 1School of Material Science and Engineering, Northeastern University, Shenyang, China
- 2Key Laboratory of Lightweight Structural Materials, Northeastern University, Shenyang, China
- 3School of Mechanical Engineering and Automation, Northeastern University, Shenyang, China
- 4FSW Welding Technology (Shanghai) Co., LTD, Shanghai, China
In this study, the stain accumulation during friction stir welding of pure Mg was predicted and verified at different rotation speeds, together with the detailed microstructural evolution. The results indicate that the strain accumulation can be divided into three stages: 1) acceleration flow, 2) high velocity flow, and (III) decelerate and constant velocity flow. The rate of strain accumulation was relatively low at both stage I and stage III, while it became extremely high at stage III. The higher the speed of rotation, the severe plastic deformation more easily occurred within the material. The accumulated strain of pure Mg were determined to be approximately 12.8 and 14.5 at the rotation speed of 1,000 and 1,500 rpm, respectively. Relatively believable equations were established by calculation and derivation. In addition, the microstructural evolution shows that that the friction stir welding processed pure Mg first experienced significant grain refinement during plastic deformation but led to an obvious grain growth at the later stage due to the heat effect by high temperature field.
Introduction
As one of structural metallic materials with the lowest density in engineering applications, magnesium (Mg) and its alloys have the following advantages such as high specific strength and high specific stiffness, high damping and electromagnetic shielding performance, and the excellent properties of casting and machining (Mordike and Ebert, 2001). Mg alloys have broad application prospects in automotive, electronics, aerospace and many other fields. However, low melting point, high thermal conductivity rate, and poor antioxidant capacity seriously influence the formability and welding performance of Mg and its alloys, thus restricting its further development and application (Avedesian and Baker, 1999).
As to the traditional welding processes, the welding performance of pure Mg material is poor. Mg materials are easily oxidized during welding processes, and MgO film with high melting point (∼2,500°C) can be formed on the surface of the material. The MgO film covers the molten pool and groove, which seriously affects the welding formation process. MgO inclusions formed during the welding process also make effects on the plasticity of the weld metal. In addition, the high thermal conductivity rate always results in the widening of heat affected zone, overheating and the microstructural coarsening. Thus, the mechanical properties of the welded joint become unsatisfactory. In recent years, much attention has been paid on friction stir welding (FSW) technology. As a new type of solid connection technology, cracks and inclusions caused by the melting welding can be effectively avoided by means of FSW technology (Chen et al., 2016a). Meanwhile, as one of the severe plastic deformation (SPD) technologies, FSW process can also result in the fine microstructure with excellent mechanical properties (Nikulin et al., 2012; Zhou et al., 2020).
According to the study of Yang et al. (2013), fine-grained Mg-10Gr-3Y-0.5Zr alloy was prepared by FSW. The alloy was subjected to superplastic deformation in the temperature range of 400–425°C, and a maximum tensile ductility of 1,110% was achieved. Yang et al. (2010) studied the effect of different shoulder dimensions on the FSWed Mg-3Al-Zn plates at a traverse speed of 100 mm/min and a rotation rate of 800 rpm. The results showed that as the shoulder diameter increased, the tensile strength of the welds tended to increase and the total elongation to fracture was significantly improved. Dissimilar FSW of ZK60 and AZ31 magnesium alloys was studied by Liu et al. (2013). The results showed that the dissimilar plates were joined successfully and no obvious defects were observed. Nevertheless, most studies merely focus on the forming ability of the FSWed Mg and its alloys and/or the corresponding microstructures and mechanical properties (Commin et al., 2012; Yang et al., 2011; Ahmadkhaniha et al., 2016). Studies on the variation of strain and/or strain rate of pure Mg during FSW processes are still limited. As one of the most important parameters of SPD process, the accumulated strain in the material can always directly affect the efficiency of the deformation process and the mechanical properties of the material, which can provide important reference to optimizing the processing parameters and the resultant mechanical properties of the materials (Pougis et al., 2012; Chen et al., 2018). Compared with equal channel angular pressing (Valiev and Langdon, 2006) and high pressure torsion (Zhilyaev and Langdon, 2008), the accumulated strain during FSW of pure Mg has not been yet determined until now (Liu et al., 2014; Liu et al., 2015a).
Some researchers attempted to acquire the strain and the metal flow state by numerical simulation. For instance, a new smooth particle hydrodynamics model for FSW technology was proposed by Pan et al. (2013). The flow behavior and the microstructure-mechanical properties relationship were analyzed during FSW of AZ31 Mg alloy. However, the value of strain and strain rate were not obtained according to their work. Dialami et al. (2018) established a kinematic framework for simulating the local flow during FSW, based on the Zener-Hollomon parameter and Hall-Petch relationship. The relationship among the average grain size, strain rate and temperature was studied. Nevertheless, it was still difficult to measure the temperature field of the actual FSW, considering multiple factors such as the geometry size of the probe and the cooling mechanisms, etc. Thus, the calculated strain was not consistent with the practical microstructural evolution. A computational fluid dynamics based- 3D thermo-mechanical model built by Albakri et al. (2013) was used to study the effect of FSW parameters on temperature field, material flow and strain rate of AZ31 Mg alloy. The results showed that the average stain rate was greatly affected by the rotational speed of the probe and traverse speed had seldom effect on the stain rate. Unfortunately, strong evidence was lacked in this research to verify the obtained strain rate values. Although simple numerical simulation method was proposed, it is still quite difficult to consider the effect of multiple factors, which may lead to the difference between the simulatedand measured results.
Recently, studies have been done to develop experimental methods to evaluate the strain and strain rate during FSW. Kumar et al. (2018) used an experimental simulation method to approximate the strain rate during FSW. Micro-spherical glass tracers in a transparent viscoplastic material together with particle image velocimetry technique were used. Morisada et al. (2015) established a three-dimensional visualization experiment to determine the strain rate of pure Al during FSW. Nevertheless, the strain could not be obtained directly but reversely derived from the strain rate. Liu et al. (2019a; 2019b) developed an experimental method by inserting the marker to approximately determine the strain and strain rate during FSW process of pure copper. However, the detailed microstructural evolution was not involved in this study. In the present study, Liu’s method was used for reference and pure Mg was selected to study the stain accumulation during FSW. Computational formula of stain accumulation was established according to the deformation process of the marker. Furthermore, the computational formula was derived so that its practicability was greatly improved. The stain accumulation of Mg material could be obtained directly by using the parameters of FSW process. In the present study, the microstructural evolution of the material was explored simultaneously. And the relationship between microstructural evolution and strain accumulation was obtained. This work can provide an important reference for the exploring the FSW parameters and tailoring the microstructures.
Materials and Methods
The 5 mm-thick pure Mg plates were selected, and the initialmicrostructure was shown in Figure 1. It can be seen that the microstructure of the base metal is consisted of coarse and equiaxed grains with an average grain size of about 40 μm. The fraction of low angle grain boundary (LAGB) is only 4.9%.
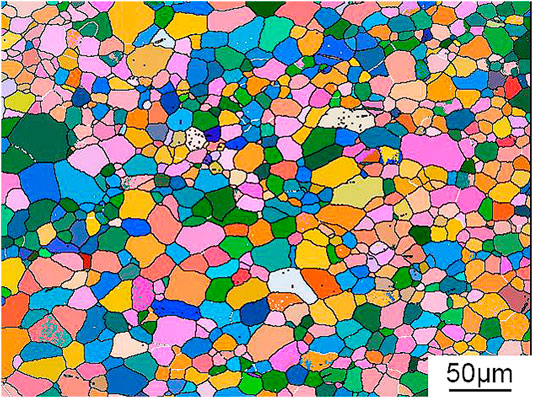
FIGURE 1. The initial microstructure of the base metal.
As shown in Figure 2A, a thin foil of pure Cu was pre-set into the abutting surface of the two workpieces as the marker. Compared with Mg materials, pure copper has better plasticity. Also, it is difficult to diffuse the two layers between pure Mg and pure Cu during FSW. Simultaneously, these two materials can be distinguished directly through their colors. The tool sudden “stop action” was applied using the emergency stop, i.e., the FSW machine lost power suddenly and the tool was pulled out quickly. As for the welding parameters, a tool containing a concave shoulder of 16 mm diameter and a smooth cylindrical probe of 5 mm diameter and 4.8 mm length was used. The tilt angle of the tool was about 3°. The welding speed in this study was 200 mm/min. And the rotational speeds were 1,000 and 1,500 rpm, respectively.
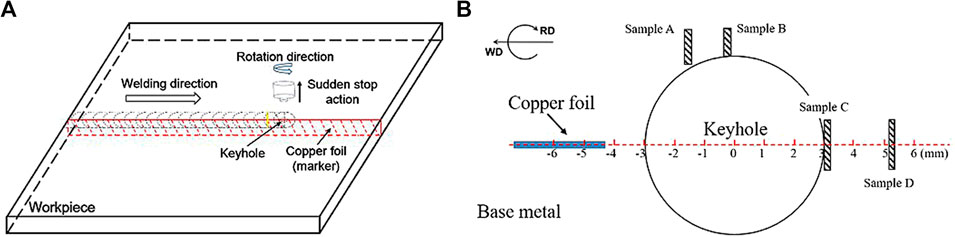
FIGURE 2. Schematic illustration FWS process.
After the FSW process, the specimen containing the “stop action” zone and keyhole was collected using wire cutting. The specimen was ground 1 mm from the top using abrasive papers. Optical microscope was used to reveal the evolution of the marker in the “stop action” zone. As shown in Figure 2B, samples were collected from different positions of “stop action” zone for characterization. The samples were mechanically polished after grounding with abrasive papers of 800#, 1,500#, 3,000#, and 5,000#, respectively. Electron back-scattered diffraction was conducted on the samples which were final polished with Argon ion polishing to reveal the detailed microstructural features.
Results and Discussion
Figure 3 shows the macro-graph of the keyhole (“stop action” zone). A plane-coordinate system is established: the center point of the probe hole is marked as the center position and the direction parallel to the welding direction is as the axis. The deformation status of pure Mg material at different positions can be obtained according to the shape and size of the marker. Compared with the study of Liu et al. (2019b), there exists obvious difference in the flow behavior of metals, resulting in different deformation states of the markers on the upper and lower surfaces. The appearance of this phenomenon is related to the nature of the material itself, which is affected by the shape of the stirring probe and the processing parameters (Han et al., 2019). In this study, the thickness of the Mg plates is relatively small (5 mm), and the shoulder diameter of the selected probe is large. The influence of the shoulder can reach the whole thickness, so that the metal flow at different layers is relatively consistent. The rotational speed of FSW selected in this study are 1,000–1,500 rpm. The higher the speed, the higher the temperature caused by FSW, and the better the fluidity of Mg. Meanwhile, a cylindrical probe is used in this study, and the length of the probe is close to the thickness of the pure Mg plate. The effect of probe on the metal flow on the upper and lower surfaces of the plate is basically the same. Thus, the metallographic observation of “stop action” zones of different thickness layers does not reveal obvious difference.
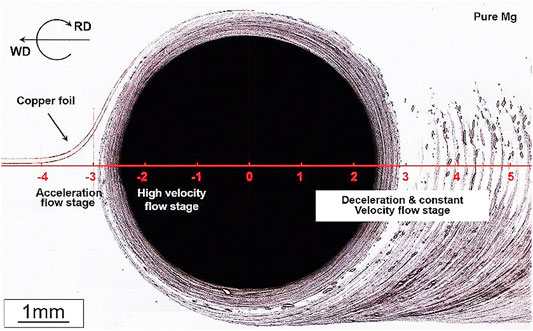
FIGURE 3. Metallographic photo of the “stop action” of FSW (1,000 rpm, 200 mm/min).
According to the status of the marker, the deformation process of FSW can be divided into three stages: 1) acceleration flow stage; 2) high velocity flow stage, and 3) deceleration and constant velocity flow stage. At stage I, the marker starts to deviate from the original position of the plate under the drive of the probe. The width of the marker becomes narrow, indicating that the flow velocity of the material gradually increases and the strain begins to accumulate. With the rotation of the probe, the material enters into the second stage. Together with the pure magnesium material flow, the marker is quickly stretched. The metal flow path becomes a circumferential movement around the probe. The width of the marker gradually decreases until it breaks, and the width of the copper foil in the end reaches ∼30 μm. In addition, the change of the marker is relatively uniform, which indicates that the change of the metal flow velocity is relatively stable. With the proceeding of deformation, the material enters into the third stage. During this period, the metal flows as a circular motion around the probe at an approximately uniform speed after a short period of the deceleration process. Finally, the metal is separated from the influence of the probe due to the forward movement of the probe. And the flow speed decreases rapidly until stops. The final deceleration process is slightly affected by the probe, and the accumulated strain is negligible. Therefore, this study only discusses the constant velocity flow stage and its previous evolution process.
According to the deformation characteristics of the marker, a geometrical method can be used to evaluate the change of the material strain during FSW. During the acceleration flow stage, the width of the marker does not change significantly, and the marker gradually deviates from the original position with the rotation of the probe. The deformation state of the marker can be decomposed into the shear strain perpendicular to the welding direction (
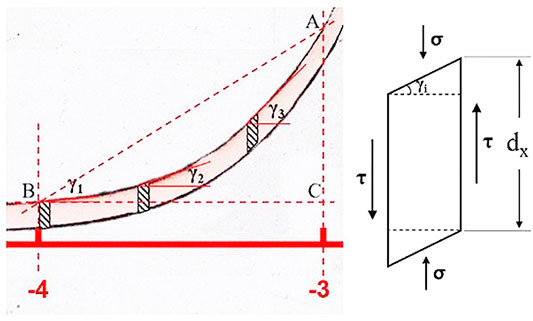
FIGURE 4. Acceleration flow stage and approximate deformation model.
It can be seen from Figure 4 that the value of γ increases from 0. When x = −3, γv reaches the maximum value. The accumulated strain of pure Mg during acceleration flow stage can be expressed by the following equation:
It can be calculated that the accumulated stain of the material during acceleration flow stage is very small, which is only ∼0.65.
The deformed metal flows circumferentially with the rotation of the probe, entering the high velocity flow stage from the acceleration flow stage (Figure 5). It can be seen from the deformation state of the marker that the material flow path becomes longer and the flow speed increases in this stage. Strain accumulates rapidly, and SPD occurs in the material in this stage. During the high velocity flow stage, the rotational probe provides compressive stress on the marker from the side, and the upper and lower surfaces of the marker are subjected to the compressive stress provided by the shoulder and the bottom plate. The driving force for the material flow comes from both the shoulder and the probe simultaneously, thus the velocity of the inner side may actually a bit larger than that of the outer side of the marker. Because the marker strip is very thin, the velocity gradient must be very low. Therefore, the deformation of the material during high velocity flow stage can be approximately equivalent to a tensile strain. As shown in Figure 5, the entire high velocity flow stage is divided into several small units. The strain on the upper and lower surfaces of each small unit can be approximated as.
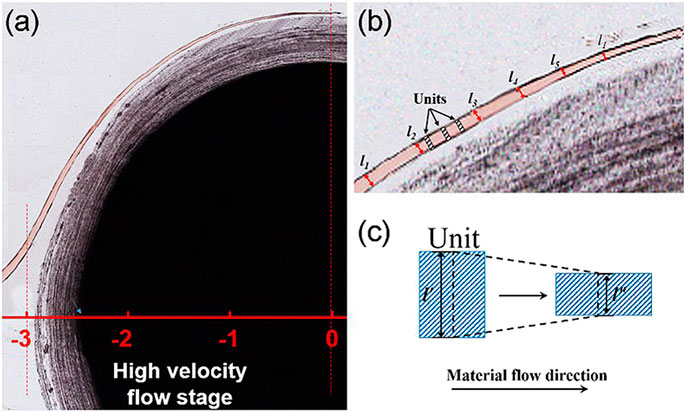
FIGURE 5. High velocity flow stage and approximate deformation model.
Therefore, the equivalent strain accumulated in the high velocity flow stage can be approximately expressed as:
where lx is the width of the marker.
After SPD in the high velocity flow stage, the metal material reaches an approximately uniform flow state after a short deceleration process. As shown in Figure 6, during the forward movement of the probe, the flow of metal left noticeable band-like traces on the opposite side of the welding direction. The band-like traces are relatively uniform, indicating that the metal flow velocity is relatively stable. At this time, the metal flows in a circumferential direction around the probe. The deformation state of the material is close to the bending deformation, and the direction of the stress is directed to the center of the probe. According to Liu et al. (2015b) study, the tangential strain of any small unit in the bending deformation zone can be expressed as:
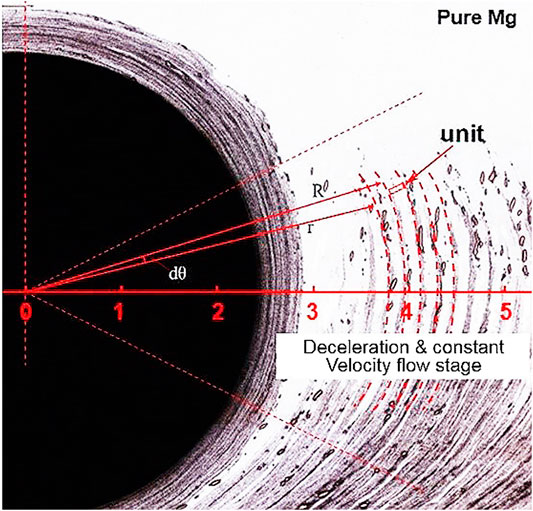
FIGURE 6. Deceleration and constant velocity flow stage.
The equivalent strain
Therefore, the accumulated strain when the metal flows through an angle of
According to the equations above, the cumulative strains of the materials in different positions in Figure 2B can be obtained as:
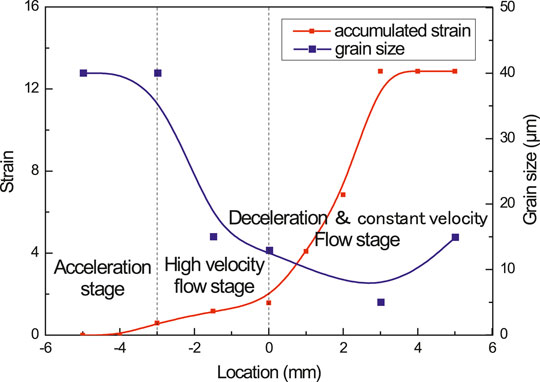
FIGURE 7. Distributions of strain and grain sizes of the samples at different positions.
In order to study the effect of deformation at different stages on the microstructures of the material, Figure 8 shows the microstructures of the material at different positions during the FSW process at 1,000 rpm. After the FSW process, the microstructures of pure Mg were significantly refined and the grains were fine and uniform. The average grain sizes of Sample A (Figure 8A), Sample B (Figure 8B), and Sample C (Figure 8C) are 15.0, 12.9, and 8.1 μm, respectively. According to the results of electron back-scattered diffraction, the fraction of LAGBs in Sample A, Sample B, and Sample C are 24.2, 35.5, and 41.3%, respectively. In the FSW process, the temperature in the stir zone is high, and dynamic recrystallization is the main mechanism for the grain refinement and generally the fraction of LAGBs decreased as a result of recrystallization. However, due to the SPD induced by FSW process, a large number of LAGBs appeared in the material, and the fraction of LAGBs significantly increased with the proceeding of FSW. As the rate of increase in the fraction of LAGBs caused by deformation exceeded the rate of decrease in the fraction of LAGBs caused by recrystallization, the actual fraction of LAGBs continuously increased with the proceeding of FSW process. When the metal flows to position C, the SPD process caused by FSW is basically completed, and the obtained microstructure should be the final state of the material. However, it can be seen from Figure 8D that the final microstructure (sample D) is obviously coarse, and the average grain size reached 14.9 μm. Moreover, the fraction of LAGBs in sample D is quite low, only 15.9%. During the process from position C to D, the material does not undergo plastic deformation, but the recrystallization process still proceeds, so that the fraction of LAGBs decreases rapidly. After the recrystallization process is completed, under the influence of the high temperature, the microstructure of the material grows up obviously. The blue curve in Figure 7 shows the variation tendency of the grain size of the material during the FSW process. During the acceleration flow stage, the strain introduced by FSW is very small, and the grain refinement is not obvious. In the high velocity flow stage, the metal flow is accelerated, resulting in SPD. Under the combined effect of recrystallization and SPD, the microstructure is significantly refined. In this stage, the grain size decreases the fastest, and the microstructure refinement is the most obvious. During the deceleration and constant velocity flow stage, the strain of the material increases rapidly, and the grains are further refined. Finally, a fine structure with an average grain size of <10 μm is obtained.
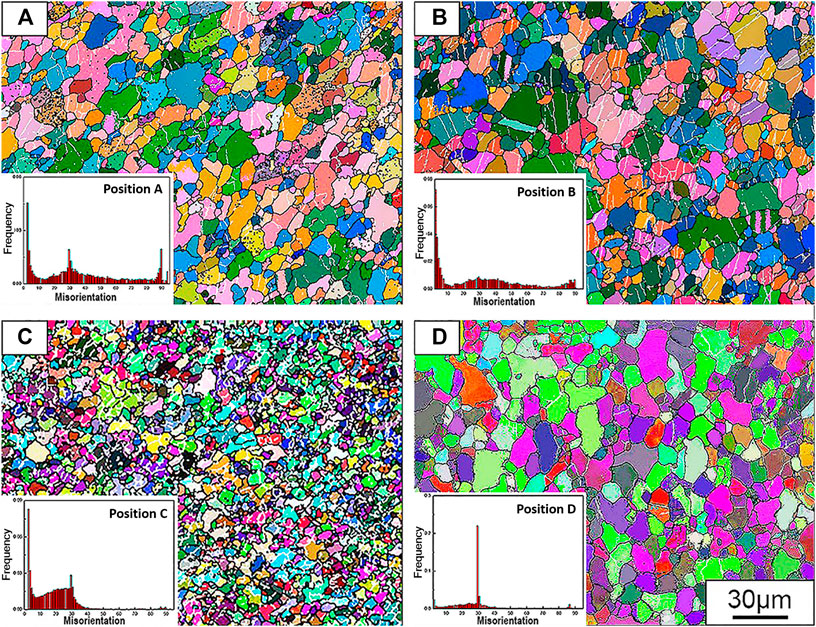
FIGURE 8. Microstructures and grain size distributions of the samples at different positions of the “stop action” zone showed in Figure 2B. (A) position A; (B) position B; (C) position C; and (D) position D.
During the FSW process in this study, the cumulative strain from position C to position D did not change, but the microstructure grew up significantly and the fraction of LAGBs decreased significantly. The high temperature caused by friction is the main reason for this phenomenon. Studies by Lambrakos (2018) and Woo et al. (2017) show that the temperature of the stir zone of Mg alloy during FSW can exceed 450°C and even as high as 550°C. According to the study of Commin et al. (2009), the ultimate temperature of Mg alloy produced by FSW process can be expressed by the following empirical formula,
Tm is the melting temperature of the Mg material (610°C), W is the rotational speed of the probe, V is the welding speed, and the constants α = 0.0442 and K = 0.8052 (Commin et al., 2009). It can be calculated that the resulting temperature under the FSW parameters (1,000 rpm of rotational speed and 200 mm/min of welding speed) can reach to ∼475°C. At this temperature condition, recrystallization and grain growth will significantly take place in pure Mg material.
According to the results of accumulated strain calculated above (Eqs. 2, 4, and 7), the size evolution of the marker can be approximated with the rotational speed (W), welding speed (V) and the diameter (d) of the probe. Thus, the formula is derivated as follows:
where k is a coefficient with dimension of 1, whose value is affected by the nature of the material and the welding speed V. θ is the angle that the flowing metal turns with the probe. The strain can be approximately predict before FSW process by using Eq. 9.
In order to verify the rationality of the above results, the same pure Mg sheet was used for FSW process with different parameters (1,500 rpm, 200 mm/min), and the welded samples were characterized. As shown in Figure 9, the pure Mg material after FSW process at 1,500 rpm has a similar evolution process as that at 1,000 rpm. During the deceleration and constant velocity flow stage, obvious recrystallization and grain growth occurred. During the FSW process, the average grain sizes of the samples at positions B (Figure 9B), C (Figure 9C), and D (Figure 9D) were 11.9, 6.5, and 10.3 μm, respectively. Compared with the sample at the same position at 1,000 rpm, the microstructure of the material is obviously further refined. It can be obtained that the fianl temperature caused by friction at 1,500 rpm is about 485°C (Eq. 8). Although the rotational speed of the probe is increased, the temperature field does not change significantly. The experimental results of Chang et al. (2004) showed that, when the rotational speed exceeds 1,000 rpm, the temperature of Mg alloys caused by friction of FSW process does not change a lot with the further increase of the rotational speed. The results of Park and You (2015) show that the mechanical properties of Mg alloys change little when the deformation temperature is about 450–500°C.
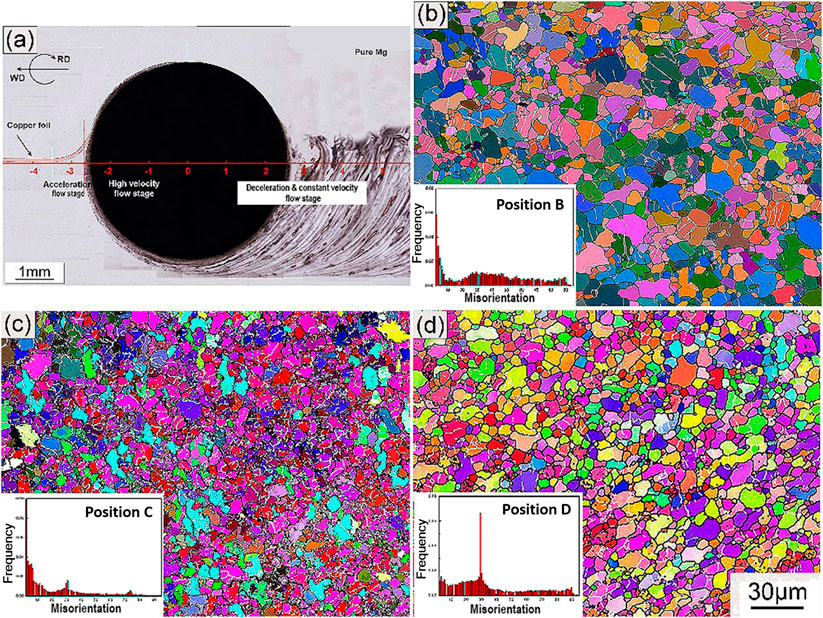
FIGURE 9. Results of the experiments of the plates FSWed with 1,500 rpm. (A) Metallographic photo of the “stop action”; (B) Microstructure at position B; (C) Microstructure at position C; and (D) Microstructure at position D.
In the present study, the temperature fields under different rotational speed conditions are not much different. It can be considered that the temperature influence on the microstructure evolution is relatively consistent at 1,000 and 1,500 rpm. Therefore, the ability of the FSW process to refine the microstructure of the material mainly depends on the rotational speed of probe. The faster the rotational speed of the probe, the more strain accumulated inside the material, the more obvious the grain refinement will happen. Studies (Albakri et al., 2013; Hung et al., 2007) show that the lower the speed of the probe during FSW process, the finer microstructure of Mg alloy can be obtained, which is contrary to the results obtained in the present study. The main reason for the opposite results is the difference in temperature fields. In the present study, the temperature fields obtained at different rotational speeds are not significantly different, and the effects of the temperature fields on the material are about the same. The temperature differences produced by the FSW process in Albakri et al. (2013) and Hung et al. (2007) are 60 and 70°C, respectively. The large temperature difference will obviously affect the grain growth process. Simultaneously, the higher temperature easily causes larger range of high temperature field, so that the grain growth process extends for a long period. Therefore, the lower temperature field during FSW process resulted in the finer microstructures.
Adopting to the method described in this study, the cumulative strain of pure Mg at different positions at 1,500 rpm was measured by inserting the marker into the butting surface of the workpieces. A plane-coordinate system is established: the cumulative strain and the position of the deformed material are as axes. The results are shown in Figure 10. The red and blue curves are the curves plotted by Eq. 9 underboth 1,000 and 1,500 rpm, respectively. In the acceleration flow stage and high velocity flow stage, the cumulative speed of strain is slow, thus the curves are not significantly different. In the deceleration and constant velocity flow stage, the cumulative speed of strain is faster at 1,500 rpm than that at 1,000 rpm, and the value of accumulated strain is higher, thus the finer microstructure is obtained. In this study, the difference value between the cumulative strains at different rotational speeds is close to 2. Studies (Fan et al., 2012; Xu et al., 2017; Chen et al., 2016b) indicated that each increase of 1 in the accumulation of strain during SPD has a significant effect on the microstructure of the material. Especially when the grain size is large, the influence of the strain is more significant. The black dots are the strain values actually measured at 1,500 rpm (Figure 9A), and they agree well with the curve drawn by the formula (the blue curve), indicating that the obtained empirical formula (Eq. 9) is credible.
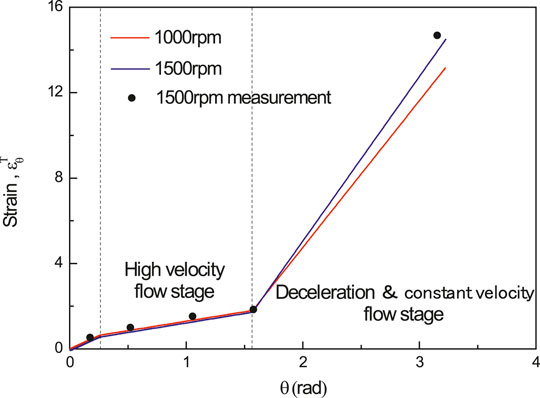
FIGURE 10. Changes of the strain at different parameters of FSW.
Conclusions
(1) The studied pure Mg plates were successfully welded at the welding speed of 200 mm/min, probe rotational speeds of 1,000 and 1,500 rpm. The final microstructure obtained after FSW is fine and homogeneous. The higher the rotational speed of the probe, the finer microstructure obtained.
(2) The accumulation of strains during the FSW process was calculated by inserting a marker (pure copper foil) into the butting surface of the two workpieces. The process of accumulating strain can be divided into three stages. The higher the rotational speed of the probe, the more severe the deformation occurs in the material. The values of the accumulated strain of the material are 12.86 and 14.5 at the rotational speed of 1,000 and 1,500 rpm, respectively.
(3) A credible empirical formula is established to characterize the cumulative process of the strain during FSW process. For this formula, only the welding parameters of the FSW process are needed to approximate the accumulated strain of the material at different deformation stages.
(4) The microstructural evolution during FSW of pure Mg shows that the final microstructure is is significantly refined due to the combined influence of SPD and recrystallization. However, significant grain growth occurred after strain accumulation, which is due to the high temperature field caused by friction.
Data Availability Statement
The raw data supporting the conclusions of this article will be made available by the authors, without undue reservation, to any qualified researcher. The original contributions presented in the study are included in the article/supplementary materials, further inquiries can be directed to the corresponding author/s.
Author Contributions
ZL conceived this experiment, analysed the data and the results of the experiments and wrote the manuscript. HD, YC, and LL discussed the results, commented on the manuscript and gave valuable advices for the manuscript. JL performed the friction stir welding process.
Conflict of Interest
Author JL was employed by company FSW Welding Technology (Shanghai) Co., LTD.
The remaining authors declare that the research was conducted in the absence of any commercial or financial relationships that could be construed as a potential conflict of interest.
References
Ahmadkhaniha, D., Jarvenpaa, A., Jaskari, M., Sohi, M. H., Zarei-Hanzaki, A., Fedel, M., et al. (2016). Microstructural modification of pure Mg for improving mechanical and biocorrosion properties. J. Mech. Behav. Biomed. Mater. 61, 360–370. doi:10.1016/j.jmbbm.2016.04.015
Albakri, A. N., Mansoor, B., Nassar, H., and Khraisheh, M. K. (2013). Thermo-mechanical and metallurgical aspects in friction stir processing of AZ31 Mg alloy-A numerical and experimental investigation. J. Mater. Process. Technol. 213, 279–290. doi:10.1016/j.jmatprotec.2012.09.015
Avedesian, M. M., and Baker, H. (1999). Magnesium and magnesium alloys, Materials Park, OH: ASM International.
Chang, C. I., Lee, C. J., and Huang, J. C. (2004). Relationship between grain size and Zener-Holloman parameter during friction stir processing in AZ31 Mg alloys. Scripta Mater. 51, 509–514. doi:10.1016/j.scriptamat.2004.05.043
Chen, C., Lv, B., Feng, X., Zhang, F., and Beladi, H. (2018). Strain hardening and nanocrystallization behaviors in Hadfield steel subjected to surface severe plastic deformation. Mater. Sci. Eng. A 729, 178–184. doi:10.1016/j.msea.2018.05.059
Chen, Y., Ding, H., Cai, Z., Zhao, J., and Li, J. (2016a). Effect of initial base metal temper on microstructure and mechanical properties of friction stir processed Al-7B04 alloy. Mater. Sci. Eng. A 650, 396–403. doi:10.1016/j.msea.2015.10.083
Chen, Y., Ding, H., Li, J., Cai, Z., Zhao, J., and Yang, W. (2016b). Influence of multi-pass friction stir processing on the microstructure and mechanical properties of Al-5083 alloy. Mater. Sci. Eng. A 650, 281–289. doi:10.1016/j.msea.2015.10.057
Commin, L., Dumont, M., Masse, J.-E., and Barrallier, L. (2009). Friction stir welding of AZ31 magnesium alloy rolled sheets: influence of processing parameters. Acta Mater. 57, 326–334. doi:10.1016/j.actamat.2008.09.011
Commin, L., Dumont, M., Rotinat, R., Pierron, F., Masse, J.-E., and Barrallier, L. (2012). Influence of the microstructural changes and induced residual stresses on tensile properties of wrought magnesium alloy friction stir welds. Mater. Sci. Eng. A 551, 288–292. doi:10.1016/j.msea.2012.05.021
Dialami, N., Cervera, M., and Chiumenti, M. (2018). Numerical modelling of microstructure evolution in friction stir welding (FSW). Metals 8, 183–198. doi:10.3390/met8030183
Fan, G. D., Zheng, M. Y., Hu, X. S., Xu, C., Wu, K., and Golovin, I. S. (2012). Improved mechanical property and internal friction of pure Mg processed by ECAP. Mater. Sci. Eng. A 556, 588–594. doi:10.1016/j.msea.2012.07.031
Han, Y., Jiang, X., Chen, S., Yuan, T., Zhang, H., Bai, Y., et al. (2019). Microstructure and mechanical properties of electrically assisted friction stir welded AZ31B alloy joints. J. Manuf. Process. 43, 26–34. doi:10.1016/j.jmapro.2019.05.011
Hung, F.-Y., Shih, C.-C., Chen, L.-H., and Lui, T.-S. (2007). Microstructures and high temperature mechanical properties of friction stirred AZ31-Mg alloy. J. Alloys Compd. 428, 106–114. doi:10.1016/j.jallcom.2006.03.066
Kumar, R., Pancholi, V., and Bharti, R. P. (2018). Material flow visualization and determination of strain rate during friction stir welding. J. Mater. Process. Technol. 255, 470–476. doi:10.1016/j.jmatprotec.2017.12.034
Lambrakos, S. G. (2018). Parametric modeling of AZ31-Mg alloy friction stir weld temperature histories. J. Mater. Eng. Perform 27, 5823–5830. doi:10.1007/s11665-018-3716-9
Liu, D., Xin, R., Xiao, Y., Zhou, Z., and Liu, Q. (2014). Strain localization in friction stir welded magnesium alloy during tension and compression deformation. Mater. Sci. Eng. A 609, 88–91. doi:10.1016/j.msea.2014.04.089
Liu, D., Xin, R., Zheng, X., Zhou, Z., and Liu, Q. (2013). Microstructure and mechanical properties of friction stir welded dissimilar Mg alloys of ZK60-AZ31. Mater. Sci. Eng. A 561, 419–426. doi:10.1016/j.msea.2012.10.052
Liu, F. C., Liao, J., Gao, Y., and Nakata, K. (2015a). Influence of texture on strain localization in stir zone of friction stir welded titanium. J. Alloys Compd. 626, 304–308. doi:10.1016/j.jallcom.2014.12.011
Liu, X. C., Wu, C. S., and Padhy, G. K. (2015b). Characterization of plastic deformation and material flow in ultrasonic vibration enhanced friction stir welding. Scripta Mater. 102, 95–98. doi:10.1016/j.scriptamat.2015.02.022
Liu, X. C., Sun, Y. F., Nagira, T., Ushioda, K., and Fujii, H. (2019a). Evaluation of dynamic development of grain structure during friction stir welding of pure copper using a quasi in situ method. J. Mater. Sci. Technol. 35, 1412–1421. doi:10.1016/j.jmst.2019.01.018
Liu, X. C., Sun, Y. F., Nagira, T., Ushioda, K., and Fujii, H. (2019b). Experimental evaluation of strain and strain rate during rapid cooling friction stir welding of pure copper. Sci. Technol. Weld. Join. 24, 352–359. doi:10.1080/13621718.2018.1556436
Mordike, B. L., and Ebert, T. (2001). Magnesium: properties — applications — potential. Mater. Sci. Eng. A 302, 37–45. doi:10.1016/s0921-5093(00)01351-4
Morisada, Y., Imaizumi, T., and Fujii, H. (2015). Determination of strain rate in Friction Stir Welding by three-dimensional visualization of material flow using X-ray radiography. Scripta Mater. 106, 57–60. doi:10.1016/j.scriptamat.2015.05.006
Nikulin, I., Malopheyev, S., Kipelova, A., and Kaibyshev, R. (2012). Effect of SPD and friction stir welding on microstructure and mechanical properties of Al-Cu-Mg-Ag sheets. Mater. Lett. 66, 311–313. doi:10.1016/j.matlet.2011.08.104
Pan, W., Li, D., Tartakovsky, A. M., Ahzi, S., Khraisheh, M., and Khaleel, M. (2013). A new smoothed particle hydrodynamics non-Newtonian model for friction stir welding: process modeling and simulation of microstructure evolution in a magnesium alloy. Int. J. Plast., 48, 189–204. doi:10.1016/j.ijplas.2013.02.013
Park, S. H., and You, B. S. (2015). Effect of homogenization temperature on the microstructure and mechanical properties of extruded Mg-7Sn-1Al-1Zn alloy. J. Alloys Compd. 637, 332–338. doi:10.1016/j.jallcom.2015.03.030
Pougis, A., Tóth, L. S., Bouaziz, O., Fundenberger, J.-J., Barbier, D., and Arruffat, R. (2012). Stress and strain gradients in high-pressure tube twisting. Scripta Mater. 66, 773–776. doi:10.1016/j.scriptamat.2012.02.004
Valiev, R. Z., and Langdon, T. G. (2006). Principles of equal-channel angular pressing as a processing tool for grain refinement. Prog. Mater. Sci. 51, 881–981. doi:10.1016/j.pmatsci.2006.02.003
Woo, W., Feng, Z., Clausen, B., and David, S. A. (2017). In situ neutron diffraction analyses of temperature and stresses during friction stir processing of Mg-3Al-1Zn magnesium alloy. Mater. Lett. 196, 284–287. doi:10.1016/j.matlet.2017.03.117
Xu, R., Mahmudi, R., Pereira, P. H. R., Huang, Y., and Langdon, T. G. (2017). Microstructural evolution and superplasticity in an Mg-Gd-Y-Zr alloy after processing by different SPD techniques. Mater. Sci. Eng. A 682, 577–585. doi:10.1016/j.msea.2016.11.080
Yang, J., Xiao, B. L., Wang, D., and Ma, Z. Y. (2010). Effects of heat input on tensile properties and fracture behavior of friction stir welded Mg-3Al-1Zn alloy. Mater. Sci. Eng. A 527, 708–714. doi:10.1016/j.msea.2009.09.044
Yang, Q., Li, X., Chen, K., and Shi, Y. J. (2011). Effect of tool geometry and process condition on static strength of a magnesium friction stir lap linear weld. Mater. Sci. Eng. A, 528, 2463–2478. doi:10.1016/j.msea.2010.12.030
Yang, Q., Xiao, B. L., and Ma, Z. Y. (2013). Enhanced superplasticity in friction stir processed Mg-Gd-Y-Zr alloy. J. Alloys Compd. 551, 61–66. doi:10.1016/j.jallcom.2012.10.002
Zhilyaev, A., and Langdon, T. (2008). Using high-pressure torsion for metal processing: fundamentals and applications. Prog. Mater. Sci. 53, 893–979. doi:10.1016/j.pmatsci.2008.03.002
Keywords: friction stir welding, pure magnesium, strain, microstructural evolution, electron back-scattered diffraction, empirical equations
Citation: Li Z, Ding H, Chen Y, Li J and Liu L (2020) Strain Accumulation and Microstructural Evolution During Friction Stir Welding of Pure Magnesium. Front. Mater. 7:603464. doi: 10.3389/fmats.2020.603464
Received: 07 September 2020; Accepted: 22 October 2020;
Published: 16 November 2020.
Edited by:
Liqiang Wang, Shanghai Jiao Tong University, ChinaReviewed by:
Wencai Liu, Shanghai Jiao Tong University, ChinaZhen Zhang, Hefei University of Technology, China
Copyright © 2020 Li, Ding, Chen, Li and Liu. This is an open-access article distributed under the terms of the Creative Commons Attribution License (CC BY). The use, distribution or reproduction in other forums is permitted, provided the original author(s) and the copyright owner(s) are credited and that the original publication in this journal is cited, in accordance with accepted academic practice. No use, distribution or reproduction is permitted which does not comply with these terms.
*Correspondence: Hua Ding, ZGluZ2hAc21tLm5ldS5lZHUuY24=