 Deborah Briccola
 Anna Pandolfi
- Department of Civil and Environmental Engineering, Politecnico di Milano, Milan, Italy
The mitigation properties of metaconcrete cast with two types of resonant inclusions are assessed through wave transmission tests. Three cylindric metaconcrete specimens of regular size (20 cm height, 10 cm diameter), containing an equal number of different type of inclusions disposed in a semi-regular lattice, are tested in the longitudinal direction within the sonic range of frequencies. Inclusions, bi-material spheres consisting of a heavy core coated with a soft material, are characterized by a resonant behavior, evaluated numerically with a finite element modal analysis of a unit metaconcrete cell. Each metaconcrete specimen contains six layers consisting of six engineered aggregates of different type. Inclusions are disposed by rotating each layer with respect to the adjacent ones, as so as to create a pseudo-random arrangement. Specimens are excited by a sinusoidal signal of linearly growing frequency, sweeping a range centered at the translational eigenfrequency of the resonant inclusion. A standard plain concrete specimen is used as reference to define a transmissibility coefficient, that facilitates the quantification of the attenuation properties. With respect to plain concrete, all metaconcrete specimens show a marked (up to 80–90%) attenuation of the transmitted signal in proximity of the numerically estimated eigenfrequency of the inclusion. The intensity of the attenuation is weakly dependent on the type of the inclusion, while the frequency where the attenuation is observed depends markedly on the inclusion type. As a very positive quality in the view of practical applications, experimental results confirm that the attenuation effectiveness of metaconcrete is not related to the ordered microstructural arrangement.
1 Introduction
Metaconcrete is a relatively new type of concrete showing an enhanced dynamic behavior due to bi-material spherical inclusions, made of a heavy metal core coated with a compliant polymeric layer. Engineered inclusions replace the coarse aggregates (gravel and stones >6 mm) traditionally embedded into a standard Portland cement matrix. Because of the unconventional properties shown in dynamic conditions, metaconcrete is regarded as a mechanical metamaterial, i.e., a locally resonant phononic crystal which exhibits different wave attenuation mechanisms depending on the frequency of the incoming wave.
The development of sonic or phononic crystals for use in acoustic metamaterials has received an enormous attention in the last two decades Liu et al. (2000); Sheng et al. (2003); Goffaux and Sánchez-Dehesa (2003); Wang et al. (2004a), Wang et al. (2004b); Hirsekorn (2004); Hirsekorn et al. (2006). Similarly to the photonic crystals used in the attenuation of electromagnetic waves, phononic crystals exhibit wave filtering behavior, originating band gaps or stop bands in the frequency spectrum. Applied acoustic or elastic waves cannot propagate within the bandgap frequency range, thus the incident mechanical energy is dispersed or scattered from the medium. Phononic crystals often make use of Bragg-type band gaps Goffaux and Sánchez-Dehesa (2003); Hirsekorn (2004); Wang et al. (2004c), where the periodicity of the structure induces vibration reduction within the material. In order to induce Bragg gaps in the low frequency range, the internal structure must be arranged in a spatial period of similar size to the wavelength of the incoming wave.
Under low frequency dynamic excitations
Typically, civil engineering structures are excited by low frequency actions (wind, seismic waves, rotating and vibrating machines, high speed transportation means), therefore the Bragg scattering effect due to a regular lattice cannot be exploited. The relaxation of the requirement of having a regular arrangement of the inclusions makes metaconcrete a very good candidate for civil engineering applications. The casting procedure used for standard concrete, where aggregates, cement and water are randomly mixed directly at the site of the construction, applies directly to metaconcrete, with an evident saving of time, costs, and logistic issues with respect to alternative methods.
As shown in Mitchell et al. (2014), the inclusion eigenfrequencies can be designed for a targeted frequency by choosing suitable size and material for core and coating. A numerical modal analysis of a unit cell of metaconcrete allows to identify a range of eigenfrequencies associated to rotational, translational, or deformative modes of the inclusion components. Modal analysis reveals the mechanisms that reduce the mechanical energy on the matrix: the rotation and the translation of the core, and the periodic deformation of the coating. A compressive planar wave, as the one used in the experimental validations of metaconcrete Briccola et al. (2017), Briccola et al. (2019), Briccola et al. (2020), activates the translational modes of the core, resulting in a core motion in opposition of phase with respect to the matrix. Yet, rotational modes of the core cannot be activated by a planar wave, and the low content of energy carried by the signals used in experiments cannot excite the deformation modes of the coating.
The translation of the core is the mechanism associated to the sole natural frequency
The dependence of the eigenfrequency on the material properties of the coating, in particular Young’s modulus and Poisson’s coefficient, points out that the mechanical characteristics of the coating are key design parameters for metaconcrete, although the choice of the appropriate material is determined by fabrication, adhesion, and durability issues as well.
Viscous behavior of metaconcrete has been considered within a homogenization strategy from micro-to-macro scale to analyze plane waves dispersion in multi-layered viscoelastic periodic composites Tan and Poh (2020). The formulation includes micro-inertial effects and non local interaction mechanism between materials, proposing an unifying approach to study the response of metaconcrete under high energy excitations, where Bragg scattering and local resonators cooperate to signal mitigation. Mortar brittleness is an important aspect that must be considered in applications where impacts and blasts are of interest. The behavior of metaconcrete under blast has been taken into account numerically by modeling fracture with eigenerosion Pandolfi and Ortiz (2012); Mitchell et al. (2016), suggesting an overall good behavior of metaconcrete in spite of the presence of multiple material interfaces.
A numerical study on the performance of metaconcrete under blasting events investigated the influence of shape and materials of the inclusions Xu et al. (2020). In Miranda et al. (2019), the properties of a thin plate of metaconcrete, with inclusions arranged in a regular rectangular or triangular lattice, were assessed numerically by considering the propagation of flexural waves. Results showed very good possibilities to use metaconcrete to control low-frequency content flexural vibrations in thin plates.
In the wake of the first works on phononic crystals, several studies investigated the possibility to reduce the amplitude of mechanical waves by playing with an appropriate combination of materials and geometries Khan et al. (2018); Bonanomi et al. (2015); An et al. (2018), including multi-layer metamaterials analyzed theoretically and numerically Wang et al. (2017). An elastic metamaterial including spherical multi-resonators, made of five layers of different materials, was demonstrated numerically and experimentally to exhibit energy attenuation properties over multiple frequency intervals Barnhart et al. (2019).
For the specificity of metaconcrete, the attainment of multiple attenuation band gaps can be targeted easily by combining bi-material inclusions of different size and materials rather than introducing multilayered inclusions. A recent experimental campaign, conducted on ten metaconcrete specimens with two types of aggregated randomly cast, provided some design hints on the possibility to enhance the performance of metaconcrete in the view of applications addressing vibration and shock mitigation Briccola et al. (2020).
This study reports the findings of an experimental campaign carried out to assess the performance of metaconcrete and to highlight potential advantages deriving from the mixing of non-homogenous engineered aggregates. The investigation was conducted in parallel with the one described in Briccola et al. (2020), which for the first time used two types of inclusions in a fully random distribution within the mortar matrix, and considered three densities of inclusions. By the way of contrast, in the specimens used in the present study the inclusions have been arranged in a quasi-regular setting, in the attempt to create a homogenous material. The results of the previous study suggested to investigate the response of the metaconcrete under point source signal transmitted at different locations at the basis of the cylinder. The use of a more ordered disposition of the inclusions might affect the experimental observations along different paths, since it excludes the possible segregation of inclusions. In addition, the choice to arrange the inclusions layer by layer with a specific architecture will allow the numerical simulation of the dynamic response of the specimens in a subsequent research. Finally, the quasi-regular layered microstructure of the present metaconcrete specimens can be exploited in a future experimental campaign to assess the eventual role of Bragg scattering in the ultrasonic regime in combination with higher order local resonances related to the coating deformations in terms of wave attenuation.
The paper is organized as follows. Materials and Methods describes specimens, casting procedures, experimental setup, and experimental program. Results collects the results of the experiments. Discussion includes the discussion with a final commentary and lists future perspectives.
2 Materials and Methods
Nondestructive tests involving swept-sine excitations in the sonic range (250–10.5 kHz) were carried out on cylindrical specimens of metaconcrete, characterized by a quasi-regular arrangement of inclusions of two different types. The specimens were cast at the Laboratory of Materials Testing (LPM), Politecnico di Milano, Italy, in the sequel of a previous experimental campaign that used specimens with randomly arranged inclusions Briccola et al. (2020). The layout of the first experimental setting was preserved, but in order to reduce the effort for casting and to facilitate the comparison of the results, the sample size has been limited to three specimens with equal density of inclusions and one made of plain concrete. An electro-mechanical mass vibration exciter (transmitting unit) was mounted on the top base of each specimen. In order to collect the material response along the excitation axis, four receiving units (piezoelectric transducers) were mounted at equal distance one from the others. The mix design procedure, the casting operations, the experimental setup and the test program are described in the following.
2.1 Metaconcrete Specimens
Cylindrical samples with a 2:1 height-to-diameter ratio were cast by disposing manually six inclusions on six layers along the longitudinal direction of the specimen, to create artificially a pseudo random organization of the aggregates. The specimen size (20 cm height and 10 cm diameter) satisfies the requirements for the assessment of the natural frequencies of entire specimen according to the code ASTM (2008). The geometry accommodates up to 36 inclusions, reaching the maximum density achievable with a minimum distance between inclusion surfaces set to 1 cm, to avoid the direct contact between the engineered aggregates, condition that is not guaranteed when a random casting is used. The minimum mortar cover was also set to 1 cm.
The prototypes of metaconcrete were cast according to C192 (2016) using disposable steel molds and different inclusions. A mortar paste made of a mix of Portland cement CEM II/A-LL 42.5R (330 kg/m3), sand and small aggregates (1,835 kg/m3), and water (198 kg/m3) was designed. The coarser aggregates (gravel and stones) have been substituted with two types of engineered inclusions, whose geometrical and material properties are listed in Table 1. The two inclusions, shown in Figure 1, have comparable sizes but the coatings are characterized by rather different elastic properties. Type 1 inclusions are commercially available mouse balls, employed also in previous dynamical experiments Briccola et al. (2019), Briccola et al. (2020). Type 2 inclusions have been manufactured ad hoc using natural rubber, with the goal to increase the elastic modulus at a relatively low material density.
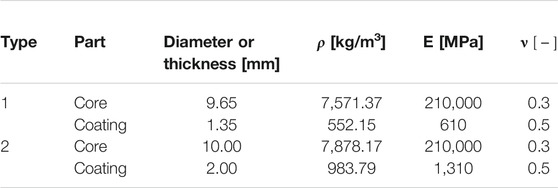
TABLE 1. Geometrical and mechanical characteristics of type 1 (PDMS coated) and type 2 (natural rubber coated) inclusions. For each type of inclusion, the dimension parameter represents the radius and the thickness of core and coating respectively.
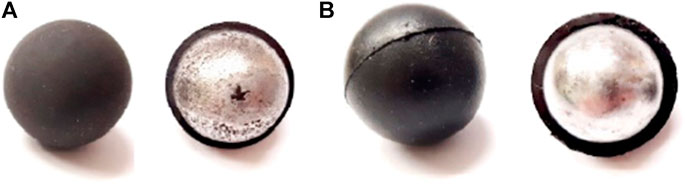
FIGURE 1. Local resonators intact and bare to show the core; (A) Type 1 inclusions coated with polydimethylsiloxane; (B) Type 2 inclusions coated with natural rubber.
The features of the four specimens are reported in Table 2. S0 denotes the plain concrete specimen, S1 the specimen with type 1 inclusions, S2 the specimen with type 2 inclusions, and S3 the specimen with two types of inclusions. The pattern adopted for specimen S3 is visualized in Figure 2. In each layer, the six inclusions are disposed approximatively in a pentagonal shape. The pentagon of each layer is rotated of about 25° relative to the adjacent ones, trying to avoid the superposition of aggregates of the same type along the longitudinal axis of the specimen.
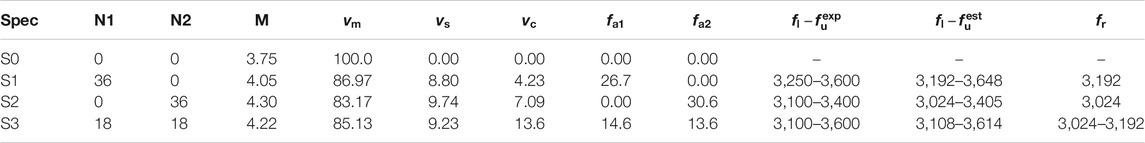
TABLE 2. Geometrical and mechanical characteristics of the specimens. N1: number of type 1 inclusions, N2: number of type 2 inclusions, M [Kg]: specimen mass,
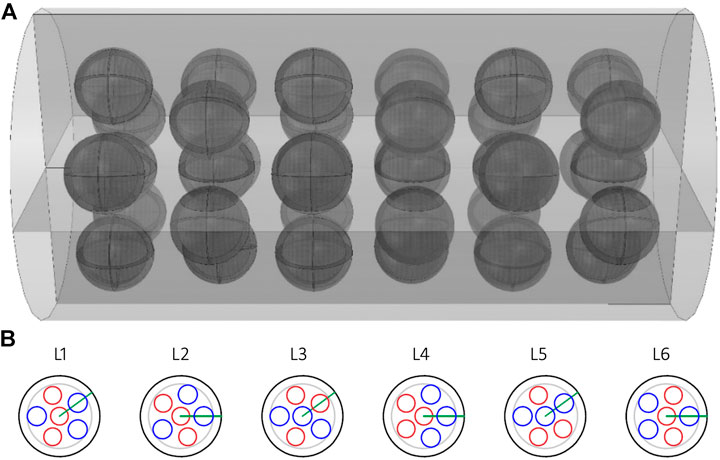
FIGURE 2. Inclusion arrangement in the specimen containing mixed type engineered aggregates. Layer L1 corresponds to the bottom of the specimen, the first layer cast, and Layer L6 corresponds to the top of the specimen. Type 1 inclusions are indicated in red, type 2 inclusions are indicated in blue. The green line shows the rotation of the layer with respect to L1; (A) three-dimensional representation; (B) Inclusion patterns layer by layer.
Materials were blended with an electric mixer, Figure 3A. The plastic mix was poured in metallic mold in several steps. In each step, the mix pouring was followed by the arrangement of the inclusions using a metallic clamp, Figure 3B, and by a further pouring to fill the gaps between the inclusions. Each layer was compacted by means of a small tamping rod with rounded ends and to exclude the formation of cavities, and the external surface of the mold was tapped with a mallet. The top surface was flattened as much as possible with a putty knife. A proper time lapse between the casting of two adjacent layers was respected to avoid the segregation of the inclusions: the level of the specimen during the casting was constantly monitored. All the operations described were executed quickly, in order to keep a constant mix consistence. Next, specimens were stored in a curing room for 24 h, Figure 3C. After curing, specimens were de-moulded, marked and kept for seven days in a water storage tank to avoid micro-cracking due to evaporation, Figure 3D. Finally, specimens were stocked in the curing room, out of the water storage, for other 20 days to complete curing.
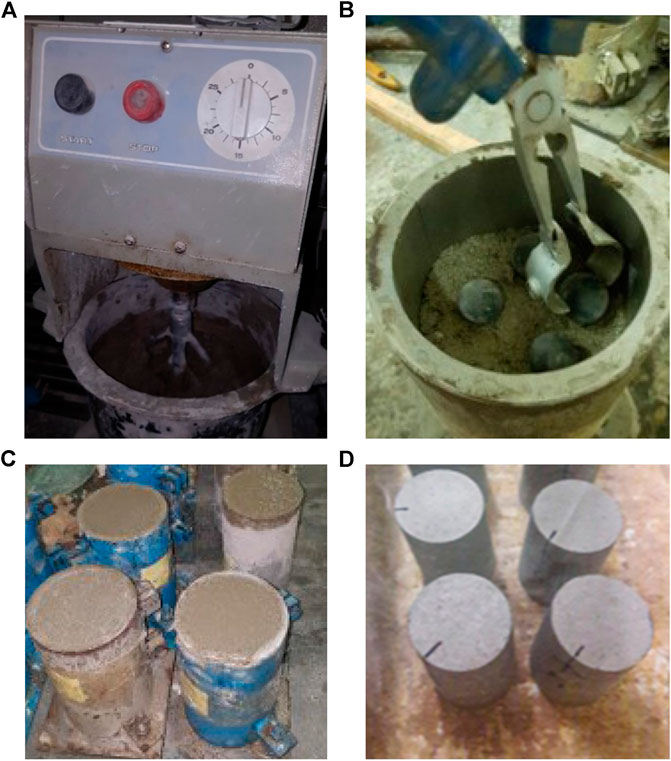
FIGURE 3. Casting of the specimen (A) blending and mixing of the matrix phase; (B) disposal of the inclusions; (C) casting procedure completed; (D) hydration in a water tank (7 days).
The orientation of the first inclusion of the top layer, corresponding to the green line of Level 6 in Figure 2, was marked on the top of the specimens to keep trace of the actual disposition of inclusions. Before testing, specimen bases were polished to facilitate adhesion with the testing instruments. The specimens were weighted at the end of the procedure, see Table 2.
The eigenfrequencies of the resonant inclusions have been estimated numerically, by means of a modal analysis with finite elements illustrated in the parallel paper Briccola et al. (2020). The first three eigenfrequencies of the two types of inclusions are reported in the first column of Table 3, second and third groups of lines.
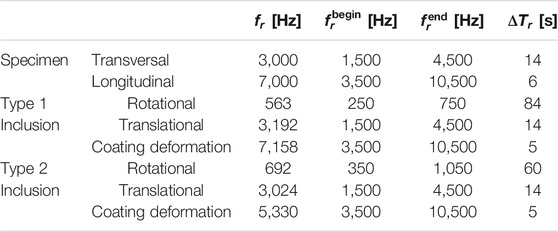
TABLE 3. Parameters adopted for each frequency range during a linear sweep. Specimen natural frequencies have been measured by hammer testing. Inclusion resonant frequencies have been estimated by numerical modal analysis.
2.2 Experimental Setup
Dealing with dynamic testing, the experimental setup was carefully designed in order to avoid possible interactions with the specimens and to minimize the background noise. Specifically, several setups were implemented and their interference with the measurements was assessed before selecting the one used in the experiments. The setup is composed by two subsystems operating in parallel, see Figure 4: a driving circuit and a data acquisition circuit. The driving system comprises a 4-channel oscilloscope Picoscope 2,206, Figure 4A. The oscilloscope triggers a signal pre-amplified by a Nobsound Minimplifier Bluetooth Power Amplifier, Figure 4B, and transmitted to a Duokon vibration speaker, an electro-mechanical mass vibration exciter emitting a linear swept-sine elastic wave, Figure 4C. The data acquisition circuit consists of four contact piezoelectric shear-type transducers PCB 353B15 SN, Figure 4D, to detect the accelerations. The transducers transform the accelerations into electric signals, in turn recorded by a data acquisition system, four Channel, 24-Bit Analog Input Modules - NI USB-9239, Figure 4E. Each system was controlled by a dedicated computer, Figure 4F.
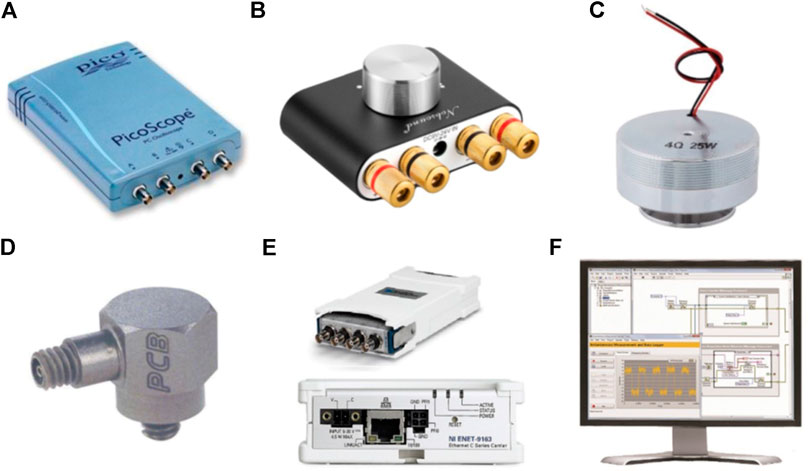
FIGURE 4. Components of the experimental setup (A) oscilloscope; (B) sound-amplifier; (C) mass vibration exciter; (D) piezoelectric shear-type transducer; (E) data acquisition system; (F) PC.
The vibration speaker and the four accelerometers were glued at the bases of each specimen to ensure a continuum and stable contact throughout the development of the test, Figure 5. For all the duration of the tests, specimens rested onto two neoprene bearing supports (8 cm distant) fixed to a small timber joist, to minimize the interference with the background noise.
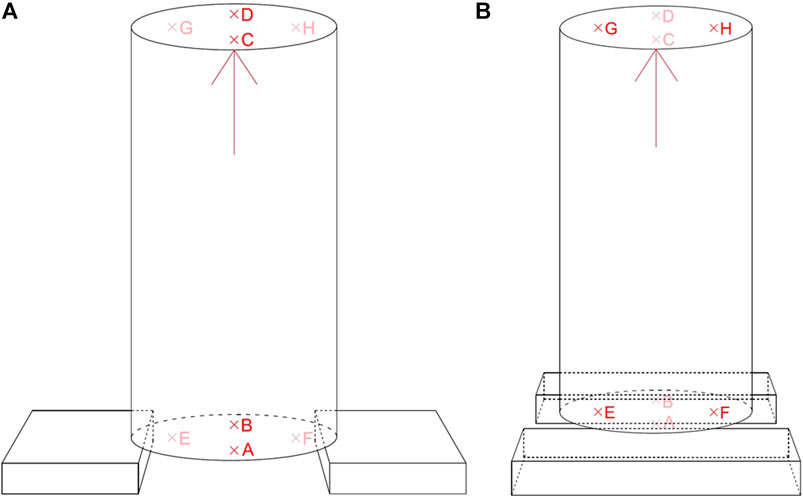
FIGURE 5. Piezoelectric accelerometers location (A) Test 1 uses transducers A, B, C and D; (B) Test 2 uses transducers E, F, G and H.
2.3 Test Program
Natural frequencies associated to the global behavior of the specimen or to the experimental setup may alter significantly the measurements of the attenuation properties of metaconcrete and are source of uncertainties that might compromise the experimental campaign. To identify the upperbounds of the frequency ranges to be explored in the tests, the natural longitudinal and transversal frequencies of each specimen were measured according to the standard specification contained in ASTM Standard C215. Afterward, ultrasonic tests were performed to check the uniformity of the specimens.
In the sequel of the previous experimental campaigns Briccola et al. (2020), linear swept-frequency sinusoidal excitations at constant amplitude (A = 5.68 Vpp) were applied in the longitudinal direction of each specimen, from the top basis to bottom basis. Measurements were taken at four distinct locations (A, B, E, and F on the bottom basis; C, D, G, and H on the top basis), see Figure 5, seeking for possible variations in the signal transmission.
The range of frequencies swept by the imposed excitations were chosen, in the respect of the operative bandwidth of the transducers (±10 0.7–18,000 Hz), on the basis of the eigenfrequencies of the inclusions, estimated numerically, see Table 3. The width
According to Gloth and Sinapius (2004), within the frequency range
where
With reference to the theoretical minimum time lapse, the actual time lapse used in the experiments was incremented to ensure that the acceleration never exceeds the maximum value. A linear swept sine excitation represents a good compromise between the necessary amplitude of excitation and the time requested to perform all the tests Gloth and Sinapius (2004). A wealth of measurements were performed during the experimental campaign. For the sake of brevity, in Sec. 3 only the results corresponding to the application of two swept-sine excitations, centered at 3,000 and 7,000 Hz, are presented.
3 Results
The results of the preliminary hammer tests performed to identify the longitudinal and transversal natural frequencies of the four specimens are presented in Figure 6 in terms of Fast Fourier Transformed (FFT) data, extracted from the time-recorded signals.
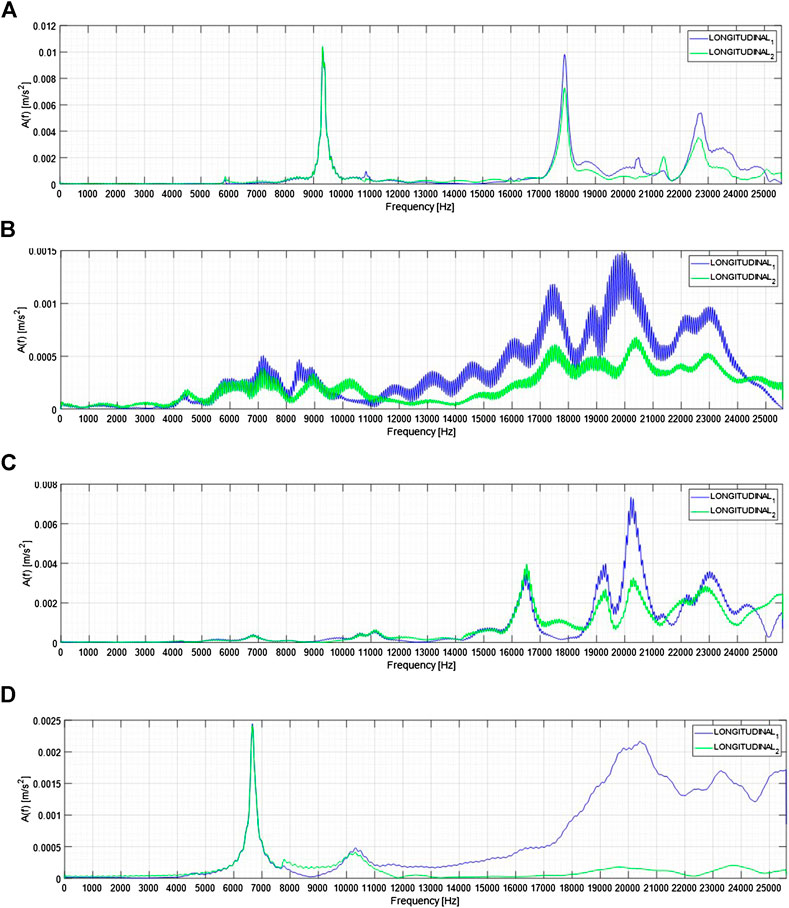
FIGURE 6. Longitudinal natural frequencies of standard concrete and metaconcrete specimens (A) S0–standard concrete; (B) S1–36 type 1 inclusions; (C) S2–36 type 2 inclusions; (D) S3–18 type 1 inclusions +18 type 2 inclusions.
For each specimen and for each swept-sine excitation applied, eight measurements were recorded, four on each basis. Test 1 and test 2 refer to tests conducted along two different diameters, either on bottom or on top surfaces of the specimen. The time-domain acceleration histories recorded at the basis opposite to the vibration speaker have been labeled “direct wave” DW, the ones recorded at the basis where the vibration speaker was applied were labeled “reflected wave” RW.
Acquired data were stored in sequential files and post-processed accurately. The accelerations signals, obtained by multiplying the electric signals by the piezoelectric transducers sensitivity s = 10/9.81 mV s2/m, are characterized by a zero average value. Figure 7 shows examples of the time-recorded signals. Figure 7A,B refer to the S0 plane concrete specimen, while Figure 7C,D refer to the S2 specimen. Figure 7A,C report the DW signals, while Figure 7B,D document the RW signals.
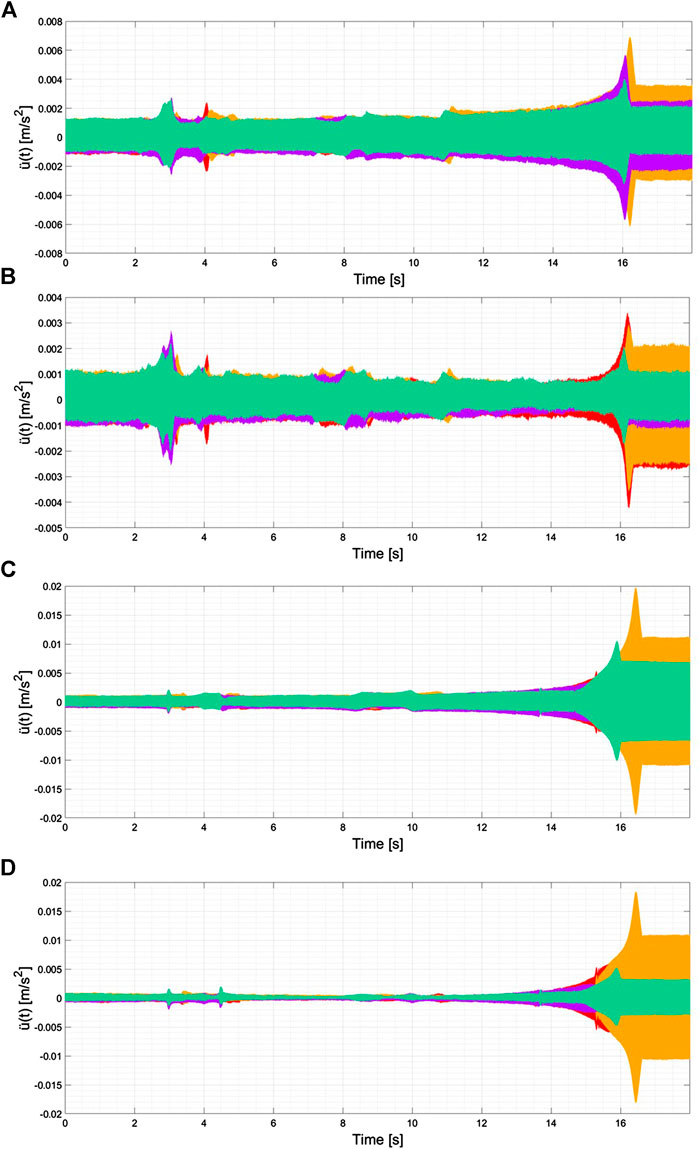
FIGURE 7. Time recorded signals (A) S0–standard concrete DW; (B) S0–standard concrete RW; (C) S2–36 type 2 inclusions DW; (D) S2–36 type 2 inclusions RW. In red DW1-RW1, in yellow DW2-W2, in green DW3-RW3 and in purple DW4-RW4.
The spikes clearly emerging, for all the specimens, at about 16 s from the beginning of the recoding are related to the transversal natural frequency. The location of the spikes is not affected by the presence of the engineered inclusions.
Peaks recorded by the different transducers (sites A and B for the test 1; sites E and F for the test 2) are reached at the same time. Measurements associated to test 1 and test 2 are characterized by a small time lag, due to the manual trigger of recordings. The time shift, however, is not significant in analyzing the signal in terms of frequency components. Finally, the initial and final portions of the recordings represent a constant sine wave, with a frequency equal to
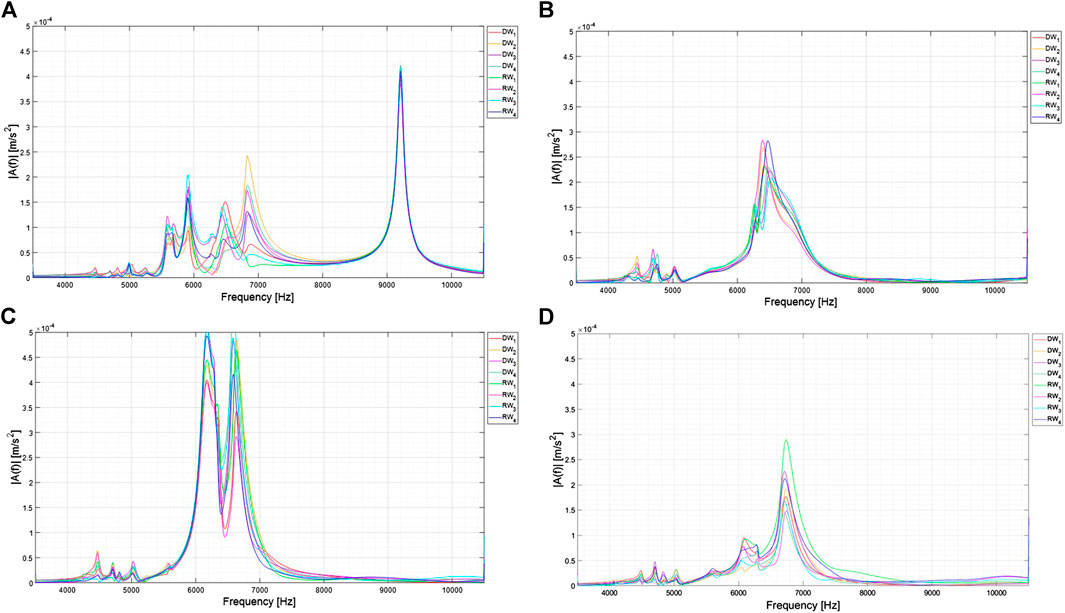
FIGURE 8. Linear frequency spectrum within the frequency range 3,500÷10,500 Hz (A) S0 - standard concrete (B) S1 - 36 type 1 inclusions; (C) S2 - 36 type 2 inclusions; (D) S3 - 18 type 1 inclusions +18 type 2 inclusion specimen.
Frequency spectra were used to compute the transmissibility ratio, a coefficient that measures the magnitude of the signal attenuation of the metaconcrete specimens (labeled PC) with respect to the signal attenuation of the plain concrete specimen used as a reference (labeled P1) under a dynamic load. The transmissibility is a dimensionless quantity computed as
where
In order to improve the readability of the plots and to facilitate the comparison among the results of different specimens, a moving average smoothing procedure was applied to each transmissibility function. The smoothing process was calibrated by means of several steps, by incrementing the smoothing interval by 1 Hz, verifying the preservation of the outcomes of experimental data.
According to the definition, the transmissibility of plain concrete appears in all the diagrams as an horizontal line at 0 dB. The response of the metaconcrete specimens in terms of transmissibility measured in linear swept-sine excitations along the longitudinal axis is visualized in Figure 9A–E for DW signals and in Figure 9B–F for RW signals.
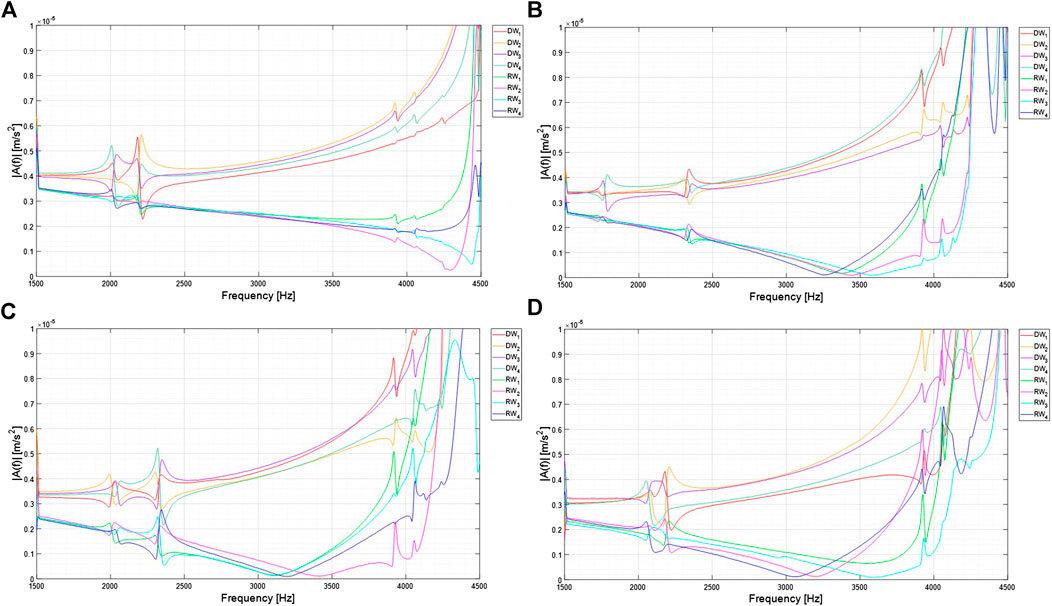
FIGURE 9. FFT of time recorded signals of swept-sine excitation within the interval 3,500–10,500 Hz in standard concrete and metaconcrete specimens. (A) S0–standard concrete; (B) S1–36 type 1 inclusions; (C) S2–36 type 2 inclusions; (D) S3–18 type 1 inclusions +18 type 2 inclusions.
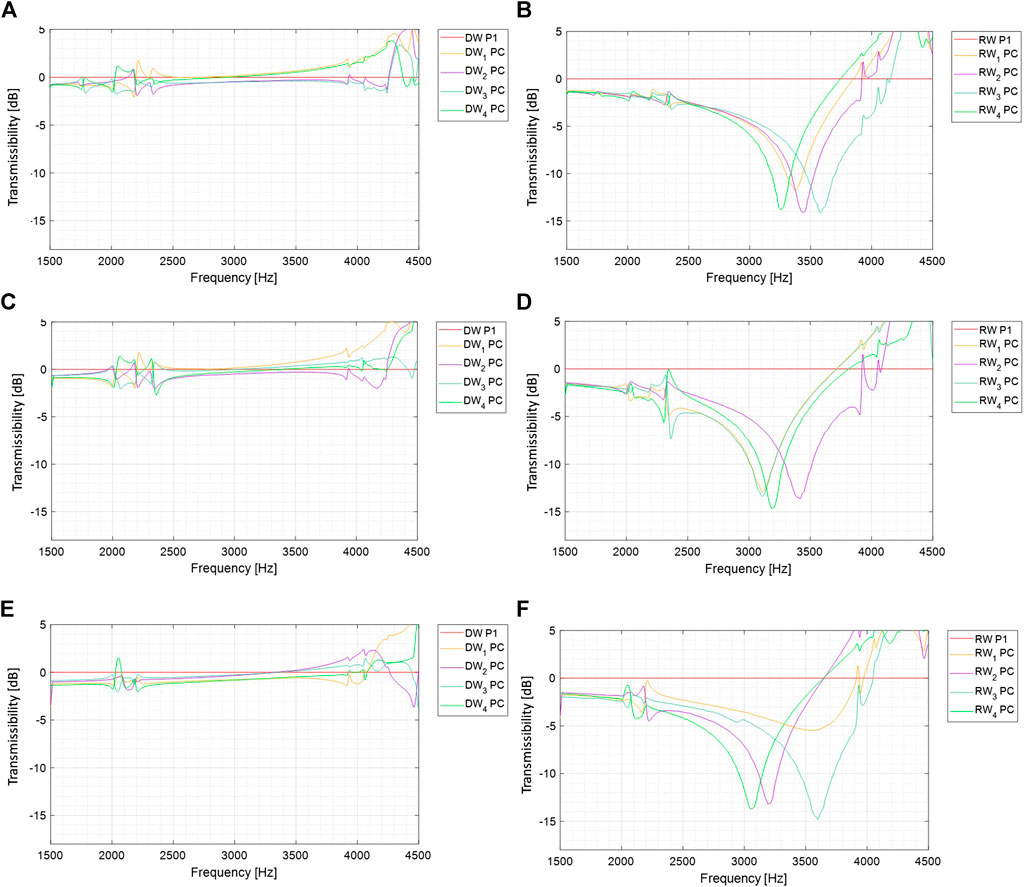
FIGURE 10. Transmissibility of metaconcrete specimens compared to that of standard concrete within the interval 1,500÷4,500 Hz (A) S0-S1 DW transmissibility; (B) S0-S1 RW transmissibility; (C) S0-S2 DW transmissibility; (D) S0-S2 RW transmissibility; (E) S0-S3 DW transmissibility; (F) S0-S3 RW transmissibility.
4 Discussion
The experimental campaign here presented was designed to quantify the attenuation properties of metaconcrete with reference to dynamic waves in the sonic range, considering two types of inclusions, cast in the same mortar matrix using different combinations but equal mass fraction. The inclusions alter the propagation of the waves in the metaconcrete, causing several phenomena that emerge in the test response spectra, according to the exciting frequency.
The comparison between plain concrete and metaconcrete specimens is efficiently done in terms of two parameters, i.e., the frequency spectrum amplitude and the transmissibility coefficient.
The results of the preliminary hammer tests, used to characterize the transversal and longitudinal eigenfrequencies of the specimens, are confirmed by the FFT plots of the dynamic excitation tests for signals covering the frequency interval 3,500÷10,500 Hz, Figure 8. The inclusion of engineered aggregates in the matrix has a double effect: a shift of the specimen longitudinal natural frequency toward lower values and a reduction of the amplitude of the recorded signals, see Figure 7.
Figure 9 reveals the presence of signal alterations at 2,000 Hz and 4,000 Hz for all the specimens. These perturbations must be associated to the specific experimental setup, or to other eigenfrequencies of the specimen, not observed during the preliminary tests. In the interval 4,000÷6,000 Hz, all signals show amplifications in the amplitude, directly associated to the specimen transversal eigenfrequency. Regrettably, the transversal frequency falls in proximity of the higher inclusion eigenfrequencies (associated to the coating deformations) and masks the eventual beneficial effects of these modes. This observations suggest that, in order to investigate the relevance of then higher natural frequencies of the inclusions, a specimen of different size should be considered.
Interestingly, when the signal frequency approaches the longitudinal natural frequencies of the specimens, the amplitudes of the eight signals (corresponding to the eight locations of the transducers) overlap, while they remain very well separated at lower frequencies. In all spectra, the amplitude of the DW signals remains always greater than the amplitude of the RW signal. Figure 8 shows clearly that the DW and RW frequency spectra for plain concrete specimen (S0) do not have any reduction in the amplitude. Significant reductions in the amplitudes are visible in the RW signals of the metaconcrete specimens in the frequency interval 1,500÷4,000 Hz. The attenuations occur at frequencies slightly higher than the numerically computed inclusion eigenfrequencies. Furthermore, experimental results show that the minimum of the signals occurs always within a narrow neighborhood of the theoretical eigenfrequencies, suggesting the presence of an interference between the wavefront and the material interfaces present in the inclusions, as also noted in Hirsekorn et al. (2006) and Mitchell et al. (2015). In an infinite periodic medium where wave dispersion is observed, attenuations occur within the frequency interval
For the metaconcrete specimens, RW diagrams reveal significant attenuations in the frequency range 3,000 ÷ 3,700 Hz, in proximity of the inclusion eigenfrequencies, see Table 3. The attenuation occurs at the beginning of the interval for the type 1 inclusion specimen and at the end of the interval for the type 2 inclusion specimen, while the attenuation for the specimen with mixed inclusions involves the entire interval.
The discrepancy observed for the onset of the attenuation phenomenon in various specimens can be analyzed in terms of relative position between the accelerometers, stuck on the bases of the metaconcrete specimens, and the pseudo-aligned columns of the inclusions. The location of the accelerometers is visualized in Figure 11A–C for the metaconcrete specimens S1, S2, and S3, respectively. The four accelerometers are identified with a color code, used to plot the FFT curves in Figures 8, 9. In reason of the quasi-regular arrangement of the aggregates, the ordered sequence of inclusions crossed by the signal–thought as a planar wave propagating from one end to the other end of the specimen–is the same for the three specimens and for the four transducers. The lack of correlation between transducer position and RW signal suggests that the attenuation occurs with uniformity over the cross section of the specimen, with no privilege for a particular position, and it occurs within a few layers of inclusions. Therefore, the onset of the attenuation must be associated only to the materials of the inclusions, although the present measurements are not able to justify the quantitative shift of frequency attenuation onset.
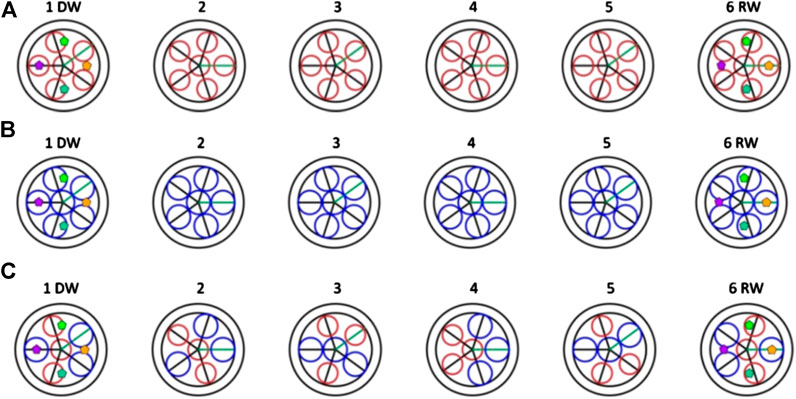
FIGURE 11. Position of the accelerometers on bottom and top basis (from left to right) (A) S1 36 type 2 inclusions; (B) S2–36 type 2 inclusions; (C) S3–18 type 1 inclusions +18 type 2 inclusions. In red type 1 inclusions, in blue type 2 inclusions.
For each metaconcrete specimen, an estimate of the frequency bandgap limits is reported in Table 2 and visualized in Figure 12A. For the two specimens S1 and S2, the bandgap limits corresponding to the minima of the transmissibility coefficient (approximately −15dB) are remarkably close to the values estimated with the expression proposed in Mitchell (2016) holding for a one-dimensional model. Small differences can be associated to the three-dimensionality of the problem at hand.
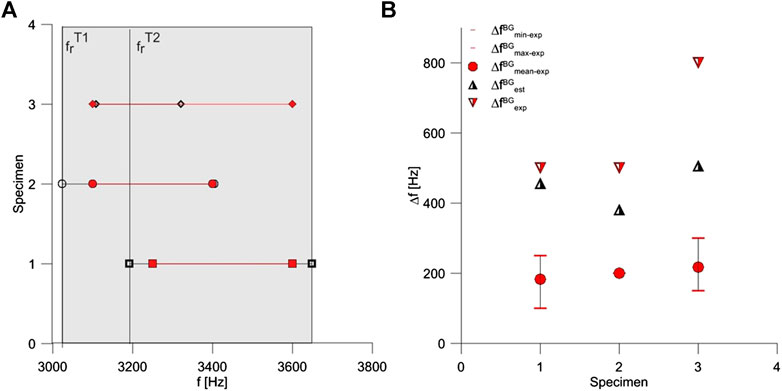
FIGURE 12. (A) Visualization of the measured (red) and estimated (black) limits of the frequency bandgap for specimens S1, S2 and S3. Measured limits correspond to the frequency at which the extremal values of transmissibility are recorded (approximately −15dB). The resonant frequency of the aggregates coincides always with the lower bandgap limit. For specimen S3, the lower limit of the estimated bandgap has been evaluated as the mean between type 1 and type 2 inclusion resonant frequency; (B) Visualization of the frequency bandgap amplitude obtained experimentally (red) and algebraically (black). Circles denote the mean amplitude derived for a −10dB transmissibility target. Triangles denote the amplitude estimated algebraically (black) and experimentally (red) considering the limits corresponding to the frequency at which the extremal values of transmissibility are recorded (approximately −15dB). Values are evaluated on the basis of three curves only.
For the specimen S3, the upper limit of the bandgap has been estimated as
where
In this case, the difference between estimated and measured frequency bandgap amplitude is not negligible, and it reflects either a rough estimate of the expected bandgap or an interference effect associated to the presence of two types of resonant inclusions.
Figure 12B illustrates an alternative measure of the bandgap amplitude. For each specimen, lower and upper bandgap limits have been estimated as the frequencies corresponding to a −10dB transmissibility. Since for the specimen S3 one transducer does not reach the −10dB target, average values over three curves have been considered. Figure 12B shows clearly that the bandgap amplitude depends on the type of inclusion considered. By comparing specimen S1 (type 1 inclusions) and S3 (two types inclusions), that have very similar aggregate mass fraction (≈−5% difference), one can notice that the bandgap amplitude is wider in the S3 case (≈+20% difference). This observation confirms the findings of Sugino et al. (2017): a non-uniform spatial distribution of resonators, reflected in specimen S3 by the presence of two types of inclusions, can scatter the location of the bandgap upper limit.
As a common feature of the three metaconcrete specimens, already pointed out in Briccola et al. (2020), no significant amplitude reduction is observed in the FFT of DW signals. The most plausible explanation for this behavior resides in the low energy content of the applied signal, generating a wavefront unable to trigger the resonance of the inclusions at the deepest levels. The low-energy propagation front may interact with the external surfaces of the specimen, in an intricate way, also due to presence of the inclusions. Further potential energy sinks are associated to specific features of the experimental apparatus. The input wave experiences a progressive loss of energy along the specimen length, and the reduced energy content is not able to activate the resonance of the inclusions. Specifically, the DW signal does not feel the inclusion eigenfrequencies.
The transmissibility plots of the RW signals clearly show the attenuation properties of metaconcrete. The transmissibility ratio is a very reliable measure of the attenuation in the frequency intervals far from the eigenfrequencies of the entire specimen. The measure compares the behavior of the metaconcrete with respect to the behavior of the plain concrete, which differ markedly only far from the natural frequencies of the specimens. Hammer tests have revealed that natural frequencies of the metaconcrete specimens are close to the ones of the plain concrete specimen, making impossible to distinguish between the two materials in the natural frequency intervals, and invalidating the meaning of the transmissibility ratio. To overcome the interference of the dynamic tests with the natural frequencies of the specimen, the size of the cylinders should be designed to locate the natural frequency of the specimen well far away from the eigenfrequencies of the inclusions.
With respect to plain concrete, experiments quantify the reduction of the amplitude of the acceleration signal in 80÷90%. The beneficial behavior of metaconcrete is observed, in particular, for excitation frequencies close to the inclusion eigenfrequencies associated to the translation of the core. The explored range of experimental frequencies (sonic range) overlaps only the low eigenfrequencies of the inclusions, and no observations are available, from the present experiments, on the attenuation induced by the coating deformation mode eigenfrequencies.
The analysis of the frequency spectrum of each recorded signal, as well as the comparison with the natural frequencies of specimen and inclusions, confirm the results of previous experimental and numerical studies on metaconcrete.
The main results of the present study are the following:
1. The attenuation properties are affected by the composition of the inclusions in terms of frequency band targeted. The attenuation band can be translated by tuning the geometry and the material of the coating. As matter of fact, even with a modest change in the coating thickness and elastic modulus of the inclusions does influence significantly the onset of the attenuation bands.
2. The quantification of the attenuation (i.e., reduction of the amplitude of the transmitted signal) cannot be related to the particular composition of the inclusion. The level of the attenuation of metaconcrete is independent on the type of inclusions, about -15 dB for each metaconcrete RW diagram. The present results suggest that the magnitude of the attenuation is probably driven by the aggregate mass fraction, which is practically the same for all the metaconcrte specimens considered here.
3. A combination of different types of engineered aggregates within the matrix can enhance the attenuation capabilities of the metaconcrete, by widening the interval where a decrement of signal amplitude occurs. The adoption of different types of inclusions is a very promising approach, probably more effective and less expensive than using multiple layer local resonators Barnhart et al. (2019).
To clarify the aspects of the behavior of metaconcrete not emerged form the present study, i.e., to ensure the excitation of the deepest inclusions by the wavefront, to assess the attenuation properties associated with the coating deformation modes, and to acquire sensitivity on the magnitude of the attenuation effects, new tests should be carried out, by modifying boundary conditions, specimen size, and driving circuit. Furthermore, to promote the activation of the rotational mode of the inclusion, associated to the lowest eigenfrequency, a non-spherical shape should be adopted for the inclusion, see Wang et al. (2004b); Hirsekorn et al. (2006), to achieve a rotational mode attenuation under the action of unidirectional dynamic excitation.
Data Availability Statement
The raw data supporting the conclusions of this article will be made available by the authors, without undue reservation.
Author Contributions
DB planned the experimental program and wrote the paper. AP supervised the research and revised the paper.
Conflict of Interest
The author declares that the research was conducted in the absence of any commercial or financial relationships that could be construed as a potential conflict of interest.
Acknowledgments
Isopren S. r.l. is gratefully acknowledged for providing the type 2 inclusions used in metaconcrete specimens.
References
An, X., Fan, H., and Zhang, C. (2018). Elastic wave and vibration bandgaps in two-dimensional acoustic metamaterials with resonators and disorders. Wave Motion. 80, 69–81. doi:10.1016/j.wavemoti.2018.04.002
ASTM (2008). Standard test method for fundamental transverse, longitudinal, and torsional resonant frequencies of concrete specimens. Annual book of ASTM standards, 7.
Barnhart, M. V., Xu, X., Chen, Y., Zhang, S., Song, J., and Huang, G. (2019). Experimental demonstration of a dissipative multi-resonator metamaterial for broadband elastic wave attenuation. J. Sound Vib. 438, 1–12. doi:10.1016/j.jsv.2018.08.035
Bonanomi, L., Theocharis, G., and Daraio, C. (2015). Wave propagation in granular chains with local resonances. Phys. Rev. E–Stat. Nonlinear Soft Matter Phys. 91, 033208. doi:10.1103/PhysRevE.91.033208
Briccola, D., Cuni, M., De Juli, A., and Pandolfi, A. (2020). Experimental validation of the attenuation properties in the sonic range of metaconcrete containing two types of resonant inclusions. Exp. Mech. doi:10.1007/s11340-020-00668-4
Briccola, D., Ortiz, M., and Pandolfi, A. (2017). Experimental validation of metaconcrete blast mitigation properties. J. Appl. Mech. 84, 031001. doi:10.1115/1.4035259
Briccola, D., Tomasin, M., Netti, T., and Pandolfi, A. (2019). The influence of a lattice-like pattern of inclusions on the attenuation properties of metaconcrete. Front. Mater. 6, 35. doi:10.3389/fmats.2019.00035
C192 (2016). Astm c192/c192m—16a standard practice for making and curing concrete test specimens in the laboratory. ASTM Standard Book, 4–9.
Gloth, G., and Sinapius, M. (2004). Analysis of swept-sine runs during modal identification. Mech. Syst. Signal Process. 18, 1421–1441. doi:10.1016/S0888-3270(03)00087-6
Goffaux, C., and Sánchez-Dehesa, J. (2003). Two-dimensional phononic crystals studied using a variational method: application to lattices of locally resonant materials. Phys. Rev. B. 67, 144301. doi:10.1103/PhysRevB.67.144301
Hirsekorn, M., Delsanto, P. P., Leung, A. C., and Matic, P. (2006). Elastic wave propagation in locally resonant sonic material: comparison between local interaction simulation approach and modal analysis. J. Appl. Phys. 99, 124912. doi:10.1063/1.2208528
Hirsekorn, M. (2004). Small-size sonic crystals with strong attenuation bands in the audible frequency range. Appl. Phys. Lett. 84, 3364–3366. doi:10.1063/1.1781372
Khan, M., Li, B., and Tan, K. (2018). Impact load wave transmission in elastic metamaterials. Int. J. Impact Eng. 118, 50–59. doi:10.1016/j.ijimpeng.2018.04.004
Liu, Z., Zhang, X., Mao, Y., Zhu, Y. Y., Yang, Z., Chan, C. T., et al. (2000). Locally resonant sonic materials. Science. 289, 1734–2610. doi:1126/science.289.5485.1734
Miranda, E., Angelin, A., Silva, F., and Dos Santos, J. (2019). Passive vibration control using a metaconcrete thin plate. Cerâmica. 65, 27–33. doi:10.1590/0366-6913201965s12597
Mitchell, S. J., Pandolfi, A., and Ortiz, M. (2016). Effect of brittle fracture in a metaconcrete slab under shock loading. J. Eng. Mech. 142. doi:10.1061/(ASCE)EM.1943-7889.0001034
Mitchell, S. J., Pandolfi, A., and Ortiz, M. (2015). Investigation of elastic wave transmission in a metaconcrete slab. Mech. Mater. 91, 295–303. doi:10.1016/j.mechmat.2015.08.004
Mitchell, S. J., Pandolfi, A., and Ortiz, M. (2014). Metaconcrete: designed aggregates to enhance dynamic performance. J. Mech. Phys. Solid. 65, 69–81. doi:10.1016/j.jmps.2014.01.003
Mitchell, S. J. (2016). PhD thesis. Metaconcrete: engineered aggregates for enhanced dynamic performance. California (CA): California Institute of Technology.
Pandolfi, A., and Ortiz, M. (2012). An eigenerosion approach to brittle fracture. Int. J. Numer. Methods Eng. 92, 694–714. doi:10.1002/nme.4352
Sheng, P., Zhang, X. X., Liu, Z., and Chan, C. T. (2003). Locally resonant sonic materials. Phys. B Condens. Matter. 338, 201–205. doi:10.1016/S0921-4526(03)00487-3
Sugino, C., Xia, Y., Leadenham, S., Ruzzene, M., and Erturk, A. (2017). A general theory for bandgap estimation in locally resonant metastructures. J. Sound Vib. 406, 104–123. doi:10.1016/j.jsv.2017.06.004
Tan, S. H., and Poh, L. H. (2020). Enriched homogenized model for viscoelastic plane wave propagation in periodic layered composites. Adv. Model. Simul. Eng. Sci. 7, 1–29. doi:10.1186/s40323-020-0143-x
Wang, C., Liu, Z., Gao, L., Xu, D., and Zhuang, Z. (2017). Analytical and numerical modeling on resonant response of particles in polymer matrix under blast wave. Comput. Mater. Sci. 140, 70–81. doi:10.1016/j.commatsci.2017.08.034
Wang, G., Wen, X., Wen, J., Shao, L., and Liu, Y. (2004b). Two-dimensional locally resonant phononic crystals with binary structures. Phys. Rev. Lett. 93, 154302. doi:10.1103/PhysRevLett.93.154302
Wang, G., Wen, J., Liu, Y., and Wen, X. (2004a). Lumped-mass method for the study of band structure in two-dimensional phononic crystals. Phys. Rev. B. 69, 184302. doi:10.7498/aps.54.1247
Wang, G., Yu, D., Wen, J., Liu, Y., and Wen, X. (2004c). One-dimensional phononic crystals with locally resonant structures. Phys. Lett. 327, 512–521. doi:10.1016/j.physleta.2004.05.047
Keywords: metaconcrete, non-homogeneous inclusions, linear swept-frequency sinusoidal excitation, signal attenuation, sonic range, transmissibility
Citation: Briccola D and Pandolfi A (2021) Analysis on the Dynamic Wave Attenuation Properties of Metaconcrete Considering a Quasi-Random Arrangement of Inclusions. Front. Mater. 7:615189. doi: 10.3389/fmats.2020.615189
Received: 08 October 2020; Accepted: 16 December 2020;
Published: 20 January 2021.
Edited by:
Maria Laura De Bellis, University of Studies G. d’Annunzio Chieti and Pescara, ItalyReviewed by:
Marco Miniaci, Swiss Federal Laboratories for Materials Science and Technology, SwitzerlandAnna Reggio, Politecnico di Torino, Italy
Copyright © 2021 Briccola and Pandolfi. This is an open-access article distributed under the terms of the Creative Commons Attribution License (CC BY). The use, distribution or reproduction in other forums is permitted, provided the original author(s) and the copyright owner(s) are credited and that the original publication in this journal is cited, in accordance with accepted academic practice. No use, distribution or reproduction is permitted which does not comply with these terms.
*Correspondence: Anna Pandolfi, YW5uYS5wYW5kb2xmaUBwb2xpbWkuaXQ=