 Zuqian Jiang
 Liwen Zhang
 Junping Zhang
 Zhuo Sun
 Jing Li
- School of Civil Engineering, Guangzhou University, Guangzhou, China
Magnesium phosphate cement (MPC), as a new type of inorganic cementitious material, has the advantages of fast curing speed and high early strength. However, MPC still exhibits poor toughness similar to other cementitious materials. Coconut fiber (CF), a renewable plant fiber, was found to have the potential to improve the toughness of MPC in our previous research. As a result, further research should be completed to investigate the mechanical behaviors of MPC mixed with CF. This paper focused on the effect of CF volume dosage on MPC’s flexural performances. Flexural strength, load-deflection (L-D) relationship, fractural patterns, and flexural toughness were obtained by carrying out a three-point bending test. The results showed that flexural strength first increased and then decreased with increasing CF dosage, and the optimal CF dosage for flexural strength was 3%. Besides, it could be observed from the L-D relationship that the toughness increased continuously with increasing CF dosage. Additionally, the technique of scanning electron microscopy (SEM) was employed to analyze the microstructure of MPC mixed with different CF dosages.
1 Introduction
Magnesium phosphate cement (MPC), also known as a chemical binding ceramic (Roy, 1987; Li et al., 2017), is a new type of inorganic cementitious material, which consists of alkali phosphate salt, dead burnt magnesium oxide, and admixtures. Due to advantages of high early strength, fast setting time, large bond strength, and good durability (Sarkar, 1991; Seehra et al., 1993; Abdelrazig et al., 1988; Yang et al., 2000; Deng, 2003; Ding and Li, 2005; Fan and Chen, 2014), MPC is widely applied in the rapid repair works of deficient concrete structures, for example, roads, bridges, airport runways, and military projects (Jiang and Zhang, 2001; Qiao et al., 2010; Deng et al., 2011; Ding et al., 2014). However, MPC still has drawbacks including poor toughness and easy cracking, just like other typical cementitious materials. This is because the ionic bonds and covalent bonds in MPC have strong directionality, which are hard to distort and misplace. The energy is hard to release through the misalignment of atoms or ions under loading, which lead to the prominent brittleness of MPC (Sarkar, 1990). As a result, secondary damage to repaired concrete structures under short-term repeated load easily occurs. Existing research has shown that the brittleness and toughness of MPC can be improved by adding fibers. Ahmad and Chen (2018) found that basalt fibers could effectively improve the flexural strength of MPC. Feng et al. (2018) found that micro steel fiber prompted the failure modes of MPC to change from brittle failure to ductile failure, and improved its flexural toughness. Fang et al. (2018) found that the flexural strength of MPC first increased and then decreased with increasing glass fiber dosage. When the volume dosage of glass fiber increased to 2.5%, MPC had the maximum flexural strength of 17.2 MPa. Additionally, the incorporation of glass fiber could also effectively improve its flexural toughness. Although the fibers mentioned above can improve the brittleness and toughness of MPC, the larger energy consumption and carbon emissions produced in their manufacturing process pose new problems to environmental protection. As a result, it is valuable to find renewable resources to improve the properties of MPC.
Coconut fiber (CF), a green and sustainable natural plant fiber, is obtained from waste coconut shells after a series of treatments. Compared with those environmentally unfriendly fibers, coconut fiber has the advantages of low cost, renewability, etc., and shows high toughness and outstanding mechanical properties (Paul and Thomas, 1997; Lecompte et al., 2015). Reis (2006) found that coconut fiber-reinforced concrete (CFRC) had greater flexural strength than other natural fiber-reinforced concrete. Thanushan et al. (2019) demonstrated that CF could greatly improve the residual strength, ductility, flexural toughness, and energy absorption of concrete. The research of Islam et al. (2012) showed that adding 0.5% CF could increase the flexural strength of concrete by 60%. Besides the flexural strength, ductility and toughness were also improved significantly when CF was added. As a result, it is possible to overcome the drawbacks (poor toughness and easy-cracking) of MPC by adding CF. However, most existing studies focused on the effect of CF on common concrete or other fibers on MPC. Few studies were conducted aiming at the effects of CF on MPC. Accordingly, a specific study is necessary for understanding the mechanical properties of CF-MPC.
In this paper, a series of three-point bending tests were carried out to investigate the effect of CF volume dosage on the flexural performances of MPC including failure patterns, flexural strength, secant stiffness, load-displacement relationship, and flexural toughness. Additionally, the microstructures of MPC were analyzed by scanning electron microscopy (SEM) in order to explain the mechanism.
2 Experimental Programs
2.1 Material Properties
A mixture of basic MPC comprised of dead burned magnesium oxide (MgO), potassium dihydrogen phosphate (KH2PO4), fly ash (FA), borax (Na2B4O7⋅10H2O), and water according to the following mix proportion: MgO-KH2PO4-FA mass ratio of 1:0.68:0.25; water-binder (MgO + KH2PO4+ FA) ratio of 15:100; and borax-MgO mass ratio of 10:100. Five MPC mixtures were prepared with different CF volume dosages (Vf), which are summarized in Table 1. Dead burned magnesia powder (calcined at about 1,500°C for 6 h) was supplied by the Zhengyang Casting Material Company of Xinmi, Henan, China, with a specific surface area of 228 m2/kg, a density of 2,650 kg/m3, and an average particle size of 45 µm. The chemical compositions of MgO are shown in Table 2. Fly ash conforming to ASTM C618 came from the Hengnuo Co., Ltd. of Gongyi, Henan, China, the chemical composition of which is shown in Table 3. Industrial-grade potassium dihydrogen phosphate (KH2PO4) and borax (Na2B4O7⋅10H2O), provided by the Jianghua Chemical Glass Instrument Co., Ltd. of Nanjing, Jiangsu, China, with a purity of 99.5% and particle size of 350 μm, were used in this paper. CF, produced in Sri Lanka, was sourced from the Jiagaocheng Import and Export Trade Co., Ltd. of Shangrao, Jiangxi, China, with a diameter of 150–350 μm, and density of 1,200 kg/m3. Table 4 provides a list of the physical and mechanical properties. Before being mixed in a MPC binder slurry, the CF was pre-treated with a series of processes as shown in Figure 1. Firstly, the CF was soaked and washed three times to remove its impurities. Secondly, the CF was separated and straightened with a steel comb, and placed in a drying oven to dry. Thirdly, the CF was boiled for 2 h, and then washed and dried again. At last, the CF was standardized to a length of 20 ± 0.64 mm (mean ± SD) with a ruler and scissors.
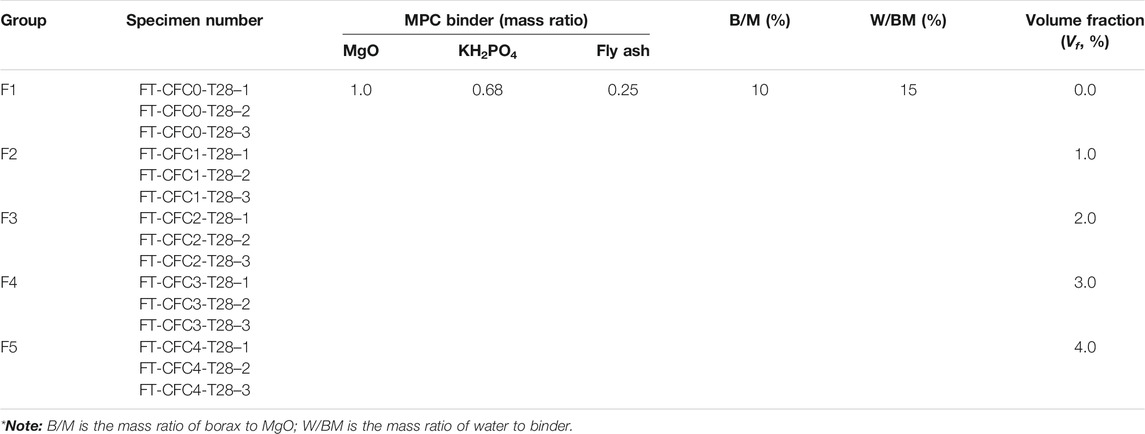
TABLE 1. Specimen parameters.
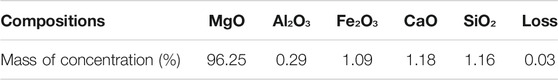
TABLE 2. Chemical composition of dead burned magnesium oxide.
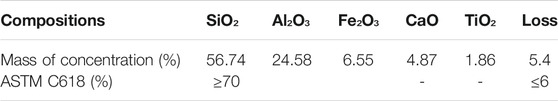
TABLE 3. Chemical composition of fly ash.

TABLE 4. Coconut fiber properties.
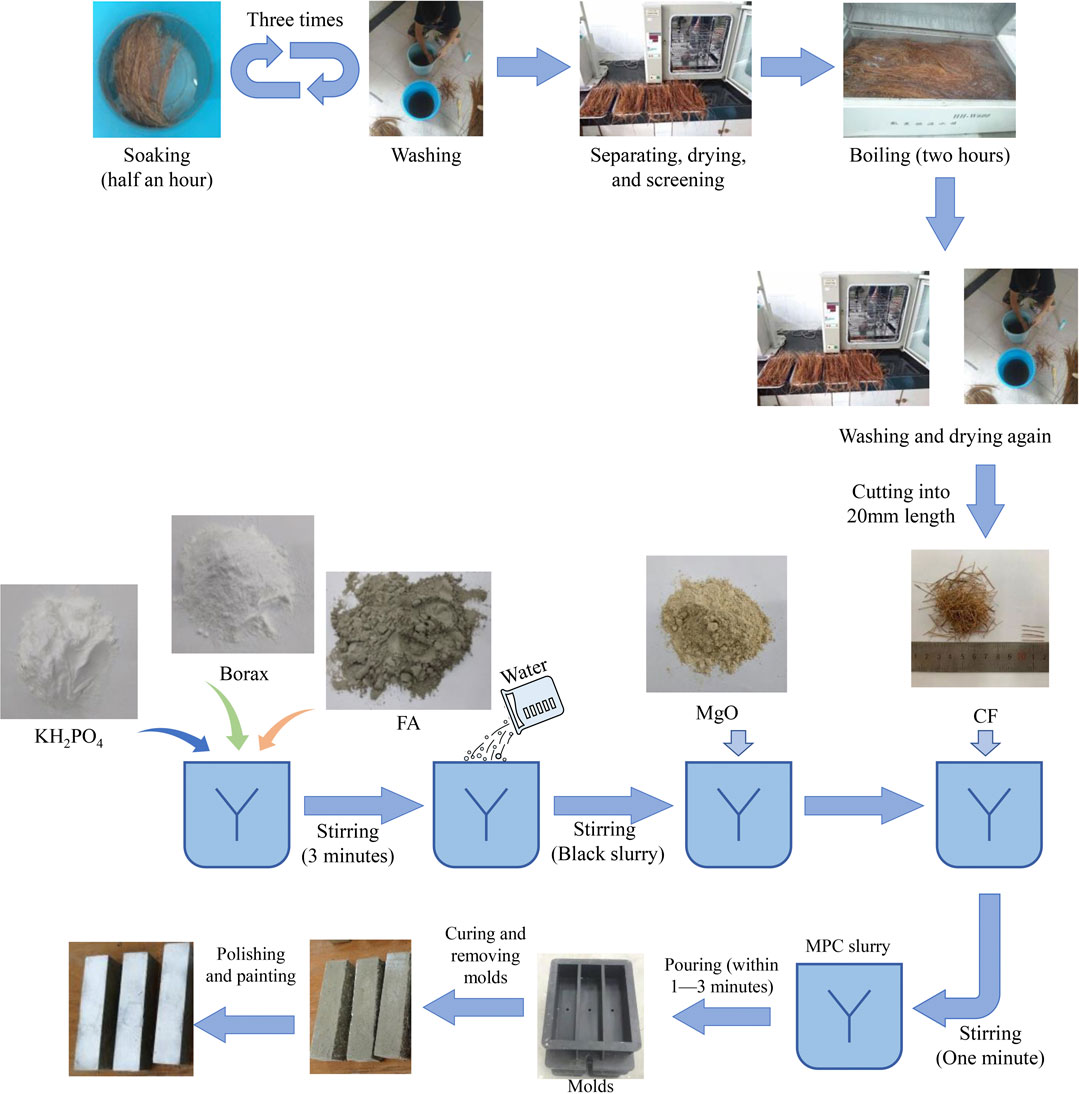
FIGURE 1. Coconut fiber (CF) treatment process and specimen preparation.
2.2 Test Specimens
A three-point bending test was used to investigate the effect of CF volume dosages (0%, 1%, 2%, 3%, 4%) on the failure patterns, flexural strength, flexural secant stiffness, load-displacement, and flexural toughness of MPC. Note that the length of the CF was defined as 20 mm in reference to most studies about fiber and cementitious material (Wang et al., 2006; Gao and Zhang, 2007). A total of fifteen specimens divided into five sets were employed, with a prism of 40 mm × 40 mm × 160 mm (Figure 2A). Each specimen was marked according to the following sequence: test method-CF volume dosage-curing age-serial number of the specimens in its set. For example, FT-CFC1-T28–1 represented the first specimen of the set with a CF volume fraction of 1% used to investigate the flexural performances at a curing age of 28 days. Table 4 displays the detailed parameters of specimens.
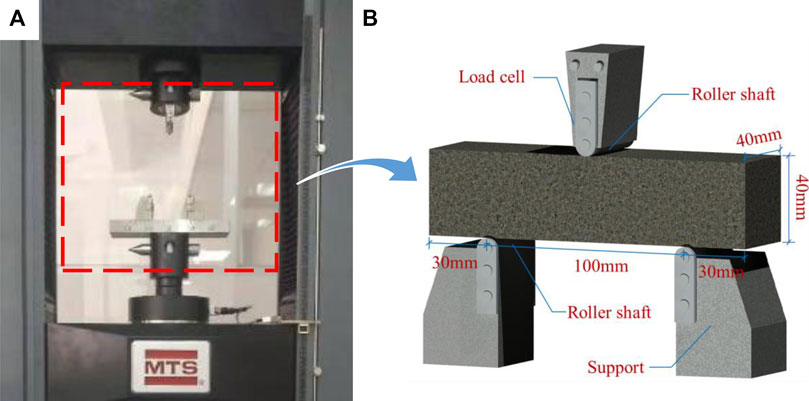
FIGURE 2. Test setup (A) test machine; (B) test setup.
As shown in Figure 1, specimens were prepared according to the following steps: firstly, MgO, KH2PO4, borax, and FA were putted into a shaft mixer and stirred at 140 ± 5 r/min for 30 s. Water was added into the mixture and stirred continuously at 140 ± 5 r/min for 30 s. Then, the CF was scattered uniformly into the mixed MPC binder slurry and agitated at 285 ± 10 r/min for 60 s. Finally, the MPC binder slurry with the CF was poured into molds within 3–4 min and the molds were vibrated for 60 s, to ensure good dispersion of the CF throughout the matrix. Specimens could be demolded after 1 h and cured in a room at an approximate relative humidity (RH) of (45 ± 5) % under (20 ± 3) °C. In order to observe cracking propagation in the test, each specimen was polished before the test and painted white, as shown in Figure 1.
2.3 Testing Methods
A three-point flexural test was conducted according to ASTM C293/C293M-16 (2016) and ASTM C1609/C1609M-10 (2010) using a universal testing machine (MTS-E45.305) with a capacity of 300 kN, as shown in Figure 2A. Each specimen was placed on two hinge supports with a span length of 100 mm, as presented in Figure 2B. In order to obtain a comparatively whole curve of load-displacement (L-D), the test was controlled by vertical displacement with a rate of 2.0 mm/min. Besides, when the loading force declined to 10% of its peak value, the specimens were considered as failed and the test was stopped (Pan et al., 2012; He et al., 2020; Zhou et al., 2020). Load-displacement curves in the midspan of specimens were recorded synchronously by sensors in the load cell.
In this paper, the flexural strength of specimens was determined according to ASTM C293/C293M-16 (2016), as shown in Eq. 1:
where fp is flexural strength (MPa); Pp is peak load (kN); b is specimen width (mm); d is specimen height (mm); and l is distance between the supports (mm). The secant stiffness of L-D curves, shown in Figure 10B, was calculated using Eq. 2:
where K is secant stiffness (kN/mm); Pp is peak load (kN), and δp is displacement at peak load (mm).
In this paper, the energy absorption of the load-displacement (L-D) curves was used to reflect the flexural toughness of CF-MPC, which could be divided into two parts according to ASTM C1609/C1609M-10 (2010) and Khan and Ali (2016). As described in Figure 3, the area filled by red diagonals, i.e., the area enclosed by the L-D curve in stage O-A was specified as effective flexural energy absorption (EFE), which meant energy absorption in the approximate elastic stage O-A; the area filled by blue diagonals was defined as residual flexural energy absorption (RFE), which represented energy absorption in the softening stage A-E; and the sum of the two areas was the total flexural energy absorption (FE) in the test, which described the flexural toughness of specimens. Additionally, δp was the displacement at peak load; δ150 was the displacement of l/150, and l was distance between the supports.
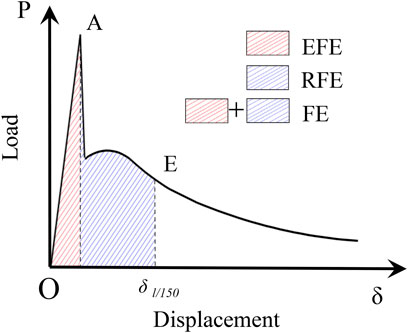
FIGURE 3. Schematic of energy absorption.
3 Results and Discussion
3.1 Failure Patterns
The specimen without coconut fiber, group F1 (Figure 4A), showed an obvious brittle failure. After a short time of loading, a crack occurred on the bottom of the specimen at mid-span and developed rapidly upward to penetrate the whole specimen. Then, the specimen was separated into two individual parts with a clear breaking sound without obvious sign. The specimen in group F1 had a relatively smooth fracture surface, just as presented in Figure 5A.
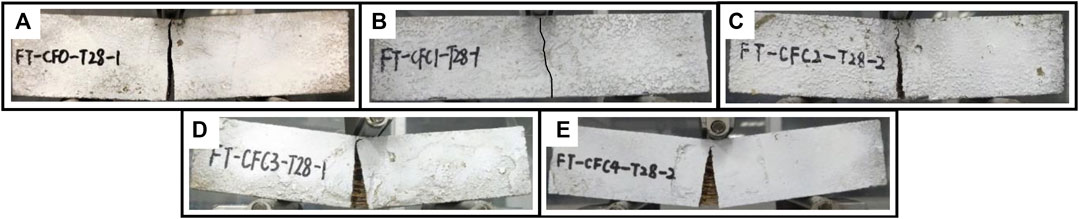
FIGURE 4. Failure patterns (A) F1; (B) F2; (C) F3; (D) F4; (E) F5.
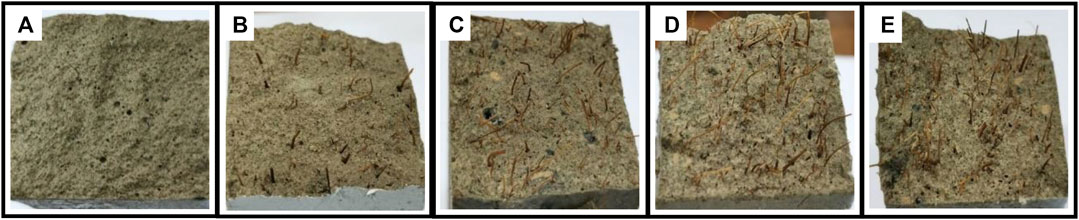
FIGURE 5. Fracture surface of specimens (A) F1; (B) F2; (C) F3; (D) F4; (E) F5.
When 1.0% CF was added to the specimen, i.e., group F2, the specimen still showed brittle failure, and a crack still developed quickly and displayed a zigzag shape (Figure 4B). However, the width of the fissure at mid-span was smaller than that of the specimen in group F1, this could be attributed to the CF located bilateral of the matrix, which restrained the extending crack. Additionally, the specimen did not break into two individual portions like the specimen in group F1. A small amount of CF could be found in the crack, which connected the two parts of the specimen.
As CF was added continuously, some initial signs of ductile failure could be observed from the specimens. When the CF increased to 2.0%, the specimen of group F3 (Figure 4C) took longer to fail compared with F1 and F2. A visible crack propagated at the top of the specimen at pace and expanded with increasing load. The sound of the CF being pulled out or ruptured could be heard in the test. More CF was found in the crack of the group F3 specimen, and the fracture surface was more uneven than the fracture surfaces of F1 and F2, as presented in Figure 5C. Group F4 and group F5 showed a similar failure mode to group F3, which is illustrated in Figures 4D,E, respectively. Moreover, a typical ductile failure could be observed from those specimens. A crack appeared with a significant deflection and eventually developed into a wider interstice when the specimens broke into two parts. Lots of CF was visible inside the crack and more CF, seen on the fracture surface, was pulled out (Figures 5D,E), leading to more ductile failure and preventing the specimens from being broken. Exceptionally, a porous surface fracture and aggregation of the CF occurred in the specimen of group F5 due to an uneven distribution of CF as shown in Figure 5E.
3.2 Flexural Strength
Figure 6A shows the flexural strength of specimens. It could be observed that flexural strength first increased and then decreased with increasing CF dose. When the CF volume dosage was 3%, flexural strength increased to the maximum value of 13.49 MPa and grew by 15.7% relative to the flexural strength of specimens without CF, as described in Figure 6B. However, flexural strength appeared to decline after CF was larger than 3%. When CF increased to 4%, flexural strength dropped to 13.21 MPa and its relative increment reduced to 13.2%.
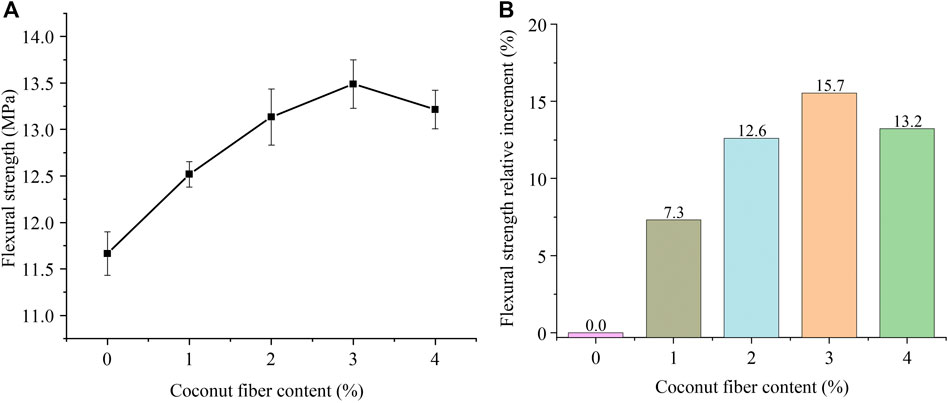
FIGURE 6. Flexural strength and relative increment (A) flexural strength; (B) flexural strength relative increment.
These observations were attributed to the following reasons: the main hydration product of the MPC binder is potassium phosphate magnesium (MgKPO4⋅6H2O) also named “K-struvite”, the dominant component providing the mechanical strength of MPC. K-struvite performs well in resisting compression but behaves poorly in resisting tension stress. Micro-cracks are prone to occur throughout MPC that is not reinforced with fiber, as shown in Figure 7A. Therefore, the ability of withstanding flexural load for MPC without fiber is less than CF-reinforced MPC. The enhancement in flexural strength may be ascribed to the "bridge effect" resulting from good dispersion of CF throughout the matrix, as depicted in Figure 8. Figure 9A offers the SEM of the CF at its interface with the MPC matrix. A rough surface and close fit of the CF with the MPC matrix could be found which resulted in a greater bonding between the CF and MPC, this helped to increase the interaction or adhesion at the matrix interface, as shown in Figure 9. This perfect bonding meant that CF could play a prominent role in hindering the extension of micro-cracks in MPC and delaying the appearance of macro-cracks, as illustrated in Figure 7. This perfect bonding performance ensured a strong connection between the CF and matrix, which provided the necessary conditions for CF to resist tensile force together with MPC. For that reason, the flexural strength of MPC was improved with the addition of CF.
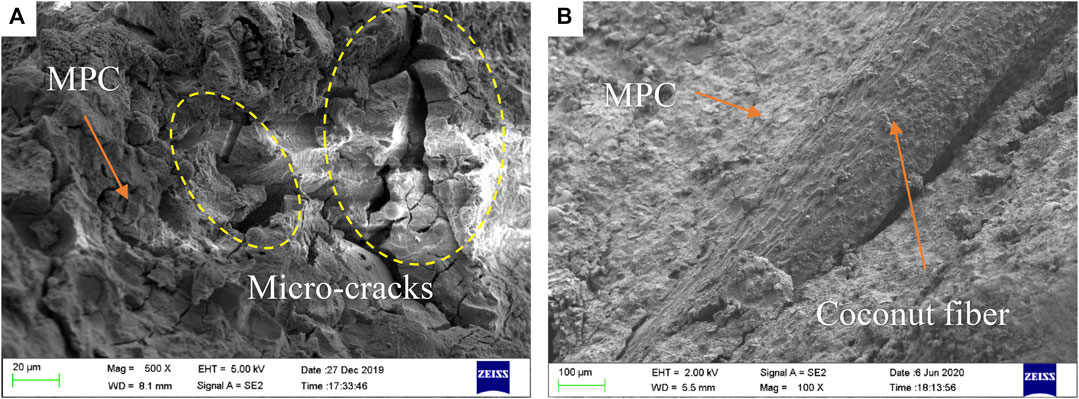
FIGURE 7. SEM of MPC (A) MPC without CF; (B) after incorporating CF.
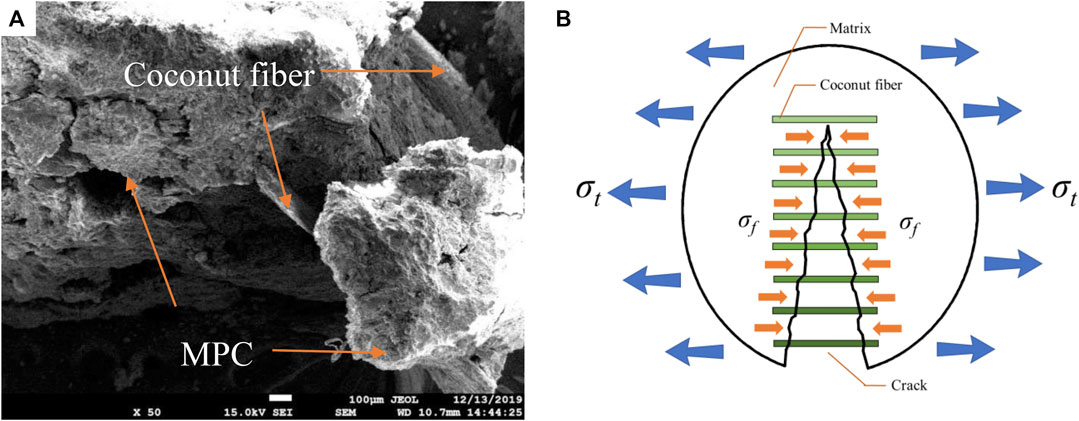
FIGURE 8. Bridge effect of CF (A) connection of CF to MPC; (B) schematic.
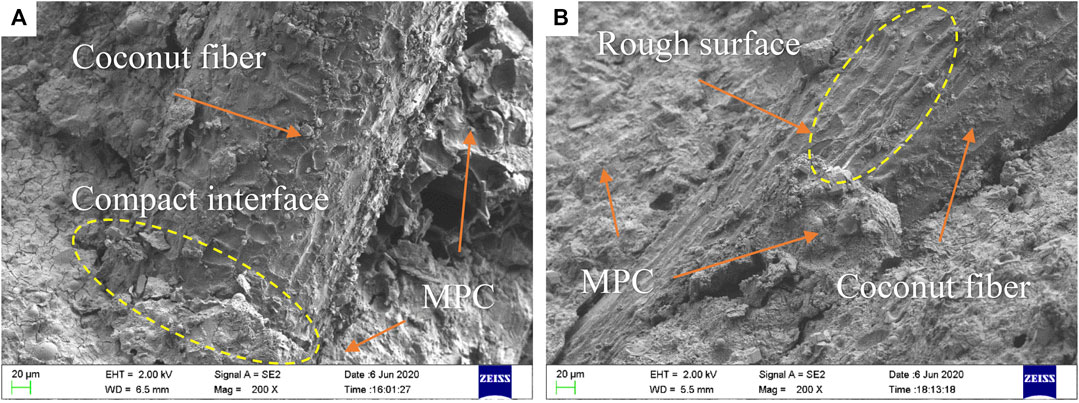
FIGURE 9. Boundary of coconut fiber and MPC (A) interface between CF and MPC; (B) rough surface of CF.
However, the flexural strength of MPC dropped from 13.49 MPa to 13.21 MPa, when excess CF (Vf ≥ 4.0%) was added to MPC in association with the agglomeration of CF. A reason for this could be: excess CF content was incorporated resulting in increased viscosity, poor dispersion, and porosity (Figure 5), which decreased the fiber bond and mechanical properties (Alomayri et al., 2013; Wu et al., 2018) such as a loose structure, as depicted in Figure 10.
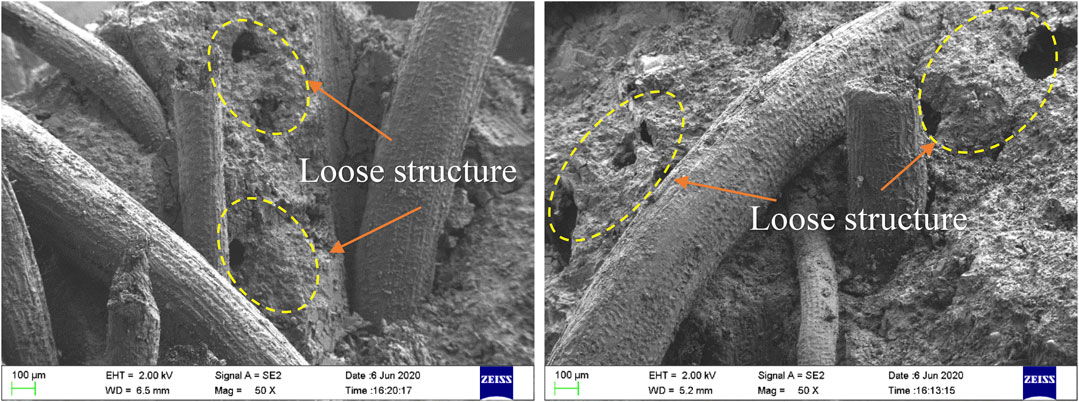
FIGURE 10. SEM results of MPC with excess CF.
3.3 Load-Displacement Relationship
Figure 11 shows the load-displacement (L-D) curves of the specimens. They could be divided into two types, as presented in Figure 12A. L-D curve type I consisted of an approximately linear ascending branch (O-A) and a softening descending branch (A-B’); type II comprised three stages including an approximate elastic stage (O-A), stable softening stage (A-B-C), and unstable softening stage (C-D).
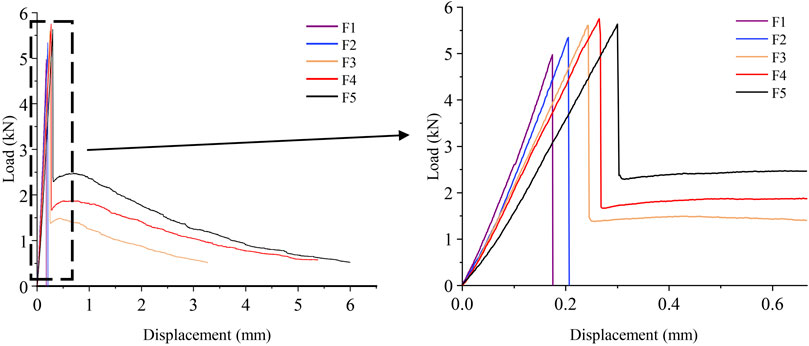
FIGURE 11. Flexural load-displacement curve and enlarged view.
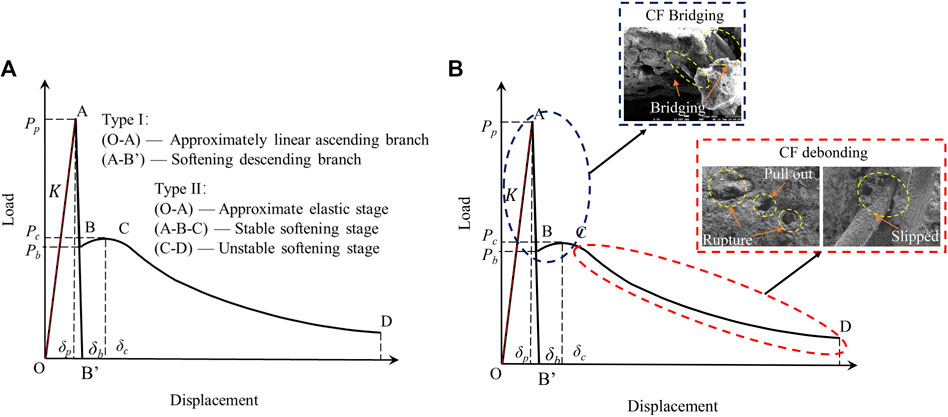
FIGURE 12. Load-displacement curve configuration and sketch of failure mechanism (A) curve configuration; (B) sketch of failure mechanism.
For specimens with CF less than 1%, their L-D curves presented the obvious configuration of type I. Curves raised approximately linearly in the O-A branch at a rapid speed and dropped sharply after peak load (point A) in the A-B’ branch. When CF was larger than 1%, specimens appeared to have L-D curves of type II. Similarly, force applied to the specimens also increased approximately linearly along O-A and then dropped to point B after point A. However, the specimens did not fail and still showed an ability to resist load. The force raised again from point B and increased until point C. Then, the force gradually dropped to point D, meanwhile, the specimens were broken. In addition to the general characteristics of the L-D curves mentioned above, each stage of the curves had different performances as the CF volume dosage varied.
For stage (O-A): in this stage, the peak load (point A) of the specimens increased with an increase of CF, and reached the maximum value of 5.76 kN when CF was 3%. Similar to that of flexural strength, however, peak load decreased to 5.64 kN with 4% CF in turn. This could be explained using the same reason described in Section 4. Figures 11, 13A offer the enlarged view of this stage and the secant stiffness of specimens in order to investigate the effect of CF on behaviors in this stage. It could be observed that the slop of curves and secant stiffness decreased with increased CF. When CF increased to 4%, secant stiffness decreased to the minimum value of 18.90 kN/mm. This decrease in secant stiffness could be illustrated using the composite material theory (Swamy, 1970). In CF-MPC, the CF had a smaller elastic modulus than MPC. The higher elastic modulus of MPC was compromised by this smaller value, which led to the elastic modulus decreasing for MPC specimens. As a result, the secant stiffness of the specimens was reduced after adding CF.
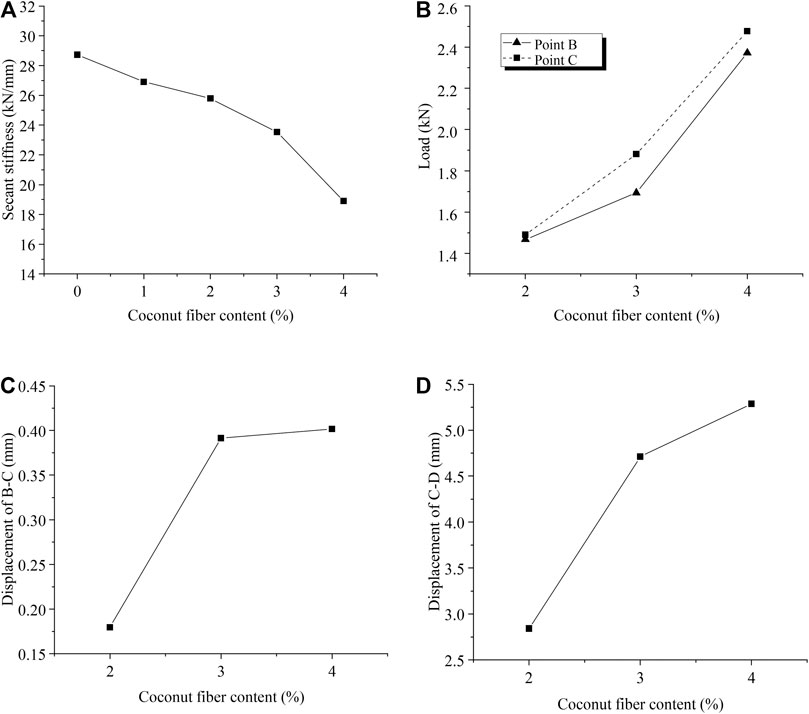
FIGURE 13. Experiment result and analysis (A) secant stiffness of O-A; (B) loading force at points B and C; (C) the displacement of B-C; (D) the displacement of C-D.
For stage (A-B-C): when specimen strain exceeded the value of which the MPC matrix could resist, internal cracks in the MPC began to expand. Cohesion of the matrix would decrease rapidly due to these cracks. Correspondingly, the L-D curves dropped rapidly after peak load due to the reduction of MPC capacity caused by the decrease of cohesion. For specimens without CF, this drop would continue to point B’ which meant the complete failure of the specimen; but for specimens with CF added, the curves ascended again and then appeared to have a longer softening stage. This phenomenon was also attributed to the “bridge effect” of fiber. When the cracks developed on the "bridge area" of CF at point B, CF connected the MPC matrix on both sides of the cracks depending on its greater bonding with MPC, which restricted the extension of the cracks, as shown in Figure 8B. Meanwhile, bond stress σf between the CF and MPC matrix produced a stress field opposite to tensile stress. The stress intensity factor of the stress field, Kf, neutralized the stress intensity factor Kt caused by tensile stress σt. Therefore, the total stress intensity factor K was reduced as expressed in Eq. 3, which resulted in the improvement of MPC matrix capacity.
In consequence, the curves raised from point B to point C. And, this improvement increased with an increase of CF. Figures 13B,C present forces at two points and the displacement of B-C, respectively. It was obvious that the forces and the displacement both increased with the increase of CF.
For stage (C-D): after loading increased to point C, the bond stress between CF and MPC, or tensile stress in CF, reached their maximum strength, and cracks developed unsteadily but the curves still showed a gradual softening stage under the effect of CF. Obvious signs of ductile failure could be observed from the curves. In this stage (C-D), the L-D curve dropped continuously and finally reached point D. The observation could be ascribed to “bridge effect” failure, the CF slipped out or was pulled out from the matrix, as described in Figure 12B, which caused a connection failure between the CF and matrix. Besides, with continuous loading, the specimen can still bear some load until the interface bonding between the CF and matrix becomes completely invalid as fibers debone and rupture. Thus, for the specimen with CF ≥ 2.0%, an obvious softening stage could be observed in the L-D curve, which represents a ductile failure process. Moreover, the capacity of withstand load in stage C-D was more significant with an increase of CF. Figure 13D presents the displacement of C-D which was used to evaluate the capacity of plastic deformation in this stage. It could be observed that the displacement of C-D increased with an increase of CF, which indicated that the plasticity of CF-MPC increased as the CF dosage increased. This was due to the “bridge effect” and the better bonding performance of CF and MPC when enough CF was added, which made the curves decrease more slowly and showed better plastic characteristics in this stage.
3.4 Flexural Toughness
Flexural toughness is used to evaluate the specimen’s capacity of energy absorption under bending loading until the specimen fails. Figure 14 shows the energy absorption mentioned in Section 2.3 (Figure 3). It was obvious that FE, i.e., the flexural toughness of specimens, increased from 400.6 N mm to 1,679.4 N mm with an increase of CF, which was improved significantly when compared with specimens without CF. These signs could ascribe that the specimens with CF require higher energy consumption before the occurrence of deboning (CF slipped out or pulled out of the matrix) between the CF and matrix, and rupture (Section 3.3; Figure 12B).
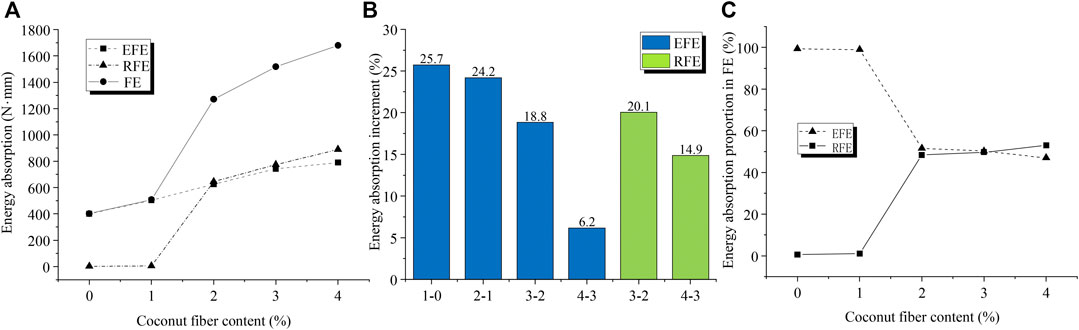
FIGURE 14. Energy absorption and flexural toughness (A) energy absorption; (B) energy absorption increment; (C) energy absorption proportion in FE (*Note:The abscissa represents the relative increment for specimens with CF of the numeral before en dash to specimens with CF of the numeral after the en dash. For example, 3-2 is the relative increment for specimens with 3% CF to specimens with 2% CF.).
Furthermore, EFE still grew as CF increased, but the growth had slowed after the CF content went over 2%. For F2, its EFE increased by 25.7% relative to the EFE of F1, from 400.6 N mm to 503.7 N mm, as illustrated in Figure 14. As for F5, its EFE relative increment to F4 reduced to 6.2%, only from 743.4 N mm to 789.4 N mm. These results demonstrate that CF plays a significant part in improving the micro-crack resistance of MPC in the elastic behavior stage. The mechanism and micrograph (Figure 7) is discussed in Section 3.2. Exceptionally, excess CF (larger than 4%) incorporation could weaken the contribution of CF in the elastic behavior stage, as shown in Figure 10.
However, this excess CF excelled in the stages after peak load (point A). A significant increase of RFE could be found from Figures 14A,B. When CF increased from 2 to 3%, RFE increased by 20.1%, from 645.4 N mm to 774.9 N mm; when CF increased from 3 to 4%, RFE increased by 14.9%, from 774.9 N mm to 890.0 N mm. Additionally, the proportion of RFE in FE grew from 48.4 to 53.0% as CF increased from 2 to 4%, as shown in Figure 14C (Note that RFE herein was represented only using the area of a curve segment from δp to δ150 according to ASTM C1609, which would be larger in practice.) This suggested that the plastic deforming performance of MPC was also improved by adding CF.
Conclusion
This study focused on the flexural performances of MPC with CF. A three-point flexural test was carried out to investigate the effects of CF volume dosage on MPC’s flexural strength, L-D behaviors, and flexural toughness. Conclusions were summarized as follows:
1) As CF increased, the specimen’s failure patterns transformed from brittleness failure to ductileness failure. The flexural strength of the specimen was improved significantly with the incorporation of CF, and the maximum flexural strength was 13.49 MPa, which grew by 15.7% when compared with that of the specimen without CF.
2) CF contributed to enhance the flexural strength of MPC, but its effectiveness was restricted by its volume dosage. In this study, when the volume dosage was larger than 3%, the effectiveness was reduced. Further tests need to be executed to find out the precise threshold of CF volume dosage.
3) CF could improve the flexural toughness of MPC significantly and continuously. Compared with the specimens without CF, the specimen with 4% CF had a flexural toughness which was approximately 4.19 times higher than that of the specimens without CF.
Data Availability Statement
The raw data supporting the conclusions of this article will be made available by the authors, without undue reservation.
Author Contributions
ZJ was responsible for designing the experiment scheme, test execution, data analysis, and writing the original manuscript. LZ was responsible for guiding the experiment scheme, theoretical guidance, and revision of the manuscript. JZ, ZS, and JL participated in the experimental scheme design and theoretical guidance.
Funding
This work was financially supported by the National Natural Science Foundation of China (Project No. 51608137) and the Graduate Student Innovation Ability Cultivation Fund of Guangzhou University (Project No. 2019GDJC-M38).
Conflict of Interest
The authors declare that the research was conducted in the absence of any commercial or financial relationships that could be construed as a potential conflict of interest.
Acknowledgments
The authors are thankful to the National Natural Science Foundation of China (Project No. 51608137) and the Graduate Student Innovation Ability Cultivation Fund of Guangzhou University (Project No. 2019GDJC-M38) for their financial support to help us complete the experiment in this paper.
References
Abdelrazig, B. E. I., Sharp, J. H., and El-Jazairi, B. (1988). The chemical composition of mortars made from magnesia-phosphate cement. Cement Concr. Res. 18, 415–425. doi:10.1016/0008-8846(88)90075-0
Ahmad, M. R., and Chen, B. (2018). Effect of silica fume and basalt fiber on the mechanical properties and microstructure of magnesium phosphate cement (MPC) mortar. Construct. Build. Mater. 190, 466–478. doi:10.1016/j.conbuildmat.2018.09.143
Alomayri, T., Shaikh, F. U. A., and Low, I. M. (2013). Characterisation of cotton fibre-reinforced geopolymer composites. Compos. B Eng. 50, 1–6. doi:10.1016/j.compositesb.2013.01.013
ASTM C1609/C1609M-10 (2010). Standard test method for flexural performance of fiber-reinforced concrete (using beam with third-point loading): ASTM International.
ASTM C293/C293M-16 (2016). Standard test method for flexural strength of concrete (using simple beam with center-point loading): ASTM International.
Deng, D. (2003). The mechanism for soluble phosphates to improve the water resistance of magnesium oxychloride cement. Cement Concr. Res. 33, 1311–1317. doi:10.1016/S0008-8846(03)00043
Deng, H. W., Yang, Y. Z., and Gao, X. J. (2011). Properties of phosphate cement mortar used as rapid-repair material. Adv. Mater. Res. 250-253, 1752–1756. doi:10.4028/www.scientific.net/AMR.250-253.1752
Ding, Z., Dai, J., and Muner, S. (2014). Study on an improved phosphate cement binder for the development of fiber-reinforced inorganic polymer composites. Polymers 6, 2819–2831. doi:10.3390/polym6112819
Ding, Z., and Li, Z. (2005). Study of high early strength cement based on fly ash, magnesia and phosphate. Mater. Technol. 20, 136–141. doi:10.1080/10667857.2005.11753125
Fan, S., and Chen, B. (2014). Experimental study of phosphate salts influencing properties of magnesium phosphate cement. Construct. Build. Mater. 65, 480–486. doi:10.1016/j.conbuildmat.2014.05.021
Fang, Y., Chen, B., and Oderji, S. Y. (2018). Experimental research on magnesium phosphate cement mortar reinforced by glass fiber. Construct. Build. Mater. 188, 729–736. doi:10.1016/j.conbuildmat.2018.08.153
Feng, H., Chen, G., Gao, D. Y., Zhao, K. P., and Zhang, C. (2018). Mechanical properties of steel fiber-reinforced magnesium phosphate cement mortar. Adv. Civ. Eng. 2018, 1–11. doi:10.1155/2018/3978318
Gao, D., and Zhang, T. (2007). Fracture characteristics of steel fiber reinforced high strength concrete under three-point bending. J. Chin. Ceram. Soc. 12, 1630–1635. doi:10.14062/j.issn.0454-5648.2007.12.019
He, W. C., Kong, X. Q., Fu, Y., Zhou, C., and Zheng, Z. Y. (2020). Experimental investigation on the mechanical properties and microstructure of hybrid fiber reinforced recycled aggregate concrete. Construct. Build. Mater. 261, 1–14. doi:10.1016/j.conbuildmat.2020.120488
Islam, S. M., Hussain, R. R., and Morshed, M. A. Z. (2012). Fiber-reinforced concrete incorporating locally available natural fibers in normal-and high-strength concrete and a performance analysis with steel fiber-reinforced composite concrete. J. Compos. Mater. 46, 111–122. doi:10.1177/0021998311410492
Jiang, H. Y., and Zhang, L. M. (2001). Investigation of phosphate cement-based binder with super high early strength for repair of concrete. J. Wuhan Univ. Technol. Materials Sci. Ed. 16, 46–48. doi:10.1016/S0022-5096(01)00036-9
Khan, M., and Ali, M. (2016). Use of glass and nylon fibers in concrete for controlling early age micro cracking in bridge decks. Construct. Build. Mater. 125, 800–808. doi:10.1016/j.conbuildmat.2016.08.111
Lecompte, T., Perrot, A., and Subrianto, A. (2015). A novel pull-out device used to study the influence of pressure during processing of cement-based material reinforced with coir. Construct. Build. Mater. 78, 224–233. doi:10.1016/j.conbuildmat.2014.12.119
Li, Y., Lin, H., Hejazi, S. M. A. S., Zhao, C., and Xie, M. Y. (2017). The effect of low temperature phase change material of hydrated salt on the performance of magnesium phosphate cement. Construct. Build. Mater. 149, 272–278. doi:10.1016/j.conbuildmat.2017.05.110
Pan, J. L., Yuan, F., Luo, M., and Leung, K. Y. (2012). Effect of composition on flexural behavior of engineered cementitious composites. Sci. China Technol. Sci. 55, 3425–3433. doi:10.1007/s11431-012-4990-7
Paul, A., and Thomas, S. (1997). Electrical properties of natural-fiber-reinforced low density polyethylene composites: a comparison with carbon black and glass-fiber-filled low density polyethylene composites. J. Appl. Polym. Sci. 63, 247–266. doi:10.1002/(SICI)1097-4628(19970110)63:2<247::AID-APP12>3.0.CO;2-#
Qiao, F., Chau, C. K., and Li, Z. J. (2010). Property evaluation of magnesium phosphate cement mortar as patch repair material. Construct. Build. Mater. 24, 695–700. doi:10.1016/j.conbuildmat.2009.10.039
Reis, J. M. L. (2006). Fracture and flexural characterization of natural fiber-reinforced polymer concrete. Construct. Build. Mater. 20, 673–678. doi:10.1016/j.conbuildmat.2005.02.008
Roy, D. M. (1987). New strong cement materials: chemically bonded ceramics. Science 235, 651–658. doi:10.1126/science.235.4789.651
Sarkar, A. K. (1990). Phosphate cement based fast setting bonders. Am. Ceram. Soc. Bull. 69, 234–238
Sarkar, A. K. (1991). Hydration/dehydration characteristics of struvite and dittmarite pertaining to magnesium ammonium phosphate cement system. J. Mater. Sci. 26, 2514–2518. doi:10.1007/BF01130204
Seehra, S. S., Gupta, S., and Kumar, S. (1993). Rapid setting magnesium phosphate cement for quick repair of concrete pavements–characterisation and durability aspects. Cement Concr. Res. 23, 254–266. doi:10.1016/0008-8846(93)90090-V
Swamy, P. (1970). Efficient inference in a random coefficient regression model. Econometrica 38, 311–323. doi:10.2307/1913012
Thanushan, K., Yogananth, Y., Sangeeth, P., Coonghe, J. G., and Sathiparan, N. (2019). Strength and durability characteristics of coconut fiber reinforced earth cement blocks. J. Nat. Fibers. doi:10.1080/15440478.2019.1652220
Wang, H., Qian, J., Cao, J., and Shen, B. (2006). Properties and application of steel-fiber reinforced magnesia phosphate cement mortar. Architect. Technol. 37, 462–464. doi:10.3969/j.issn.1000-4726.2006.06.023
Wu, Z. M., Shi, C. J., Kamal, H., and Khayat, (2018). Multi-scale investigation of microstructure, fiber pullout behavior, and mechanical properties of ultra-high-performance concrete with nano-CaCO3 particles. Cement Concr. Compos. 86, 255–265. doi:10.1016/j.cemconcomp.2017.11.014
Yang, Q., Zhu, B., and Wu, X. (2000). Characteristics and durability test of magnesium phosphate cement-based material for rapid repair of concrete. Mater. Struct. 33, 229–234. doi:10.1007/BF02479332
Keywords: magnesium phosphate cement, coconut fiber, three-point bending, flexural performances, scanning electron microscope
Citation: Jiang Z, Zhang L, Zhang J, Sun Z and Li J (2021) Effect of Coconut Fiber Dosage on Flexural Performances of Magnesium Phosphate Cement. Front. Mater. 8:557355. doi: 10.3389/fmats.2021.557355
Received: 30 April 2020; Accepted: 04 January 2021;
Published: 08 February 2021.
Edited by:
Xiangming Zhou, Brunel University London, United KingdomReviewed by:
Guoxing Sun, University of Macau, ChinaPrakash Gope, G. B. Pant University of Agriculture and Technology, India
Gediminas Kastiukas, Brunel University London, United Kingdom
Copyright © 2021 Jiang, Zhang, Zhang, Sun and Li. This is an open-access article distributed under the terms of the Creative Commons Attribution License (CC BY). The use, distribution or reproduction in other forums is permitted, provided the original author(s) and the copyright owner(s) are credited and that the original publication in this journal is cited, in accordance with accepted academic practice. No use, distribution or reproduction is permitted which does not comply with these terms.
*Correspondence: Liwen Zhang, bHd6aGFuZ0Bnemh1LmVkdS5jbg==