 N. G. Di Novo
 A. R. Carotenuto
 G. Mensitieri4
 M. Fraldi
 N. M. Pugno
- 1Laboratory of Bio-inspired, Bionic, Nano, Meta Materials and Mechanics, Department of Civil, Environmental and Mechanical Engineering, University di Trento, Trento, Italy
- 2Micro Nano Facility, FBK-Sensors and Devices, Trento, Italy
- 3Department of Structures for Engineering and Architecture, University of Napoli Federico II, Napoli, Italy
- 4Department of Chemical, Materials and Production Engineering, University of Napoli Federico II, Napoli, Italy
- 5School of Engineering and Materials Science, Queen Mary University of London, London, United Kingdom
The modeling of the viability decay of viruses in sessile droplets is addressed considering a droplet sitting on a smooth surface characterized by a specific contact angle. To investigate, at prescribed temperature, how surface energy of the material and ambient humidity cooperate to determine the virus viability, we propose a model which involves the minimum number of thermodynamically relevant parameters. In particular, by considering a saline water droplet (one salt) as the simplest approximation of real solutions (medium and natural/artificial saliva), the evaporation is described by a first-order time-dependent nonlinear differential equation properly rearranged to obtain the contact angle evolution as the sole unknown function. The analyses were performed for several contact angles and two typical droplet sizes of interest in real situations by assuming constant ambient temperature and relative humidity in the range 0–100%. The results of the simulations, given in terms of time evolution of salt concentration, vapor pressure, and droplet volume, elucidate some previously not yet well-understood dynamics, demonstrating how three main regimes—directly implicated in nontrivial trends of virus viability and to date only highlighted experimentally—can be recognized as the function of relative humidity. By recalling the concept of cumulative dose of salts (CD), to account for the effect of the exposition of viruses to salt concentration on virus viability, we show how the proposed approach could suggest a chart of a virus fate by predicting its survival time at a given temperature as a function of the relative humidity and contact angle. We found a good agreement with experimental data for various enveloped viruses and predicted in particular for the Phi6 virus, a surrogate of coronavirus, the characteristic U-shaped dependence of viability on relative humidity. Given the generality of the model and once experimental data are available that link the vulnerability of a certain virus, such as SARS-CoV-2, to the concentrations of salts or other substances in terms of CD, it is felt that this approach could be employed for antivirus strategies and protocols for the prediction/reduction of human health risks associated with SARS-CoV-2 and other viruses.
Introduction
As well known, the current pandemic events have rekindled the attention on the behavior of the virus diffusion and viability in several environmental conditions to envisage proper guidelines to prevent or somehow stop the contagion spreading. Within this framework, contamination of surfaces by people infected with SARS-CoV-2 virus has in particular raised concerns and introduced multiple precautions into everyday life and hospital routines, so becoming a crucial issue for understanding how to design suitable measures to safeguard human health.
Enveloped and non-enveloped viruses are known to survive inside expectorated respiratory droplets deposited on surfaces (Yang et al., 2012; Yang and Marr, 2012). The common experimental procedure to evaluate the decay of the infectivity of viruses on surfaces consists in suspending them in virus medium or artificial/natural saliva, depositing droplets on surfaces placed in chambers with controlled temperature and humidity, extracting the drops (or their residues after complete evaporation) via dilution at fixed times, and inoculating cell cultures with the diluted fluid. This is a reproduction of a real infection route where saliva droplets (or residues) enter the host body, rehydrate quickly (in the lungs or in the mucous membranes), and infect the cells. Ambient humidity has been proven to affect the viability of enveloped viruses in airborne (Yang and Marr, 2012) and deposited droplets (Yang et al., 2012; Prussin et al., 2018; Lin and Marr, 2020). Experimental evidence from recent literature suggests that a viable working hypothesis is to relate the survival of an encapsulated enveloped virus in a droplet to the toxic effect of dissolved salt and to the complex interplay with the relative humidity (RH) of the surrounding environment. In fact, with reference to some enveloped viruses, it has been reported (Yang et al., 2012; Yang and Marr, 2012; Prussin et al., 2018; Lin and Marr, 2020) that for a virus included in aerosol or deposited droplets of saline medium, the viability decreases as RH decreases, displaying a minimum at intermediate values of RH and increases up to a rather high value at RH ≤ 50% (the so-called U shape behavior). Interestingly, Yang et al., 2012 identified three regimes of viability in terms of RH for the influenza A virus (IAV) in the medium (e.g., phosphate-buffered saline [PBS] and PBS + proteins). Recent experiments on the enveloped Phi6 (a surrogate of SARS-CoV 2) with natural saliva (Fedorenko et al., 2020) have also been carried out: the more complex composition varies the viability vs. RH curve probably due to the interplay of the proteins with the salts, but the U shape is maintained. However, apart from qualitative observations and empirical evidence, the physics underlying these phenomena is not yet understood, and simple thermodynamics models capable to predict the experimental evidences and to explain the abovementioned regimes are not available so far.
Several hypotheses have been formulated on the effect of humidity on virus survival in evaporating droplets, such as surface inactivation at the air–water interface, and on changes in concentrations of dissolved salts and pH (Yang and Marr, 2012; Prussin et al., 2018; Lin and Marr, 2020). A concentration of solutes (salts, sugars, or other) different from the physiological one establishes an osmotic gradient between the inside and outside of enveloped viruses. In various experimental studies (Choi and Montemagno, 2014), it is shown that viruses shrink or swell in hypertonic or hypotonic solutions, respectively, and that the rate constant of swelling is greater than that of shrinkage. Their results show that the exposition to a certain osmotic gradient, combined with temperature, pH, and exposure time, can irreversibly damage viruses. Viruses suspended in an evaporating droplet are thus exposed to osmotic stresses, and their damage is dependent on the solution history. Moreover, A. Cordova et al. (Cordova et al., 2003) proposed a theoretical model of the osmotic shock—a rapid change of salts concentration (e.g., from a hyper-tonic solution to a diluted one)—that causes the destruction of T phage and other enveloped viruses capsid. With their words: “T phages were susceptible to osmotic shock because their capsids were significantly less permeable to salt ions than to water molecules. During the incubation stage there is sufficient time for high salt concentrations to become established inside the capsid, in response to the high molarity of the external solution. Experimentally this was ensured by incubating for at least 15 min. During the rapid dilution, however, there is not enough time for the salt ions to leave the capsid; rather, only more water diffuses in, resulting in an osmotic pressure that ruptures the capsid at a critical value of the incubation salt concentration.” This dilution process is analogous to the virus infection route through droplets in real and laboratory conditions and highlights how an osmotic shock depends on the relative concentrations (before and after dilutions) and on the incubation time in the concentrated solution. For the viruses in sessile drops, the scenario is even more complex as the concentration varies over time and the salts crystallize depending on the relative humidity.
The relative humidity of air, RH, is defined as the ratio of the actual partial pressure of water vapor to the saturation vapor pressure at the temperature of the air environment. The value of RH ranges from 0 to 1 and, frequently, is reported as a percentage, that is, as
Evaporation and crystallization of medium and artificial/natural saliva are complex phenomena due to the presence of several ions species, proteins and surfactants. PBS is a buffer solution of 3–4 salts where NaCl is the most abundant salt. It is commonly used for cell culture and virus medium to simulate the physiological environment with or without the addition of proteins, as reported for the enveloped virus Influenza A (Yang et al., 2012) and is an acceptable virus transport and storage medium for SARS-CoV 2 (Perchetti et al., 2020). Crystalline patterns of medium (Yang et al., 2012; Carreón et al., 2018) depend on composition (salts + proteins), RH, and evaporation time. The drops of artificial saliva are often realized by adding one or more salts [up to 10 salts in (Biryukov et al., 2020)] and mucin to distilled water. A droplet of natural saliva, besides water, contains several nonvolatile soluble salts (dissociated in Cl, K, P, Na, Ca, and Mg ions, arranged in decreasing molarity) and biological compounds (albumin, mucin, urea, and others) (Rehak et al., 2000; Bel’skaya et al., 2019), including viruses. Bel’skaya et al. (Bel’skaya et al., 2019) analyzed evaporated droplets of saliva from 100 healthy participants and highlighted relations between the composition and the surface tension with the morphology of the crystallized salt. Proteins could aggregate and be adsorbed by the growing surface of a salt crystal changing the growth of faces, as well as hinder the growth of existing crystals. Thus, the composition, environmental, and surface parameters determine the evaporation process, the exposition time of viruses to osmotic stresses and how and if the solutes are crystallized at the extraction time. All these aspects in relation with the dilution process—experimental or natural—affect the history of a virus and its survival.
Regarding the evaporation process, Vejerano and Marr (Vejerano and Marr, 2018) compared microdroplets of three types of fluid with increasing number of components: 1) NaCl solution + mucin, 2) NaCl solution + mucin + DPPC (a lung surfactant), and 3) natural saliva. The evaporation rate is lower as the number of compounds increase and decrease as the evaporation proceeds. Both aspects are related to the reduction of water activity due to the presence and increasing concentration of soluble (salt) and nonsoluble (proteins) compounds. Zhang, 2011 compared the evaporation of sessile droplets of natural saliva and saline solutions (for the time range before solution enrichment and crystallization) with the predictions of a model which accounts for the water activity reduction. For both the studies, the evaporation rates of saline solutions, medium, and saliva are of the same order of magnitude and show similar trends. In recent experiments, comparing saline water and natural saliva evaporation, Basu et al. (Basu et al., 2020) stated: “the deviation between the surrogate (saline water) and human saliva droplets originates in the complex composition of the later (mucus, surfactants, polyelectrolytes, etc) as well as inherent inhomogenity in the sample due to collection methodology. Nonetheless, the D/D0 (drop diameter/initial diameter vs time) appears to follow a similar trend at an offset rate and exhibits similar phenomenology.”
In this study, we model the evaporation of a sessile droplet of saline (a salt, NaCl) to approximate the solutions used in experiments (virus medium and saliva) given its close resemblance to the medium used in most viability experiments, its evaporation rates comparable to those of medium and saliva and for the analytical intractability of a complex solution such as natural saliva. In reference to the previous articles, considering the evaporation of a saline drop as an approximation of the medium and saliva simplifies the treatment while maintaining the main evaporative characteristics and, as we shall see, is sufficient to predict the U-shaped dependence of viability on RH.
To upload realistic data into the model and make faithful predictions, we first compared the experimental survival tests on surfaces of various enveloped coronaviruses available in the literature in order to highlight the common features, the dependence on parameters such as the temperature T and RH of the air and the properties of the surfaces. We found that the common experiments are usually performed by placing a droplet containing various kinds of enveloped coronaviruses solution (1–50 µL) on flat surfaces, controlling the temperature and the relative humidity RH, then extracting some samples at predefined time points and analyzing them via plaque assays. Interestingly, Casanova et al., 2010 evaluated the residual infectivity of gastroenteritis virus (TGEV) and mouse hepatitis virus (MHV) on stainless steel as potential surrogates of SARS-CoV-1, reporting a monotonic dependence on the ambient temperature
Some survival experiments of SARS-CoV 2 in aerosol and on surfaces have been also conducted in the last months (Biryukov et al., 2020; Chin et al., 2020; Fedorenko et al., 2020;van Doremalen et al., 2020). The review by Aboubakr et al. (2020) presents tables of coronaviruses stability in aerosol and on surfaces. The recent study of Biryukov et al., 2020 sheds light on the behavior of SARS-CoV-2 on surfaces: it decays more rapidly when either RH (20, 40, 60, and 80%) or
By starting from these experimental evidences, in what follows, we propose a mathematical model of a spherical cap droplet encapsulating a model virus, which incorporates all the relevant thermodynamics aspects of interest, by so analyzing the dependence on RH and on the material surface characteristics (through the contact angle
Preliminary Considerations on the Effect of Relative Humidity
The dependence on RH of viability of viruses in aerosols and on surfaces has been experimentally investigated in by Casanova et al. (2010), Prussin et al. (2018), Marr et al. (2019), Biryukov et al. (2020), Fedorenko et al. (2020), Lin and Marr 2020. Focalizing on sessile droplets evaporation is in fact fundamental to consider the possible relations with viability on surfaces. Indeed, all the experiments reported in the literature are performed by depositing a sessile droplet of liquid (with a volume in the range 1–50 µL) on the tested surfaces and placing them in a chamber with controlled
From the mathematical point of view, in case of a pure water droplet, the mass rate of evaporation,
where R is the pinned contact radius,
In a view that the evaporation time could be considered to represent a good estimate of the period with the higher probability of transmissibility, Bhardwaj and Agrawal, 2020 applied this model. They assumed a constant mass rate, for the case of a typical volume distribution of saliva droplets that are generated during a sneeze or a cough and could deposit on a surface (1–10 nL), with contact angles in the range of the more common materials (steel, glass, polymers, wood, and cotton). We have replicated these calculations considering the case of evaporation of droplets with a volume in the more realistic range of volumes adopted in actual viability experiments (Figure 1). Even though we considered in these preliminary calculations pure water droplets and not the actual droplets made of solutions of salts, proteins, and surfactants, we clearly see that the evaporation times are in the order of several hours (for a 50 μL water droplet). Actually, it appears from almost all-viability studies that coronaviruses are able to live even much longer than these evaporation times, that is, for days or even weeks (Casanova et al., 2010; Aboubakr et al., 2020; van Doremalen et al., 2020).
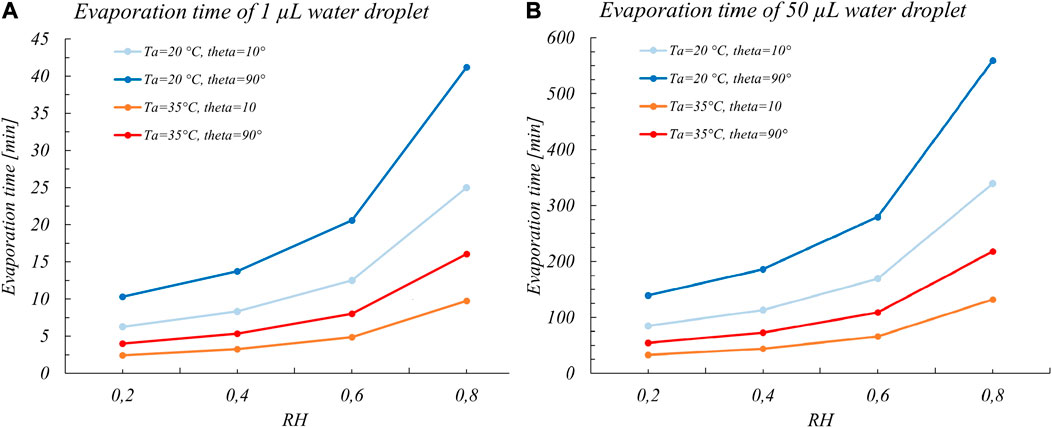
FIGURE 1. Full evaporation times for (A) 1 µL and (B) 50 µL water sessile droplets vs RH considering two common temperatures of viability experiments (20 and 35°C) and for extreme contact angles for common surfaces. The values are calculated to gain corresponding orders of magnitudes of the evaporation times and thus were obtained with the Eq. 1 assuming a constant mass rate.
As a matter of fact, considering the evaporation time of pure water as the viability time (Bhardwaj and Agrawal, 2020) is an oversimplified view since it hinders the underlying mechanism of virus inactivation. Rather, as shown by several studies of Yang et al., 2012; Yang and Marr, 2012; Prussin et al., 2018; Vejerano and Marr, 2018; Marr et al., 2019; Lin and Marr, 2020, the dependence between survival of viruses on
During the evaporation, there is in fact an enrichment of nonvolatile compounds such as salts, proteins, and surfactants (Lin and Marr, 2020). Solutions with high concentrations of salts lead to significant changes to the membrane structure (Choi and Montemagno, 2014) and elasticity (Pabst et al., 2007; Yang and Marr, 2012) and can cause inactivation. CD could be considered in first approximation as the product of salt concentration and time. The abovementioned studies reported a U-shaped viability curve with the maximum mortality of the enveloped Phi6 virus at RH ∼ 80% (Prussin et al., 2018; Lin and Marr, 2020). At low RHs, the droplets dry completely and rapidly, the salts crystallize, and enveloped viruses survive since they are no more in a high-concentration solution. On the opposite, at RHs near 100%, the evaporation is slow and droplets stay in a nearly physiological condition (Yang and Marr, 2012). As mentioned above (Fedorenko et al., 2020), the Phi6 virus shows a U-shaped dependence of viability both for SM buffer and natural saliva, with the peak position dependent on the solution considered. With specific reference to SARS-CoV-2, a recent study by Biryukov et al., 2020 shows a decreasing trend with RH, but the humidity tested does not exceed 80%. It can be expected that at humidity close to 100%, with very slow evaporation and therefore close to physiological conditions, survival increases, thus showing U dependence.
Modeling Evaporation of Sessile Droplets of an Aqueous Salt Solution at Room Temperature: Effects of Humidity and Contact Angle
Let us consider a simplified modeling of the drying of saliva sessile drop–containing viruses, which consists in a droplet of an aqueous solution of sodium chloride placed on a flat surface. It is assumed that the droplet, both at the start of the drying process and during the evaporation, takes the shape of a spherical cap. This hypothesis is legitimate if the droplet is too small to sag under the action of the gravitational field and if the flow within the droplet is too weak to alter the interface shape (Hu and Larson, 2002; Ronald, 2014). In addition, we impose a “pinned contact line,” thus the assumption of a constant contact radius (CCR) of the droplet contact line (Hu and Larson, 2002) is hypothesized, as suggested by observations on common-use surfaces and more appropriate than the complementary assumption of constant contact angle (ideal and superhydrophobic surfaces). A consequence of this choice is that, during droplet evaporation, the contact angle that the droplet forms with the substrate does not remain constant in time. The geometrical parameters of a droplet that evolves according to the CCR hypothesis are illustrated in the schematic sketch of Figure 2.
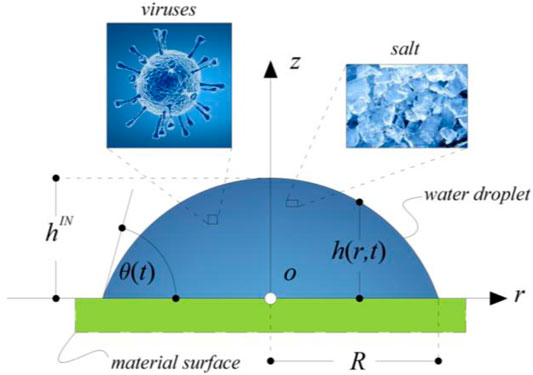
FIGURE 2. Schematic representation of a droplet sitting on a flat surface with spherical cap shape. The contact angle is
Based on geometrical considerations, the following relationships can be written:
where R is the radius of the contact line of the droplet, r is the radial coordinate,
To describe the process dynamics, we also hypothesize that the droplet evaporates slow enough into stagnant air that the mass transfer is limited by the diffusion of water in the gaseous phase surrounding the droplet (assumed to be stagnant), the flow within the droplet is at low Reynolds’ number Re, and heat, mass, and momentum transport processes are all at quasi-steady state. In addition, it is also assumed that evaporation rate is slow enough that the temperature of the droplet is uniform and constant with time inside the droplet, and equal to the constant value of that of the substrate and the surrounding air environment (Ta). The assumption of a quasi-steady-state profile for the water mass concentration within the gaseous phase surrounding the droplet is fulfilled if
Another important point is that we have imposed that at the interface between the droplet and the external gaseous phase, the concentration of water
where
where
Conversely, in the gaseous phase, at a great distance from the droplet surface, concentration of water can be assumed to take the value
The abovementioned assumptions allow simplification of the mathematical complexity of the problem at hand, which is reduced to solve a Laplace equation, representing the quasi–steady-state mass balance within the gaseous region above the droplet. If one disregards the momentum and energy balances within the liquid and gaseous phases, assuming uniform and time invariant temperature and uniform solute concentration within the droplet, the approximate solution of such a problem, in terms of the instantaneous total mass evaporation rate of the droplet,
As for the case of Eq. 1, also Eq. 7 holds true for values of
where
Results and Discussion
As seen, Eq. 8 relates the instantaneous rate of variation of the contact angle formed by the droplet of water–salt solution with the substrate to its current value, involving three relevant parameters: the relative humidity of the environment, RH, the initial contact angle between the droplet and substrate,
By numerically solving Eq. 8, the time evolution of the salt concentration,
The results of these calculations can be exploited to assess the viability of the virus present in a sessile droplet if we introduce a suitable measure of vitality of the virus related to a quantity representative of the harmful “cumulative” exposure of the virus present within the droplet to the salt dissolved in the liquid phase. This, as already stated and suggested from experiments, is the time-dependent quantity named “cumulative dose” (Lin and Marr, 2020), CD, which measures the accumulation of damage to the structure of the virus expressed as:
in which Csalt is the salt concentration within the droplet and the upper limit of integration and
To determine a reasonable value for CD* to be used in our calculations, we refer to the experiments performed by Lin and Marr, 2020 on viability of the non-enveloped virus MS2 incubated in bulk lysogeny broth (LB) of different ionic strengths. In particular, results on MS2 viability are reported (Lin and Marr, 2020) in terms of relative viability (RV) as a function of time, RV being defined as the ratio of the post-exposure concentration of MS2 to its pre-exposure concentration.
In the same publication, Lin and Marr, 2020 also reported the experimental results of tests performed in bulk solutions, in terms of RV of MS2 virus as a function of cumulative dose of NaCl. To define a realistic analytical relationship between RV and CD to be used in our simulations, we have fitted these data using a power law function, obtaining the following expression:
which is reported, along with original data points, in Figure 3. This equation will be employed for obtaining the outcomes from numerical computations in terms of RV.
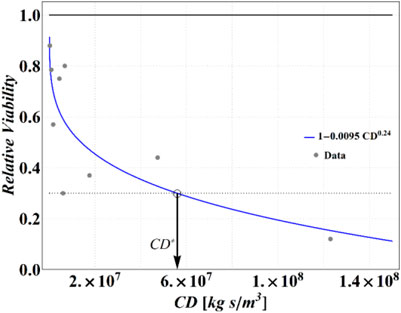
FIGURE 3. Experimental data from Lin and Marr (Lin and Marr, 2020) and the best fitting curve. A threshold RV of 0.3 (dotted line) has been assumed to find a critical value of cumulative dose CD*.
Analyzing these data, we have determined that an RV = 0.3 is attained at CD = 5.6 × 10⁷ (kg∙s)/m3, which has been then assumed as a reference value of CD* for the purposes of the present calculations. Obviously, different choices are legitimate, with obvious consequences on the results of the following calculations, but the strategy is general and may be adapted easily to the more sophisticated measure of the cumulative dose threshold or critical conditions (e.g., inserting a threshold value for the dose itself).
Simulations based on the illustrated model have been carried out, at 25°C, for three different values of RH (i.e., 40, 80, and 100%), four different values of
The selection of the RH values is motivated by the fact that there are two relevant values of the pressure of water vapor at the droplet–air interface established for the aqueous solution at the initial conditions. These are the value
In particular, if the value of RH is within the regime I, it is expected that the volume of the droplet increases indefinitely since the RH is greater than the water activity of the solution, thus promoting the water condensation and the dilution of the salt.
If the value of RH is within the regime II, it is expected that the volume of the droplet decreases with time, due to the thermodynamic driving force pushing the system toward phase equilibrium, which promotes the water evaporation and the consequent increase of salt concentration. Once the phase equilibrium is attained, the volume then remains constant and no further changes of its value are expected to occur. The concentration of the salt within the droplet and the contact angle also decrease with time down to the value that they attain when the equilibrium is established and then remain indefinitely constant with time.
If the value of RH falls within the regime III, it is again expected that the volume of the droplet decreases with time, due to the thermodynamic driving force that promotes the water evaporation and the consequent increase of concentration of the salt. However, since at a certain instant of time, the saturation condition is attained and the salt starts to precipitate, from that point on, the concentration of the salt within the droplet remains constant with time, while the volume continues to decrease until the droplet completely disappears.
It is important to note here that aqueous salt solutions tend to form supersaturated mixtures without precipitating at the true thermodynamic saturation point. In fact, the indicated RH2 value of 0.753 is the one dictated by purely thermodynamic arguments. This value actually corresponds to the already mentioned DRH value. Since precipitation occurrence is affected by nucleation and growth kinetics of salt crystals, a more suitable value to be used to mark the transition from regime II to regime III would be the value of ERH, which, in the case of NaCl aqueous mixtures, is in the 0.439 to 0.567 range at 25°C, depending on the drop size. Since the choice of the value of RH2 does not affect the calculations and the qualitative conclusions of the present investigation, in the following development, we illustrate the case in which one assumes that salt precipitation occurs at the thermodynamic saturation point.
All the simulations have been performed for the specific case of a droplet aqueous solution of NaCl at a temperature of 25°C, assuming a concentration-independent value of water diffusivity in air (
Results of the numerical computations are shown in Figures 4–9, where the time evolution of the salt concentration,
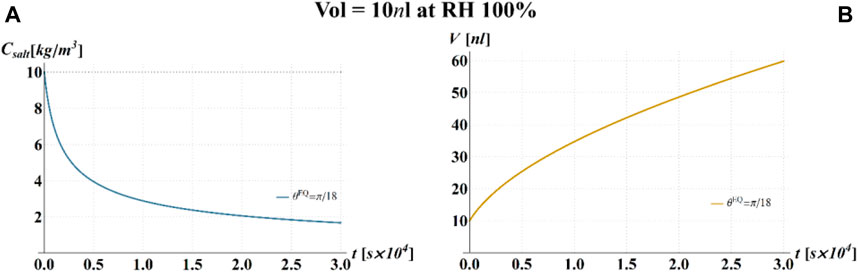
FIGURE 4. Results of model calculations of the evaporation process of a sessile drop of aqueous solution with a starting volume of 10 nL, at an RH = 100%, in terms of time evolution of (A) the salt concentration,
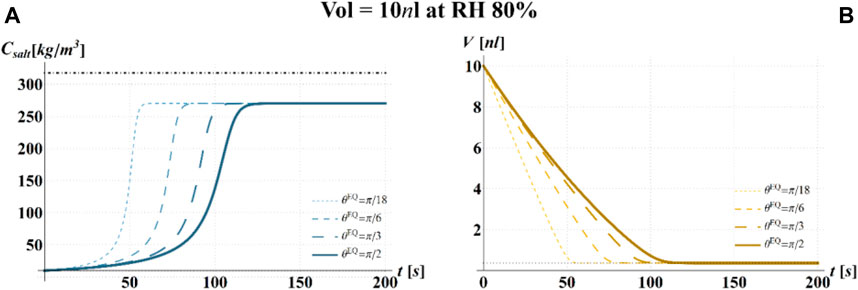
FIGURE 5. Results of model simulations of the evaporation process of a sessile drop of aqueous solution with a starting volume of 10 nL, at an RH = 80%, in terms of time evolution of (A) the salt concentration,
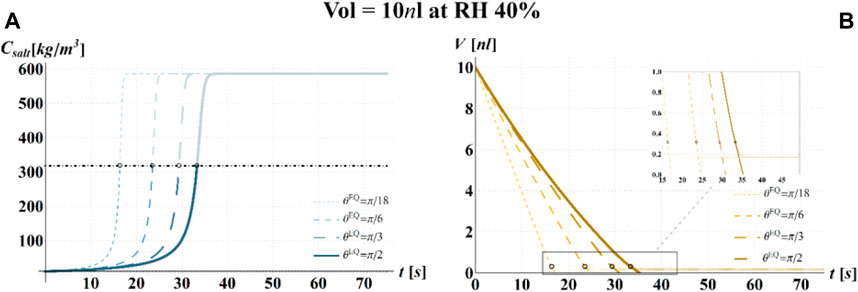
FIGURE 6. Results of model simulations of the evaporation process of a sessile drop of aqueous solution with a starting volume of 10 nL, at an RH = 40%, in terms of time evolution of (A) the salt concentration,
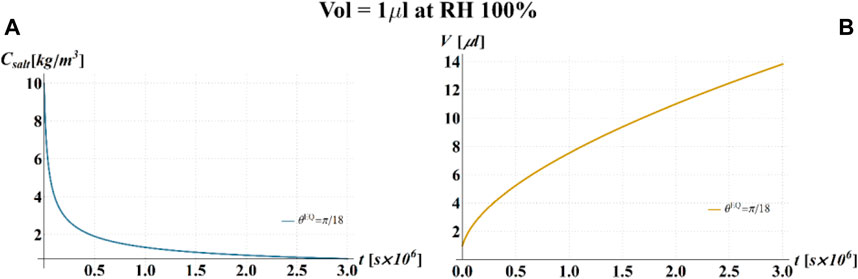
FIGURE 7. Results of model simulations of the evaporation process of a sessile drop of aqueous solution with a starting volume of 1 μL, at a RH = 100%, in terms of time evolution of (A) the salt concentration,
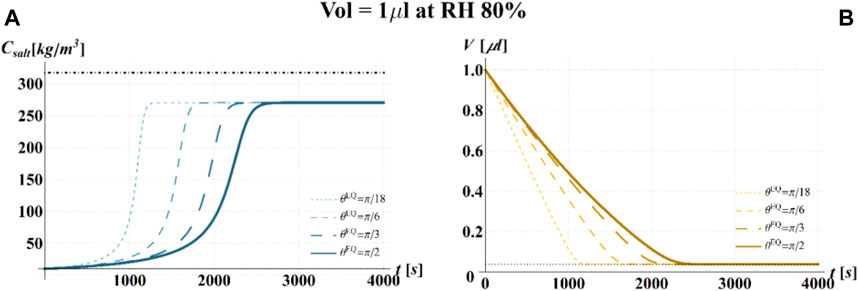
FIGURE 8. Results of model simulations of the evaporation process of a sessile drop of aqueous solution with a starting volume of 1 μL, at an RH = 80%, in terms of time evolution of (A) the salt concentration,
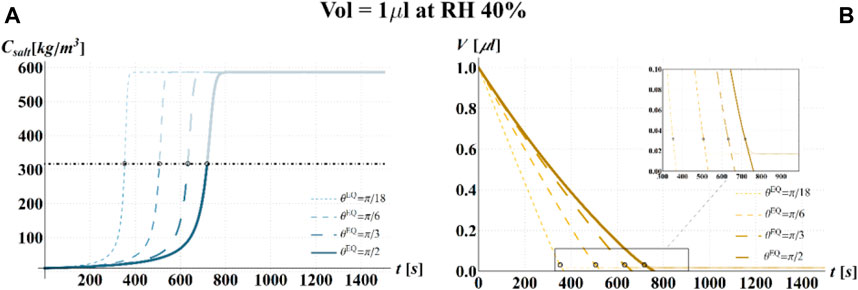
FIGURE 9. Results of model simulations of the evaporation process of a sessile drop of aqueous solution with a starting volume of 1 μL, at an RH = 40%, in terms of time evolution of (A) the salt concentration,
Based on these computations, it is finally possible to evaluate the time evolution of CD for the different conditions considered in the simulations. In Figures 10A,B, respectively, for initial volumes equal to 10 nL and 1 μL, the temporal evolution of CD for the different combinations of RH and
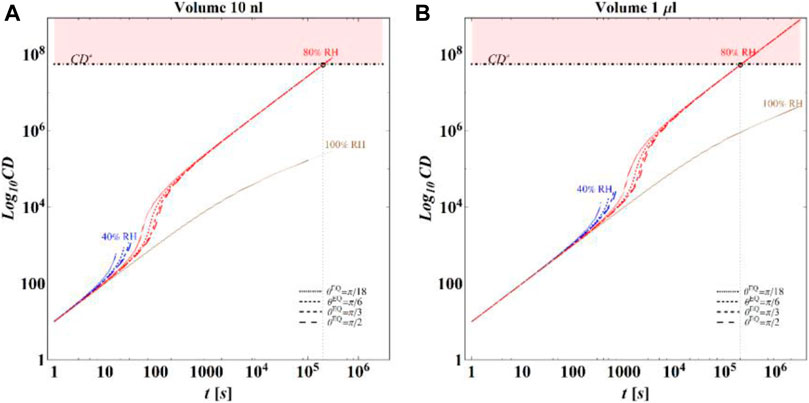
FIGURE 10. Results of model calculations of the evaporation process of a sessile drop of aqueous solution in terms of time evolution of CD for a starting volume of the drop equal to (A) 10 nL and (B) 1 μL, at an RH = 40, 80, and 100%, for flat surfaces with different wettability and at T = 25°C. As for Figures 3, 6 at RH = 100%, only the calculations performed for an initial contact angle equal to
Making use of Eq. 10, we expressed the obtained theoretical predictions in terms of RV (see Figure 11), thus allowing a direct comparison of our calculations with experimental measurements reported in the recent literature on the survival of different virus models that represent appropriate surrogates of coronavirus (Casanova et al., 2010; Prussin et al., 2018).
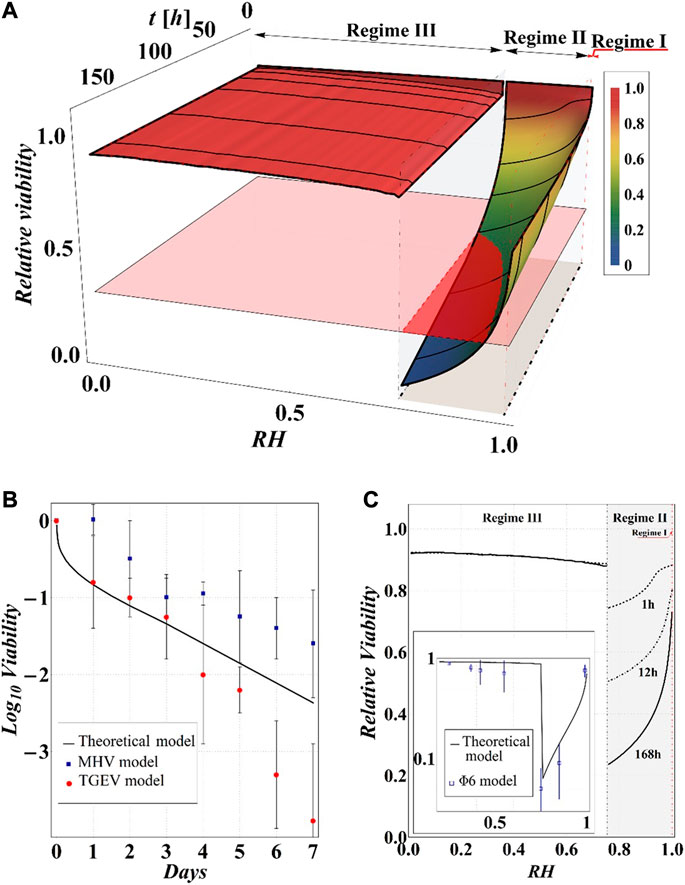
FIGURE 11. (A) Results of model calculations of the evaporation process of a sessile drop of aqueous solution in terms of relative viability of the virus as a function of the time and the RH, for a starting volume of the drop equal to 1 μL and
Although the results obviously depend on the selected value of relative viability (in the case at hand 0.3) and, in turn, of CD*, some general qualitative conclusions can be drawn.
The main observation is that the amount of time needed to attain a certain value of the relative viability of the virus, as evaluated by the proposed procedure and criteria, displays a non-monotonic dependence on RH, with a minimum value located within the regime II region. This is highlighted in Figure 10, in which the CD curves, referred to different values of the contact angle, display a non-monotonic behavior as a function of RH, with the intersection of the horizontal CD* threshold line, and in Figure 11A, where the relative viability surface is reported as a function of RH and time along with the plane representing the selected threshold RV = 0.3.
Figure 10 shows that at an RH value of 40% of the drop disappears before CD becomes equal to CD*, while, at RH = 100%, CD is expected to become equal to CD* at much longer times since the drop increases in size, thus gradually diluting the salt in a way that there is a delay of the moment at which the combination of salt concentration and time of exposure of virus becomes critical (CD = CD*).
It is worth to highlight that, at RH falling in the regime III (e.g., at RH = 40%), the droplet completely evaporates before CD* is attained and the virus survives since it is no longer encapsulated into a highly concentrated solution. Similarly, the rapid drying reduces the exposition time to osmotic stresses (Choi and Montemagno, 2014) and avoids achieving high salt concentration inside the capsid which would cause an osmotic shock during the subsequent dilution (Cordova et al., 2003). These considerations could explain the high RV reported for low RH. In the region of regime II, instead the drop settles in a condition of equilibrium with the surrounding air without reaching the saturation concentration. The virus is then subjected to high salt concentrations for a long time which may explain the high mortality.
The outcomes of the simulations compare well with the available experimental data as evident in Figure 11B, where our results in terms of RV vs time, at RH = 80% and room temperature, are reported along with the data on the viability of the transmissible gastroenteritis virus (TGEV) and of the mouse hepatitis virus (MHV), that are model viruses indicated as proper surrogates of severe acute respiratory syndrome coronavirus (Casanova et al., 2010). In addition, the computed RV displays a dependence on RH that closely resembles the experimentally determined U-shaped dependence of relative viability exhibited by other two virus models (i.e., Phi6 and MS2), reported by Prussin et al., 2018; Lin and Marr, 2020 (see Figures 11A,C). Quite interestingly, the theoretical curves show a discontinuity in the values of viability at the boundary between the regimes III and II, in which the viability decreases by attaining the critical limit, as qualitatively hypothesized by Yang et al., 2012 by observing the relationship between RH and the viability of influenza A virus in salt droplets from laboratory experiments.
Finally, from our simulations, it is also evident that virus survival generally tends to increase with the contact angle of the surface on which the drop is deposited. Indeed, fixing a time
Conclusion
In order to predict the viability of enveloped viruses in sessile aqueous drops when sitting on flat surfaces, we implemented a mathematical model that incorporates all the relevant thermodynamics aspect of interest and, under physically consistent quasi–steady-state conditions, we obtained a nonlinear evolution differential equation on the sole unknown time-dependent contact angle, by taking into account the crucial role of relative humidity RH at a prescribed ambient temperature and the salt concentration variations during the evaporation process. To make the problem mathematically feasible, we have considered the relatively simple case of a droplet of an aqueous NaCl salt solution, which is considered to be a crude approximation of a real saliva drop still retaining some of the main features relevant for virus survival. A real saliva drop actually displays a more complex structure. In particular, the assumptions of spherical cap shape of the drop, constant contact radius (CCR) of the droplet contact line with the flat substrate, and some other simplifying hypotheses coherent with the experimental observations, including homogeneity of the drop, were also made. The aqueous spherical cap simulating a drop of saliva is assumed to have inside viruses and other nonvolatile compounds, including sodium chloride salt. Although real saliva drops are more complex, containing several types of salts, variable amounts of proteins, surfactants, and other components, we assumed as key factor for determining the viability of the virus the salt concentration, in line with literature evidence. The toxic effect of salt, whose concentration increases as the water evaporates from the drop, was thus accounted for in a critical parameter, CD*, which represents a threshold value for the cumulative dose CD that includes the time of exposure of the virus to a given salt concentration.
The main conclusion is that the viability of the virus, as evaluated by the proposed procedure and criteria, displays a non-monotonic dependence on RH, with a minimum value occurring within the region of the so-called regime II, that is, at intermediate values of RH. Modeling results also suggest that virus survival increases with the contact angle of the surface on which the drop is deposited. It is considered that these results and the proposed method could have important practical implications for the prediction of survival time of viruses, including SARS-CoV-2 responsible for COVID-19, and for ad hoc designing engineered material surfaces in synergy with controlled thermo-hygrometric parameters for creating adverse environmental conditions for virus spread and viability.
Data Availability Statement
The original contributions presented in the study are included in the article/Supplementary Material, further inquiries can be directed to the corresponding author.
Author Contributions
All the authors contributed within the limits of their knowledge and competence. NDN, NP, GM, and MF had the general idea and contributed to the conceptualization of the problem. NDN, GM, and MF contributed to the general thermodynamic framework and to the modeling of the problem. AC and NDN performed the analyses and contributed to the development of the mathematical models and to the interpretation of the results.
Conflict of Interest
The authors declare that the research was conducted in the absence of any commercial or financial relationships that could be construed as a potential conflict of interest.
Acknowledgments
NP and MF acknowledge the Italian Ministry of Education, University and Research (MIUR), under the (1) ARS01–01384-PROSCAN and (2) PRIN 2017 20177TTP3S grants. AC acknowledges support from PON-AIM1849854–1.
References
Aboubakr, H. A., Sharafeldin, T. A., and Goyal, S. M. (2020). Stability of SARS-CoV-2 and other coronaviruses in the environment and on common touch surfaces and the influence of climatic conditions: a review. Transbound. Emerg. Dis. 00, 1–17. doi:10.1111/tbed.13707
Apelblat, A. (1993). The vapour pressures of saturated aqueous lithium chloride, sodium bromide, sodium nitrate, ammonium nitrate, and ammonium chloride at temperatures from 283 K to 313 K. J. Chem. Thermodyn. 25 (1), 63–71. doi:10.1006/jcht.1993.1008
Basu, S., Kabi, P., Chaudhuri, S., and Saha, A. (2020). Insights on drying and precipitation dynamics of respiratory droplets in the perspective of Covid-19. Phys. Fluids 32, 123317. doi:10.1063/5.0037360
Bel’skaya, L. V., Sarf, E. A., and Solonenko, A. P. (2019). Morphology of dried drop patterns of saliva from a healthy individual depending on the dynamics of its surface tension. Surfaces 2 (2), 395–414. doi:10.3390/surfaces2020029
Bhardwaj, R., and Agrawal, A. (2020). Likelihood of survival of coronavirus in a respiratory droplet deposited on a solid surface. Phys. Fluids 32 (6), 061704. doi:10.1063/5.0012009
Biryukov, J., Boydston, J. A., Dunning, R. A., Yeager, J. J., Wood, S., Reese, A. L., et al. (2020). Increasing temperature and relative humidity accelerates inactivation of SARS-CoV-2 on surfaces. mSphere 5 (4), 1–9. doi:10.1128/mSphere.00441-20
Carreón, Y. J. P., Ríos-Ramírez, M., Moctezuma, R. E., and González-Gutiérrez, J. (2018). Texture analysis of protein deposits produced by droplet evaporation. Sci. Rep. 8 (1), 1–12. doi:10.1038/s41598-018-27959-0
Casanova, L. M., Jeon, S., Rutala, W. A., Weber, D. J., and Sobsey, M. D. (2010). Effects of air temperature and relative humidity on coronavirus survival on surfaces. Appl. Environ. Microbiol. 76 (9), 2712–2717. doi:10.1128/AEM.02291-09
Chin, A. W. H., Chu, J. T. S., Perera, M. R. A., Hui, K. P. Y., Yen, H. L., Chan, M. C. W., et al. (2020). Stability of SARS-CoV-2 in different environmental conditions. medRxiv 2020, 2–5. doi:10.1101/2020.03.15.20036673
Choi, H., and Montemagno, C. D. (2014). “Assessment of osmotic characteristics of influenza viruses,” in Epidemiology–research and practice. 1st Edn. Hong Kong, China: iConcept Press Ltd., 19.
Cordova, A., Deserno, M., Gelbart, W. M., and Ben-Shaul, A. (2003). Osmotic shock and the strength of viral capsids. Biophys. J. 85 (1), 70–74. doi:10.1016/S0006-3495(03)74455-5
Fedorenko, A., Grinberg, M., Orevi, T., and Kashtan, N. (2020). Virus survival in evaporated saliva microdroplets deposited on inanimate surfaces. Sci. Rep. 2020, 1–16. doi:10.1101/2020.06.15.152983
Gao, Y., Chen, S. B., and Yu, L. E. (2007). Efflorescence relative humidity of airborne sodium chloride particles: a theoretical investigation. Atmos. Environ. 41 (9), 2019–2023. doi:10.1016/j.atmosenv.2006.12.014
Green, D., and Southard, M. Z. (2018). Perry’s chemical engineers handbook. 9th Edn. Editor M.-H. Education (Chennai, TN: McGraw-Hill Education), 2272.
Hu, H., and Larson, R. G. (2002). Evaporation of a sessile droplet on a substrate. J. Phys. Chem. B 106 (6), 1334–1344. doi:10.1021/jp0118322
Kampf, G., Todt, D., Pfaender, S., and Steinmann, E. (2020). Persistence of coronaviruses on inanimate surfaces and their inactivation with biocidal agents. J. Hosp. Infect. 104 (3), 246–251. doi:10.1016/j.jhin.2020.01.022
Lide, D. R. (2020). “CRC handbook oh chemistry and physics,” in Journal of the American chemical society. 90th Edn. Editor W. M. Mickey Haynes (Boca Raton, FL: CRC Press), 131, 12862.
Lin, K., and Marr, L. C. (2020). Humidity-dependent decay of viruses, but not bacteria, in aerosols and droplets follows disinfection kinetics. Environ. Sci. Technol. 54 (2), 1024–1032. doi:10.1021/acs.est.9b04959
Marr, L. C., Tang, J. W., Van Mullekom, J., and Lakdawala, S. S. (2019). Mechanistic insights into the effect of humidity on airborne influenza virus survival, transmission and incidence. J. R. Soc. Interf. 16 (150), 20180298. doi:10.1098/rsif.2018.0298
Pabst, G., Hodzic, A., Štrancar, J., Danner, S., Rappolt, M., and Laggner, P. (2007). Rigidification of neutral lipid bilayers in the presence of salts. Biophys. J. 93 (8), 2688–2696. doi:10.1529/biophysj.107.112615
Perchetti, G. A., Huang, M.-L., Peddu, V., Keith, R., and Jerome, A. L. G. (2020). Stability of SARS-CoV-2 in phosphate-buffered saline for molecular detection. J. Clin. Microbiol. 58 (8), e01094. doi:10.1128/JCM.01094-20
Pitzer, K. S., Peiper, J. C., and Busey, R. H. (1984). Thermodynamic properties of aqueous sodium chloride solutions. J. Phys. Chem. Ref. Data 13 (1), 1–102. doi:10.1063/1.555709
Prussin, A. J., Schwake, D. O., Lin, K., Gallagher, D. L., Buttling, L., and Marr, L. C. (2018). Survival of the enveloped virus Phi6 in droplets as a function of relative humidity, absolute humidity, and temperature. Appl. Environ. Microbiol. 84 (12). doi:10.1128/AEM.00551-18
Rehak, N. N., Cecco, S. A., and Csako, G. (2000). Biochemical composition and electrolyte balance of “unstimulated” whole human saliva. Clin. Chem. Lab. Med. 38 (4), 335–343. doi:10.1515/CCLM.2000.049
Ronald, G. (2014). Transport and deposition patterns in drying sessile droplets. AIChE lJ. 60 (5), 1538–1571. doi:10.1002/aic.14338
van Doremalen, N., Bushmaker, T., Morris, D. H., Holbrook, M. G., Gamble, A., Williamson, B. N., et al. (2020). Aerosol and surface stability of SARS-CoV-2 as compared with SARS-CoV-1. N. Engl. J. Med. 382 (16), 1564–1567. doi:10.1056/NEJMc2004973
Vejerano, E. P., and Marr, L. C. (2018). Physico-chemical characteristics of evaporating respiratory fluid droplets. J. R. Soc. Interf. 15 (139), 1–10. doi:10.1098/rsif.2017.0939
Yang, W., Elankumaran, S., and Marr, L. C. (2012). Relationship between humidity and influenza aviability in droplets and implications for influenza’s seasonality. PLoS One 7 (10), e46789–8. doi:10.1371/journal.pone.0046789
Yang, W., and Marr, L. C. (2012). Mechanisms by which ambient humidity may affect viruses in aerosols. Appl. Environ. Microbiol. 78 (19), 6781–6788. doi:10.1128/AEM.01658-12
Keywords: COVID-19, SARS-CoV-2, droplet evaporation, virus viability, surfaces design
Citation: Di Novo NG, Carotenuto AR, Mensitieri G, Fraldi M and Pugno NM (2021) Modeling of Virus Survival Time in Respiratory Droplets on Surfaces: A New Rational Approach for Antivirus Strategies. Front. Mater. 8:631723. doi: 10.3389/fmats.2021.631723
Received: 09 December 2020; Accepted: 12 February 2021;
Published: 16 April 2021.
Edited by:
Seunghwa Ryu, Korea Advanced Institute of Science and Technology, South KoreaReviewed by:
Hyoungsoo Kim, Korea Advanced Institute of Science and Technology, South KoreaShangchao Lin, Shanghai Jiao Tong University, China
Copyright © 2021 Di Novo, Carotenuto, Mensitieri, Fraldi and Pugno. This is an open-access article distributed under the terms of the Creative Commons Attribution License (CC BY). The use, distribution or reproduction in other forums is permitted, provided the original author(s) and the copyright owner(s) are credited and that the original publication in this journal is cited, in accordance with accepted academic practice. No use, distribution or reproduction is permitted which does not comply with these terms.
*Correspondence: N. M. Pugno, bmljb2xhLnB1Z25vQHVuaXRuLml0