 Yin Wang
 Ziyan Chen
- College of Mechanical Engineering and Automation, Huaqiao University, Xiamen, China
To establish an efficient model for sonotrode system, a key part that continuously applies ultrasonic oscillation on metal foils to form solid state bond in ultrasonic consolidation equipment, this research presents modeling methods for sonotrode system. After an introduction to the construction of sonotrode system along with its operating principle, the transfer matrix method was adopted to build the model for the system consisting two ultrasonic transducers and one sonotrode. Simulation results of transfer matrix model were compared to that of finite element method. A prototype was fabricated and tested. A comparison of the resonance frequencies calculated by two modeling methods to the experimental result showed that the difference between transfer matrix model and prototype is 6.96% while the difference between finite element model and prototype is 9.26%. The proposed transfer matrix method is an efficient way to simulate dynamic performances for sonotrode system, which provide a better foundation for further optimization.
Introduction
Ultrasonic consolidation (UC) was developed based on metal ultrasonic additive manufacturing (UAM) which was mainly used for welding the congeneric metal and heterogeneous metal foil (Mariani and Ghassemieh, 2010; Jiao et al., 2019; Wang et al., 2019b). In UC process, high-power ultrasonic energy is transmitted to layers of metal foil through an ultrasonically vibrating sonotrode, pressed onto them, resulting in metallurgical bonding between atoms and interfaces of metal layers (Li and Soar, 2008; Li and Soar, 2009). This process avoids the high temperature needed for recrystallization, thus no protecting atmosphere is necessary for avoiding oxidization and smaller thermal deformation is arisen (Foster et al., 2013; Obielodan and Stucker, 2014). UC has shown unique advantages and broad prospects in metal composite material manufacturing, intelligent structure processing, and complex functional structure manufacturing (Zhang et al., 2009; Zhang and Li, 2009; Zhang and Li, 2010; Panteli et al., 2012). In the past, the researches on ultrasonic consolidation mainly focused on the exploration of consolidation principle, numerical simulation, and thermal analysis of consolidation process, as well as the evaluation of the quality and process parameters of consolidated foil (Dehoff and Babu, 2010; Friel et al., 2010; Koellhoffer et al., 2011; Schick et al., 2011; He et al., 2013; Zhang et al., 2015; Han et al., 2020). However, as the core element of UC, the study of consolidation equipment is also important (Kelly et al., 2015). The first ultrasonic consolidation equipment is a single transducer structure invented by White. D et al., which can achieve continuous seam welding with the power of 3 KW. Later, the Edison Welding Institution proposed a high-power composite vibration mode piezoelectric vibrator with two transducers in series with welding power of 9 KW (Sriraman et al., 2010). With the gradual improvement in this technology, Fabrisonic company combined the consolidation equipment with CNC machine tools and developed an ultrasonic consolidation automation equipment that can realize the one-step forming. Piezoelectric vibrator as the key energy conversion component of sonotrode system for ultrasonic consolidation equipment, the establishment of piezoelectric vibrator model is convenient for its optimal design and dynamic design, which is one of the key technologies in the development of this kind of equipment.
In the studies on the vibration characteristics of ultrasonic systems, the modeling methods commonly used for a piezoelectric vibrator include equivalent circuit method, transfer matrix method (TMM), and finite element method (FEM). In most cases, piezoelectric transducers can be modeled with the finite element method. The FEM can provide a relatively accurate solution. However, the customized TMM for a certain geometry model can significantly reduce computing time. As a result, the TMM is gradually adopted by researchers (Feyzollahzadeh and Bamdad, 2020). The TMM is more convenient for the optimization of ultrasonic systems in the circumstance of repeatedly modeling a single system with the same geometry (Wang et al., 2019a).
This work aimed at an efficient dynamic model for a push-pull transducer adopted in high-power ultrasonic welding equipment and a transfer matrix model for its sonotrode was proposed. In the model, the transducer was divided into three kinds of longitudinal vibration elements: the elastic bar with constant cross-section, elastic bar with variable cross-section, and the piezoelectric element. Besides, a finite element model of the same sonotrode was also built for comparison. Finally, a push-pull transducer prototype is manufactured and its impedance test was carried out. The feasibility of the two modeling methods was verified and the possible factors of errors were analyzed.
Construction and Working Principle
Construction
The requirement of consolidation equipment for ultrasonic consolidation is a high power, large output vibration amplitude, and stable operation. The design consists of two sandwich piezoelectric transducers with symmetrical sonotrode. The structural parameters of the left and right transducers are identical, as shown in Figure 1. The sonotrode includes a welding head in the middle and amplitude adjusters on both sides. In order to achieve the purpose of continuous welding, the sonotrode is a wheel disc type, with grooves on both sides to facilitate the loading of static pressure. The sandwich transducer consists of three parts: piezoelectric element, metal front cover plate directly contacting with the horn end, and metal back cover plate connecting the ultrasonic generator. The energy generated by the transducer radiates the longitudinal vibration efficiently to the horn end through the front cover plate, while the back cover plate contacts the air directly. The whole piezoelectric vibrator uses the first-order longitudinal vibration to generate axial vibration, so as to obtain high-frequency vibration at the welding head and achieve consolidation effect through friction.
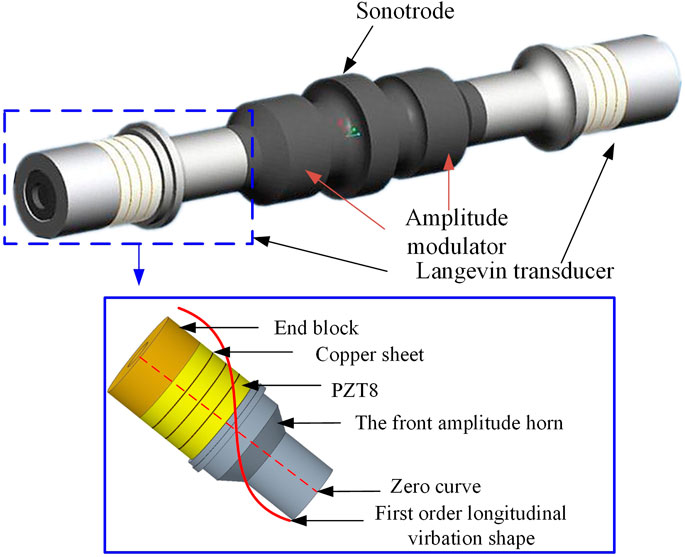
FIGURE 1. Construction of the sonotrode system.
Working Principle
The movement direction of the left and right sandwich transducers of push-pull piezoelectric vibrator keeps the same direction all the time. When one side shrinks, the other side stretches, and the transducers produce longitudinal vibration as a whole. To realize the push-pull excitation, two sandwiched transducers are applied with two voltage excitation of reverse phases, or the piezoelectric ceramics in the two transducers are polarized in opposite directions, as shown in Figure 2.The working principle is shown in Figure 3.
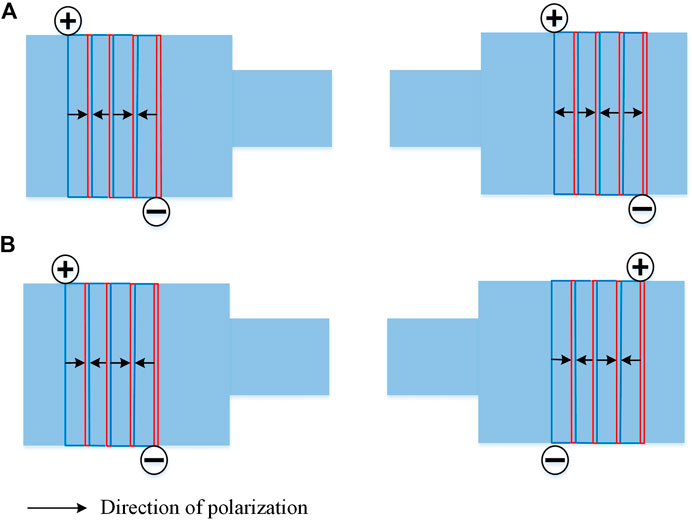
FIGURE 2. Push-pull excitation (A) The piezoelectric ceramics polarized in opposite direction with the same voltage (B) The piezoelectric ceramics polarized in same direction with two voltage excitation of reverse phases.
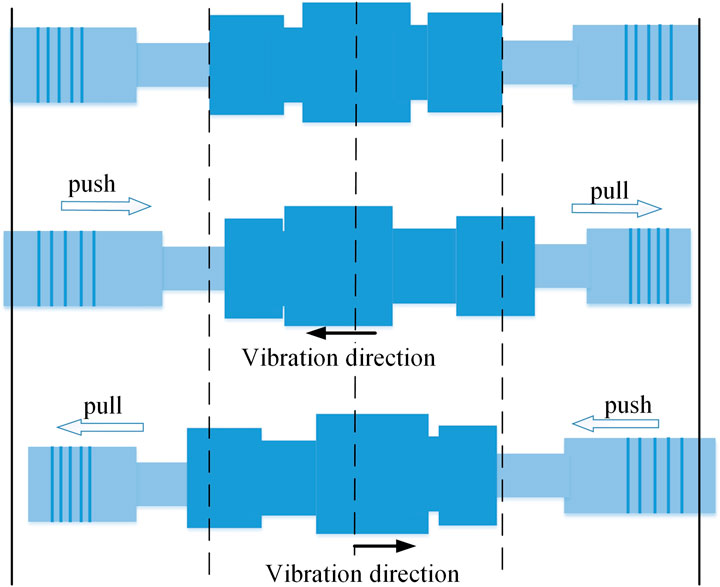
FIGURE 3. Working principle of sonotrode system.
The specific materials to be fixed are mainly aluminum foil and titanium alloy, and the working frequency of the ultrasonic vibration system is aimed at about 20 kHz. The parameters of PZT8 are shown in Table 1.
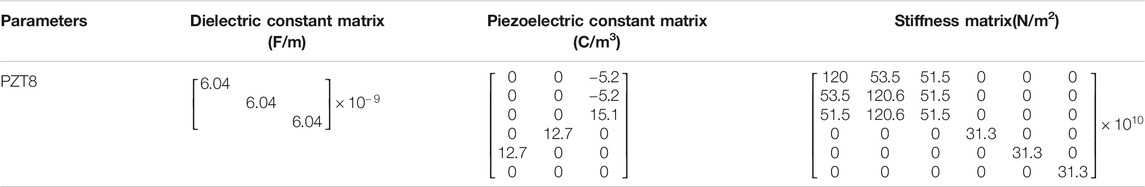
TABLE 1. Parameters of piezoelectric ceramics.
Modeling
Transfer Matrix Modeling
The transfer matrix method discretizes the complex system and then connects them through the transfer connection between each discrete element (Eduard, 1963). The TMM can obtain the accurate solution of the vibration velocity of each discrete element with the resonance frequency of the system, which plays a key role in analyzing whether the frequency of the designed transducer and the vibration velocity of the welding head meet the requirements. Since there is only one vibration form of longitudinal vibration in the whole sonotrode system, the longitudinal vibration wave equations of elastic rod and piezoelectric element were established, and its transfer matrix can be obtained, and simple boundary conditions can be set up to solve the problem.
As shown in Figure 4, the piezoelectric vibrator was mainly divided into the right transducer (A), the left transducer (B), and the sonotrode (C). According to symmetry, the sonotrode can be divided into three parts: left amplitude modulator, right amplitude modulator, and M-type welding head. All the discrete elements can be divided into three types: the longitudinal vibration of the constant cross-section bar, the longitudinal vibration of the variable cross-section bar, and the longitudinal vibration of the piezoelectric element.

FIGURE 4. Discrete model of the push-pull transducer.
Longitudinal Vibrations of Elastic Rod
The longitudinal vibration of elastic rod was divided into constant cross-section and variable cross-section, as shown in Figure 5.
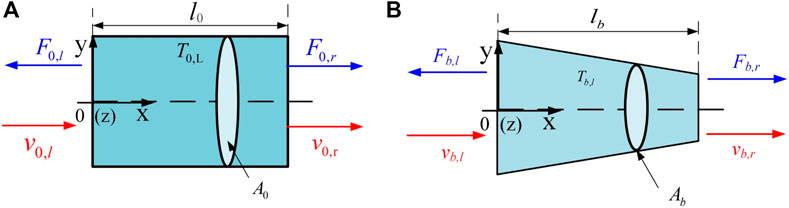
FIGURE 5. Longitudinal vibrations of tapered sticks (A) constant cross-section rob (B) variable cross-section rob.
According to Newton’s second law, the wave equation of elastic rod with constant cross section in free boundary can be formulated as:
T0,l is the longitudinal vibration transfer matrix of elastic rod.
The wave equation of variable cross-section can be formulated as.
where
where
Longitudinal Vibrations of Piezoelectric Element
In the sandwich transducer structure, the piezoelectric element with d33 vibration mode is mainly used, and its polarization direction is along the thickness direction. To maximize the amplitude of piezoelectric ceramics, the polarization direction of two adjacent ceramic sheets was opposite. The thickness of the copper electrode is so thin that it can be ignored. The model is shown in Figure 6, which is the transfer matrix model of two ceramic plates.
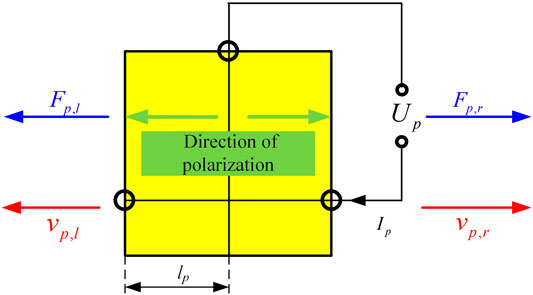
FIGURE 6. Longitudinal vibration of piezoelectric element.
The elastic coupling matrix, dielectric coupling matrix and piezoelectric coupling matrix of PZT8 were written as a whole, and the relationship among strain, stress, electric field and potential shift (j1 = 1,2,3,4,5,6) of piezoelectric element can be obtained intuitively:
Wave equation of PZT element is similar to the elastic rod which can be formulated as:
And the transfer matrix of PZT element is:
where
Transfer Conditions
After the whole transducer was discretized, according to the two key conditions that the resultant force is zero and the velocity is equal between adjacent elements on their contact interface, each vibration unit is connected with the state vector. Each discretized part of the push-pull piezoelectric transducer was connected in series, which can be divided into two types. Type1 is the series connection of elastic rod and elastic rod, and Type2 is the series connection of piezoelectric element and elastic rod as expressed:
Where Ze,i and Ze,i+1 represent the input state vector and the output state vector of variable cross-section rob i and i+1, respectively. Ce is the longitudinal vibration condition matrix between two adjacent elastic bars with a dimension of 2 × 2.
The Total Transfer Matrix Equation
The discrete model of the whole sonotrode system with boundary conditions is shown in Figure 7 and structural parameters are also given. The solution direction is from element one to element 23. Each element has input and output state vectors.
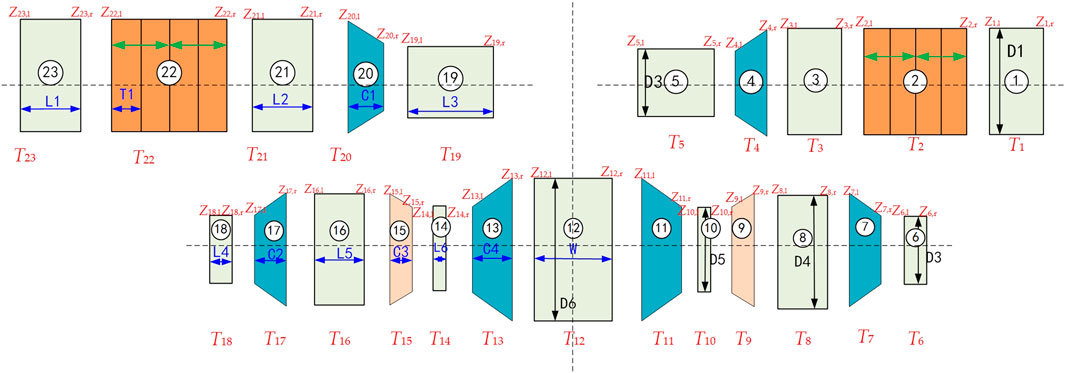
FIGURE 7. Integral transfer matrix model of sonotrode system.
The sandwich transducer A and B have the same transfer matrix. Based on the transfer matrix of each element and the transfer condition matrix between elements, a simple boundary condition matrix was added. The boundary conditions are mechanically free and voltage is applied to the piezoelectric ceramic element. The transfer matrix equation of transducer is obtained as:
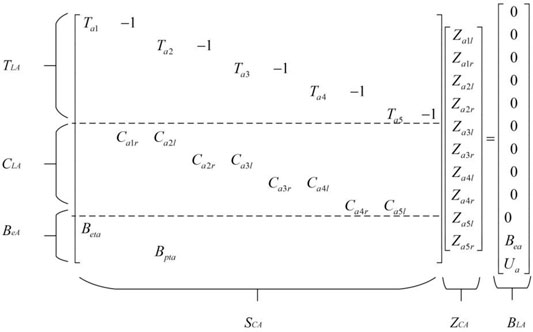
Where TLA is the physical matrix of transducer A, CLA is the transfer condition matrix of transducer and BeA is the boundary condition matrix of transducer. The three matrixes constitute the total systematic transfer matrix of transducer SCA. ZCA concludes the total input and output mechanical state vectors of transducer and BLA represents the total boundary condition values.
The sonotrode C can be divided into three parts as shown in Figure 8.
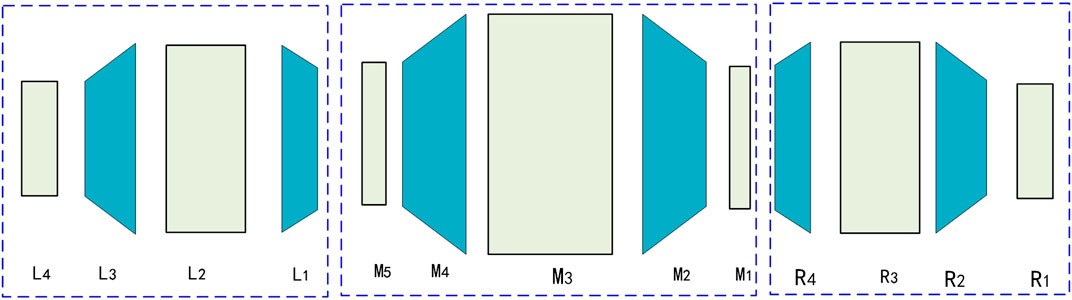
FIGURE 8. Discrete model of sonotrode.
The right amplitude modulator (R1∼R4) and the left one (L1∼L4) have the same transfer matrix can be expressed:
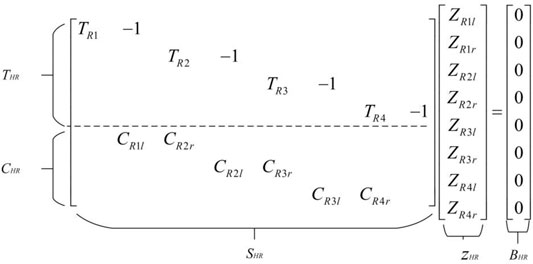
Where THR is the physical matrix of amplitude modulator, CHR is the total transfer condition matrix of amplitude modulator. The three matrixes constitute the total systematic transfer matrix of transducer SHR. ZHR concludes the total input and output mechanical state vectors of transducer and BHR represents the boundary condition values.
And the M tool head can be expressed:
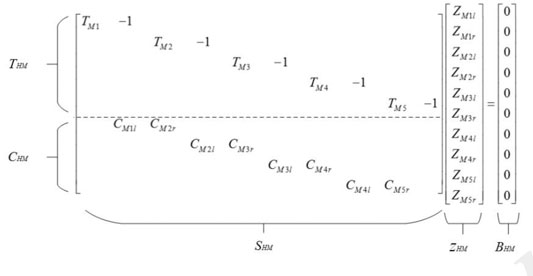
Where THM is the physical matrix of M-type welding head, CHM is the transfer condition matrix of welding head. The three matrixes constitute the total systematic transfer matrix of welding head SHM. ZHM concludes the total input and output mechanical state vectors of welding head and BHM represents the boundary condition values.
So the transfer matrix model of the sonotrode can be expressed.
SHL is total physical matrix of the left amplitude modulator. CRM1, CRM2 is the total transfer condition matrix with a dimension of 2
From above, the sonotrode system is divided into three parts and the transfer matrix model of the piezoelectric vibrator is expressed:
SCA is the total physical matrix of the right transducer, SCC is the total physical matrix of the sonotrode and SCB is total physical matrix of the left transducer. CAC, CCA is the total transfer condition matrix with a dimension of 2
Finite Element Modeling
The FEM of sonotrode system was established by ANSYS finite element analysis software. The quarter section of the piezoelectric vibrator is shown in Figure 9 and its geometrical sizes of the piezoelectric vibrator are listed in Table 2. Solid five was selected as piezoelectric ceramic and solid 45 was selected as other metal parts which are shown in Table 3. To model the preloading bolt, a slot with a width of G and length of H was built at the back cover plate. Moreover, due to the existence of preloading bolts, there is a gap with the width of G at the exit of the PZT sheets, which makes the piezoelectric ceramic sheet and the middle bolt not connect together on the grid.
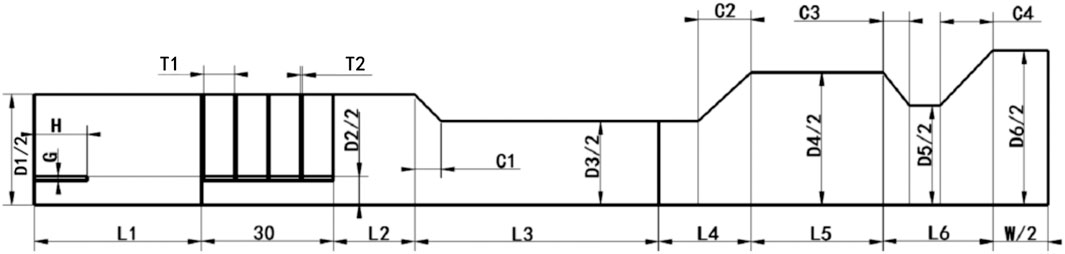
FIGURE 9. Parameter diagram of quarter section model of piezoelectric vibrator.

TABLE 2. Geometrical sizes of the piezoelectric vibrator.
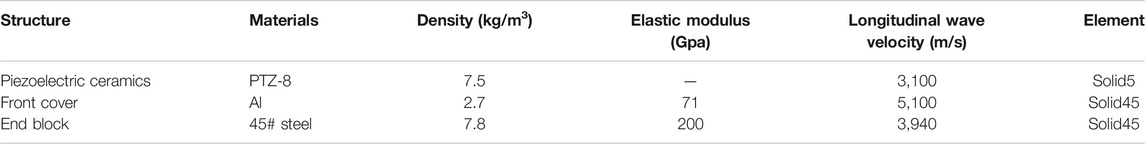
TABLE 3. Material properties of piezoelectric vibrator.
To make the mesh more regular, the 1/4 model of the piezoelectric vibrator was first established, then the three element symmetry was adopted to obtain the finite element model of the whole piezoelectric vibrator, which is shown in Figure 10.
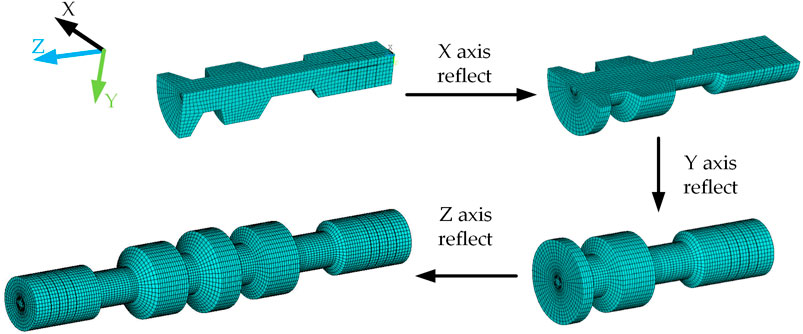
FIGURE 10. Establishment of finite element model.
Result and Discussion
Through the calculation of the transfer matrix in Transfer matrix modeling Section, the relationship between the vibration velocity and frequency of the sonotrode system is shown in Figure 11. It can be seen that when the frequency is near 18645 Hz, there is a peak value of vibration velocity which gets its resonant frequency.
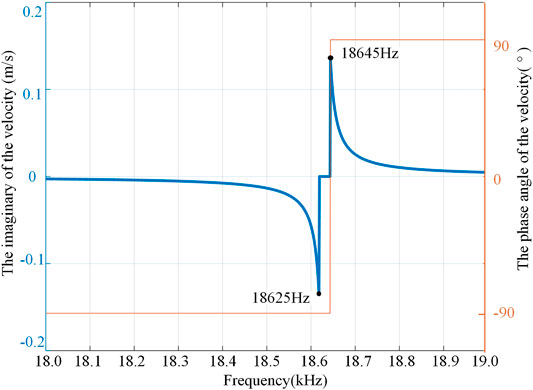
FIGURE 11. The vibration velocity of the TMM.
After the finite element model was obtained, the modal analysis of the piezoelectric vibrator was carried out. Taking the symmetry center as the origin, the longitudinal displacement of the nodes on the axis of the piezoelectric vibrator was extracted, and the vibration mode of the piezoelectric vibrator was obtained as shown in Figure 12. The resonant frequency of the longitudinal mode is 18,187 Hz. It can be seen that the model obtained a longitudinal vibration mode. The maximum displacement is at the sonotrode. When the transducer on one side is extended, the other side is shortened. It can be seen from the modal shape in the figure that both of them are close to the sinusoidal mode and are similar.
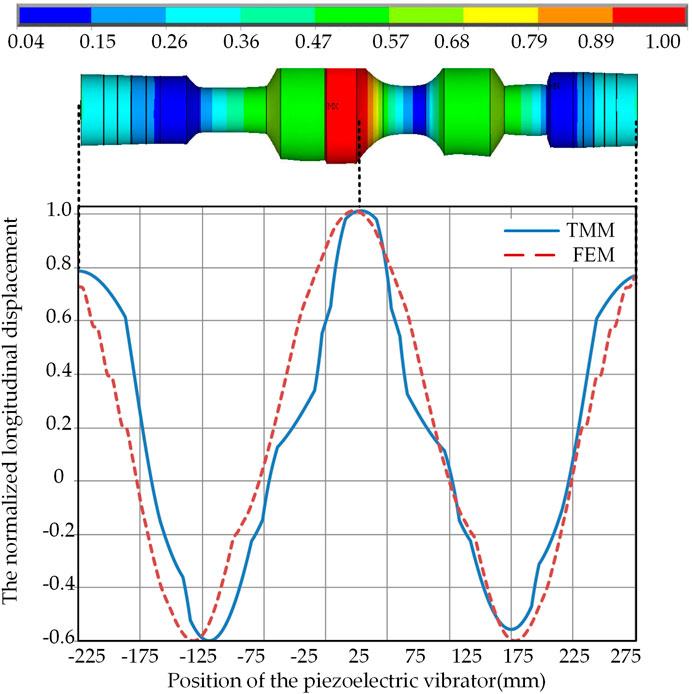
FIGURE 12. Modal analysis of piezoelectric vibrator.
Apply the voltage with a phase difference of 180° and peak to peak value of 200 V on the left and right transducers to obtain the amplitude of the two models, respectively, as shown in Table 4. The absolute errors between them were also calculated.
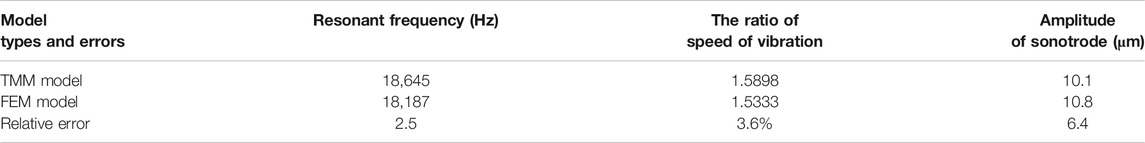
TABLE 4. Comparison of two models.
It can be seen the frequency difference between the two models is small, but the amplitude difference is large. The amplitude of the FEM is related to the excitation, while the amplitude of the TMM is the theoretical value derived from the vibration rate.
Experiment
To verify the effectiveness of the two modeling methods, a prototype of sonotrode system was established as shown in Figure 13. The material and structural parameters were consistent with the proposed above. Two supporting flange plates were attached to the base and installed at the nodes of the transducer.
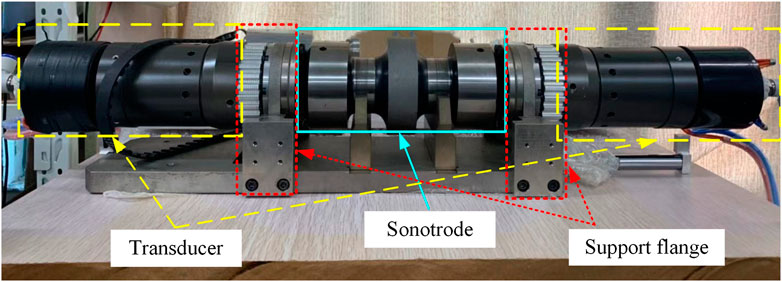
FIGURE 13. The prototype of sonotrode system.
In order to obtain the resonant frequency of the push-pull transducer, the impedance experiment was carried out. An impedance analyzer ZX70A was used for the impedance test. The basic accuracy of the impedance analyzer is 0.05%, and the frequency accuracy is 1 mHz. Because the left and right transducers are the same, only one section of the transducer was connected to the impedance analyzer. The frequency range of 10 kHz–80 kHz and the number of scanning points 1,556 were set. It can be seen that the transducer has resonant frequencies in each frequency band. Then take the frequency close to 20 kHz, and set the number of scanning points 1,001. The admittance of the prototype was obtained. As shown in Figure 14, the maximum admittance frequency is 20,042 Hz. According to the resonance theory, there is a resonance frequency of the piezoelectric vibrator near and below this frequency.
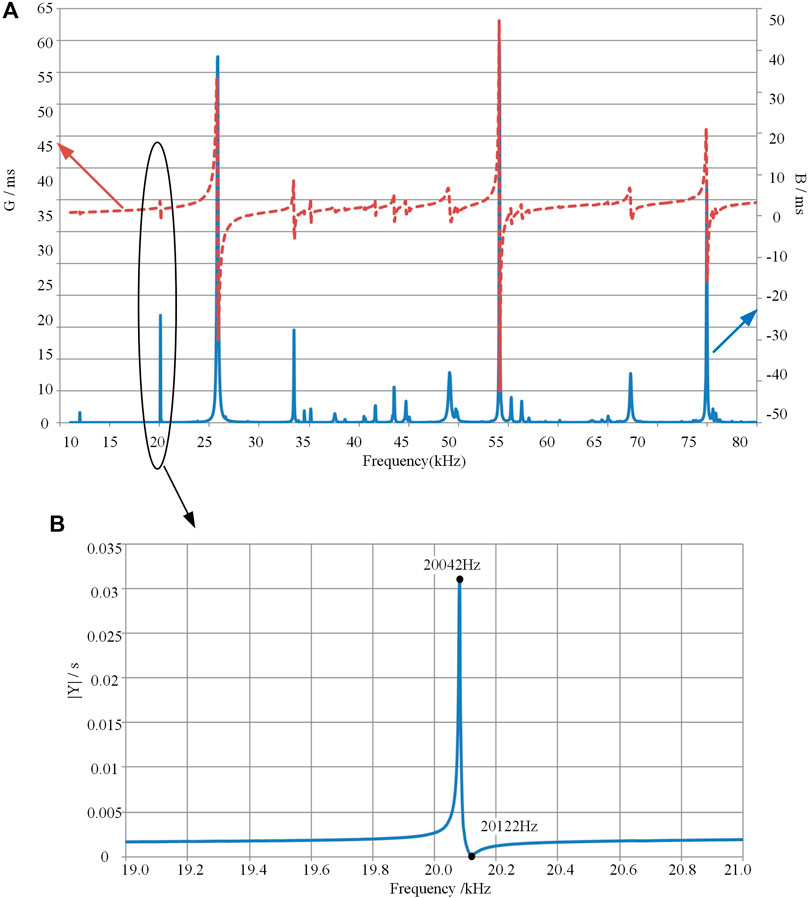
FIGURE 14. Impedance and phase curve of prototype (A) Impedance curve at full frequency (B) Impedance curve around 20 kHz.
Discussion
Comparison of experimental results, the relative error of the resonant frequency of TMM model is 6.96% and that of the FEM model is 9.26%. The error of TMM is smaller and closer to the actual characteristics of the prototype. The reason for the error of TMM can be attributed to the fact that the chamfering was regarded as a variable cross-section. The reason for the error of the FEM may be the grid and the selected elements have an impact on the model. When building a finite element model, the preloading force between the preloading bolt and the piezoelectric ceramics sheet cannot be reflected after assembly. Besides, the processing technology still affects the properties of the material, thus affecting the solution of the vibration calculation. In order to compact the assembly of the transducer and the sonotrode, holes were punched in both the output amplitude horn and the modulator of the transducers, and the existence of such holes was not considered in both two models.
By comparing the two models and the experiment, it can be found that the TMM seems more accurate. When studying this kind of sandwich piezoelectric transducer, it’s found that the FEM is difficult to calculate very accurately, and the preload on the piezoelectric ceramic is very exquisite. In the FEM, the gap between the preloading bolt and the PZT sheet was simulated, and the joint end face was connected together, there are still some inevitable errors. In general, the FEM and the TMM have similar calculation themes, both of which discretizes the target object. FEM is very particular about grid division and the density and the size of mesh determine the solution accuracy. However, the TMM only needs to decompose the vibrating body according to its different vibration modes. Compared with the traditional finite element modeling method, the transfer matrix modeling method can indeed shorten the calculation time and intuitively obtain the working frequency. The TMM can intuitively reflect the relationship between the structural parameters and the resonant frequency.
Conclusion
Based on the sonotrode system for ultrasonic consolidation, two models were established, that is, the finite element model and the transfer matrix model. The ratio of the speed of vibration, resonant frequency, and amplitude ratio of the two models were compared. The prototype was made and its testing results verified the results of modeling. The dynamic performances calculated by both models were compared with the experimental results, which show that the transfer matrix method has the same feasibility as the finite element model and can achieve higher efficiency.
Data Availability Statement
The original contributions presented in the study are included in the article/Supplementary Material, further inquiries can be directed to the corresponding author.
Author Contributions
YW came up with the idea. ZC and YW carried out the experiments. ZC analyzed the experimental results. ZC, QY, and FC wrote the manuscript. All authors contributed to the article and approved the submitted version.
Funding
This research was funded by the National Natural Science Foundation of China (Grant No.: 51505161), Natural Science Foundation of Fujian province (Grant No.: 2016J01236), the Promotion Program for Young and Middle-aged Teacher in Science and Technology Research of Huaqiao University (Grand No.: ZQN-PY604), and the Subsidized Project for Postgraduates’ Innovative Fund in Scientific Research of Huaqiao University (Grant No.: 18013080054).
Conflict of Interest
The authors declare that the research was conducted in the absence of any commercial or financial relationships that could be construed as a potential conflict of interest.
References
Dehoff, R. R., and Babu, S. S. (2010). Characterization of interfacial microstructures in 3003 aluminum alloy blocks fabricated by ultrasonic additive manufacturing. Acta Mater. 58, 4305–4315. doi:10.1016/j.actamat.2010.03.006
Feyzollahzadeh, M., and Bamdad, M. (2020). A modified transfer matrix method to reduce the calculation time: a case study on beam vibration. Appl. Math. Comput. 378, 125238. doi:10.1016/j.amc.2020.125238
Foster, D. R., Dapino, M. J., and Babu, S. S. (2013). Elastic constants of ultrasonic additive manufactured Al 3003-H18. Ultrasonics 53, 211–218. doi:10.1016/j.ultras.2012.06.002
Friel, R. J., Johnson, K. E., Dickens, P. M., and Harris, R. A. (2010). The effect of interface topography for Ultrasonic Consolidation of aluminium. Mater. Sci. Eng. 527, 4474–4483. doi:10.1016/j.msea.2010.03.094
Han, T., Kuo, C.-H., Sridharan, N., Headings, L. M., Babu, S. S., and Dapino, M. J. (2020). Effect of preheat temperature and post-process treatment on the microstructure and mechanical properties of stainless steel 410 made via ultrasonic additive manufacturing. Mater. Sci. Eng. 769, 138457. doi:10.1016/j.msea.2019.138457
He, X.-H., Shi, H.-J., Zhang, Y.-D., Fu, W.-X., Yang, Z.-G., and Wilkinson, C. E. (2013). In-situ scanning electron microscopy studies of small fatigue crack growth in ultrasonic consolidation bonded aluminum 2024 laminated structure. Mater. Lett. 112, 47–50. doi:10.1016/j.matlet.2013.08.093
Jiao, F., Liu, M., Jiang, F., Zhao, J., Li, P., and Wang, Z. (2019). Continuous carbon fiber reinforced Ti/Al3Ti metal-intermetallic laminate (MIL) composites fabricated using ultrasonic consolidation assisted hot pressing sintering. Mater. Sci. Eng.: A 765, 138255. doi:10.1016/j.msea.2019.138255
Kelly, G. S., Advani, S. G., and Gillespie, J. W. (2015). A model to describe stick-slip transition time during ultrasonic consolidation. Int. J. Adv. Manuf. Technol. 79, 1931–1937. doi:10.1007/s00170-015-6939-z
Koellhoffer, S., Gillespie, J. W., Advani, S. G., and Bogetti, T. A. (2011). Role of friction on the thermal development in ultrasonically consolidated aluminum foils and composites. J. Mater. Process. Technol. 211, 1864–1877. doi:10.1016/j.jmatprotec.2011.06.011
Li, D., and Soar, R. C. (2008). Plastic flow and work hardening of Al alloy matrices during ultrasonic consolidation fibre embedding process. Mater. Sci. Eng.: A 498, 421–429. doi:10.1016/j.msea.2008.08.037
Li, D., and Soar, R. (2009). Influence of sonotrode texture on the performance of an ultrasonic consolidation machine and the interfacial bond strength. J. Mater. Process. Technol. 209, 1627–1634. doi:10.1016/j.jmatprotec.2008.04.018
Mariani, E., and Ghassemieh, E. (2010). Microstructure evolution of 6061 O Al alloy during ultrasonic consolidation: an insight from electron backscatter diffraction. Acta Mater. 58, 2492–2503. doi:10.1016/j.actamat.2009.12.035
Obielodan, J., and Stucker, B. (2014). A fabrication methodology for dual-material engineering structures using ultrasonic additive manufacturing. Int. J. Adv. Manuf. Technol. 70, 277–284. doi:10.1007/s00170-013-5266-5
Panteli, A., Robson, J. D., Brough, I., and Prangnell, P. B. (2012). The effect of high strain rate deformation on intermetallic reaction during ultrasonic welding aluminium to magnesium. Mater. Sci. Eng.: A 556, 31–42. doi:10.1016/j.msea.2012.06.055
Schick, D., Suresh Babu, S., Foster, D. R., Dapino, M., Short, M., and Lippold, J. C. (2011). Transient thermal response in ultrasonic additive manufacturing of aluminum 3003. Rapid Prototyping. J. 17, 369–379. doi:10.1108/13552541111156496
Sriraman, M. R., Babu, S. S., and Short, M. (2010). Bonding characteristics during very high power ultrasonic additive manufacturing of copper. Scr. Mater. 62, 560–563. doi:10.1016/j.scriptamat.2009.12.040
Wang, L., Hofmann, V., Bai, F., Jin, J., and Twiefel, J. (2019a). A novel additive manufactured three-dimensional piezoelectric transducer: systematic modeling and experimental validation. Mech. Syst. Signal Process. 114, 346–365. doi:10.1016/j.ymssp.2018.05.025
Wang, Y., Yang, Q., Liu, X., Liu, Y., Liu, B., Misra, R. D. K., et al. (2019b). Microstructure and mechanical properties of amorphous strip/aluminum laminated composites fabricated by ultrasonic additive consolidation. Mater. Sci. Eng. 749, 74–78. doi:10.1016/j.msea.2019.01.039
Zhang, C., Deceuster, A., and Li, L. (2009). A method for bond strength evaluation for laminated structures with application to ultrasonic consolidation. J. Mater. Eng. Perform. 18, 1124–1132. doi:10.1007/s11665-008-9342-1
Zhang, C., and Li, L. (2009). A coupled thermal-mechanical analysis of ultrasonic bonding mechanism. Metall. Mater. Trans. B 40, 196–207. doi:10.1007/s11663-008-9224-9
Zhang, C. S., and Li, L. (2010). Effect of substrate dimensions on dynamics of ultrasonic consolidation. Ultrasonics 50, 811–823. doi:10.1016/j.ultras.2010.04.005
Keywords: ultrasonic consolidation, transfer matrix model, piezoelectric transducer, sonotrode, finite element model
Citation: Wang Y, Chen Z, Yu Q and Cheng F (2021) Modeling of Sonotrode System of Ultrasonic Consolidation With Transfer Matrix Method. Front. Mater. 8:642896. doi: 10.3389/fmats.2021.642896
Received: 17 December 2020; Accepted: 07 January 2021;
Published: 24 February 2021.
Edited by:
Zeyu Chen, Central South University, ChinaReviewed by:
Xiaoniu LI, Nanjing University of Aeronautics and Astronautics, ChinaJun Huang, Jiangsu University, China
Weidong Liu, Hohai University, China
Copyright © 2021 Wang, Chen, Yu and Cheng. This is an open-access article distributed under the terms of the Creative Commons Attribution License (CC BY). The use, distribution or reproduction in other forums is permitted, provided the original author(s) and the copyright owner(s) are credited and that the original publication in this journal is cited, in accordance with accepted academic practice. No use, distribution or reproduction is permitted which does not comply with these terms.
*Correspondence: Yin Wang, eWluLndhbmd5aW5AaHF1LmVkdS5jbg==