 Xuewei Fang
 Guopeng Chen2
 Jiannan Yang
 Ke Huang
- 1The State Key Laboratory for Manufacturing Systems Engineering, Xi’an Jiaotong University, Xi’an, China
- 2National Innovation Institute of Additive Manufacturing, Xi’an, China
- 3China Ship Design & Research Center, Wuhan, China
High-strength 7xxx series aluminum alloys are of great importance for the aerospace industries. However, this type of aluminum alloys has poor processability for most additive manufacturing techniques. In this paper, a newly designed Al–Zn–Mg alloy was used as a feeding wire to fabricate thin wall-shaped samples using the wire and arc additive manufacturing (WAAM) technique. These samples were fabricated based on the cold metal transfer (CMT) process with four different types of arc modes, that is, CMT, CMT-incorporated pulse (CMT + P), CMT-incorporated polarity (CMT + A), CMT-incorporated pulse and polarity (CMT + PA). The optical microscopy, x-ray computed tomography, and scanning electron microscopy equipped with energy-dispersive x-ray spectroscopy (EDS) and electron backscatter diffraction (EBSD) were employed to characterize the microstructure and phase constitution. The results clearly reveal that the porosity varies with the arc modes, and the densest sample with porosity of 0.97% was obtained using the CMT + P mode. The mechanical properties of the fabricated samples are also dependent on the arc modes. The tensile strength and yield strength of the sample manufactured by the CMT + PA arc mode are the highest. In terms of anisotropy, the strength differences in horizontal and vertical direction of the samples made by CMT + PA, CMT + A, and CMT modes are all large, which is mainly ascribed to the pores distributed at the interlayer region.
Introduction
Additive manufacturing process is now an efficient technique to manufacture complex, large-scale parts (DebRoy et al., 2018). Weldability is an important factor to determine whether a metal is suitable for additive manufacturing (Oliveira et al., 2020). However, there are only a limited number of materials that exhibit good weldability, e.g., Ti6Al4V, Inconel 718, and AlSi10Mg (Kuo et al., 2017; Aboulkhair et al., 2019; Liu and Shin, 2019). Among these alloys, aluminum alloys are widely used in aerospace, aircraft, and automotive fields because of their good combination of light weight, high strength, and good ductility.
AlSi10Mg is, currently, the most suitable aluminum alloy for laser-based additive manufacturing process (Rosenthal et al., 2014; Girelli et al., 2019). However, its mechanical properties cannot meet most of the aerospace requirements (Martin et al., 2017). Attempts have been made to fabricate high-strength aluminum alloys such as 7xxx series by selective laser melting (SLM) (Wang et al., 2017; Uddin et al., 2018). However, microcracks are often inevitable, due to their high solidification shrinkage and high susceptibility to liquation cracking in the fast cooling procedure (Montero-Sistiaga et al., 2016; Stopyra et al., 2020). Wire and arc additive manufacturing (WAAM), which is a variation of the direct energy deposition (DED) technology, uses an electric arc as the heat source to melt the metal wires layer by layer to form the near net shape three-dimensional (3D) components. This technique has been adopted to fabricate high-strength 7xxx aluminum since its high reflectivity of laser during SLM is no longer an issue. Cong et al. (2015) discussed the current research status of the WAAM technology and the future development trend. Cong et al. (2015) investigated the effect of the arc mode on the Al-6.3Cu alloy and proved that porosity is efficiently controlled by the low heat input. Generally, the mechanisms of pore formation were classified into the following: gas pores induced by hydrogen, which shows the sphere morphology, and the tortuous surface induced by solidification shrinkage (Cong et al., 2015). Ding et al. (2015) fabricated 7055-Al by WAAM to investigate its processability, mechanical properties, and microstructure evolution. 7055-Al shows quite good processability and medium tensile strength. However, the analysis of defects and their correlation with microstructure and mechanical properties are left unexploited. Klein et al. (2020) studied the Al–Zn–Mg–Cu alloy with a high-magnesium element and low-zinc element. It proved that this type of aluminum has a good deposition feasibility by WAAM (Klein et al., 2020). A similar aluminum alloy was investigated by Morais et al. (2020) and this aluminum alloy shows quite a high strength after heat treatment. Li et al. (2020) studied the Al–Zn–Mg alloy fabricated by the WAAM technique. The mechanical properties, microstructure, and pores distribution were tested and discussed; it was proved that the deteriorated mechanical properties, as compared to the forging counterparts, are related to the loss of the zinc and magnesium element as vapor, and the porosity clearly decreases the strength of the WAAM samples (Li et al., 2020, 2021). However, the detailed porosity, microstructure, and phase constitution in the high Zn/Mg ratio aluminum fabricated by WAAM remain uncertain.
In this paper, a new high-strength Al–Zn–Mg alloy with a high Zn/Mg ratio was designed and used to fabricate samples by the WAAM technique using four different arc modes associated with the different heat input. The microstructure and chemical composition of the samples were carefully characterized by scanning electron microscopy (SEM)/energy-dispersive x-ray spectroscopy (EDS)/electron backscatter diffraction (EBSD); x-ray CT was employed to examine the porosity in 3D, while tensile tests along both the horizontal and vertical direction of the fabricated samples were conducted to measure their mechanical properties. The correlation between the microstructure and second-phase particles, and the heterogeneous porosity of these four types of samples with mechanical properties are discussed in detail.
Materials and Methodology
Materials and Samples Preparation
The chemical compositions of the Al–Zn–Mg feeding wire and the basal material 5083 aluminum plate are listed in Table 1, which were determined by inductively coupled plasma optical emission spectroscopy (ICP-OES). The diameter of the feeding wire is 1.2 mm, and the dimension of the base metal plate is 300 × 300 × 12 mm.
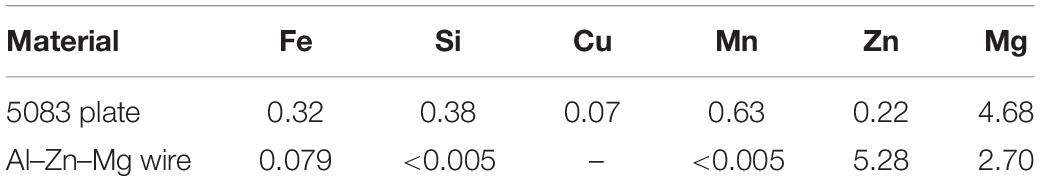
Table 1. Chemical compositions of basal metal and filler wire (wt.%).
The as-deposited samples were prepared layer by layer by the WAAM manufacturing equipment, which consists of a KUKA robot, a Fronius cold metal transfer (CMT) advanced welding machine, and a welding platform. The base metal was a 12 mm-thick 5083-H112 plate. Before deposition, the basal metal was champed on the welding platform. Then, the oxide layer of the basal metal surface was removed by a grinder and then cleaned with acetone solution. The welding machine can produce four kinds of arc modes: pure CMT, the CMT process–incorporated pulse (CMT + P), the CMT process–incorporated polarity (CMT + A), and the CMT process–incorporated pulse and polarity (CMT + PA). The WAAM deposition parameters are listed in Table 2. The thin wall-shaped samples with a size of 220 × 85 × 8 mm were fabricated layer by layer with a 120s interval between layers. The metallographic samples were cut along the building direction, and dog-bone samples along the horizontal and vertical direction were cut by a wire electrical discharge machine for the tensile test, as shown in Figure 1.
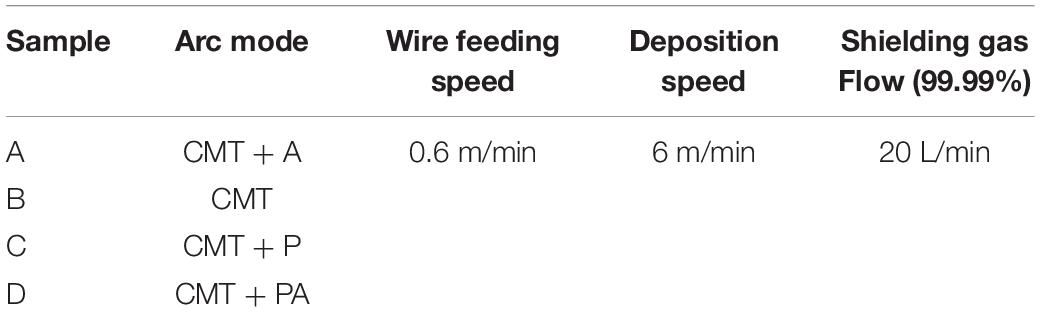
Table 2. Wire and arc additive manufacturing (WAAM) deposition parameters of the four samples.
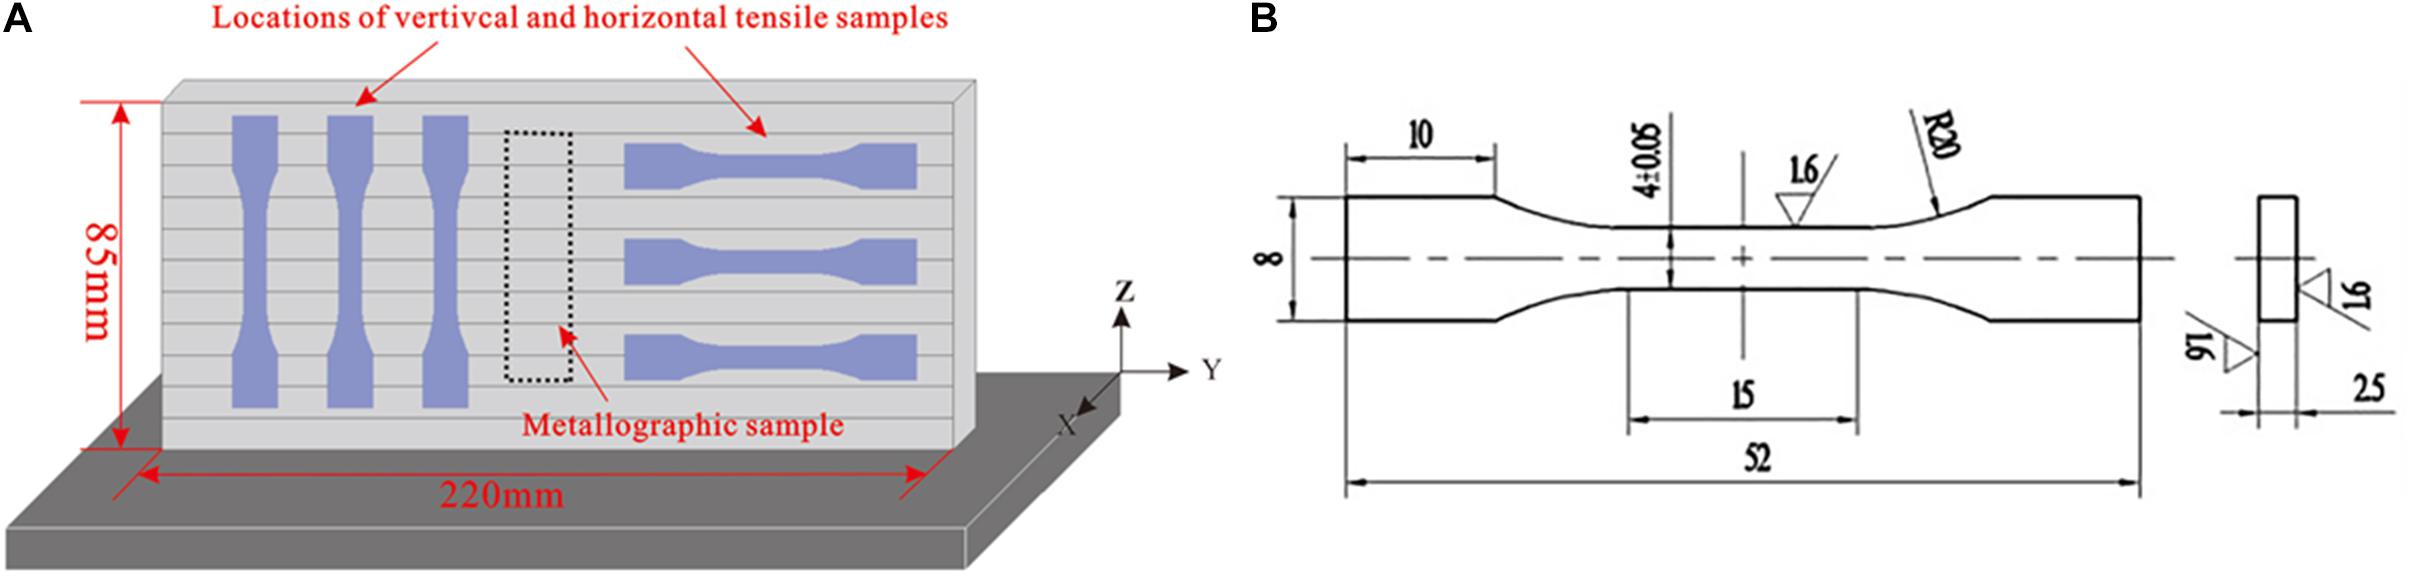
Figure 1. (A) Schematic of the sampling positions and (B) the dimensions of tensile sample.
Microstructure Characterization and Mechanical Testing
To detect the porosity of the fabricated WAAM samples, the x-ray CT (GE v| tome| x m) was employed to examine micropores distribution in the samples. Samples for microstructure characterization were grounded by a grit paper from 400# to 2000#, and then polished to a mirror facet through a standard metallographic procedure. The samples were etched by Keller’s reagent for optical microstructure observation both in horizontal and vertical directions. Samples were further mechanically polished for the SEM-EDS analysis (SEM, JEOL-IT500) to obtain the microstructure, phase distribution, and chemical composition of phases. The EBSD (SEM, JEOL 7900F) samples were prepared by the electropolish method using a voltage of 30V for a duration of 88 s with the electrolyte composed of 10% perchlorate alcohol solution. The tensile tests were conducted using the INSTRON 5983 machine with a strain rate of 0.00025 s–1.
Results
Heat Input
The heat input of the four modes is quite different, and the calculation method is presented in Reference Fang et al. (2018). The heat input has a significant impact on the formation of microstructures and phase constitution (Su et al., 2019). The heat input of these four types of arc modes can be calculated by the following equation:
where HI is heat input, U is voltage, I is current, t is time, and TS is the travel speed. The calculated heat input of the different arc modes is 206.3, 172.8, 162.1, and 121.3 J/mm in the CMT, CMT + P, CMT + A, and CMT + PA arc modes, respectively. It can be seen that the largest and lowest heat input are CMT and CMT + PA, respectively.
Micropores Distribution
Figure 2 depicts the micropore morphologies of the as-deposited sample with four different arc modes. The pores in all types of samples are close to spherical, and large pores in the CMT + A mode can be clearly seen, while the pore size in the CMT + PA sample is clearly much smaller than the other samples.
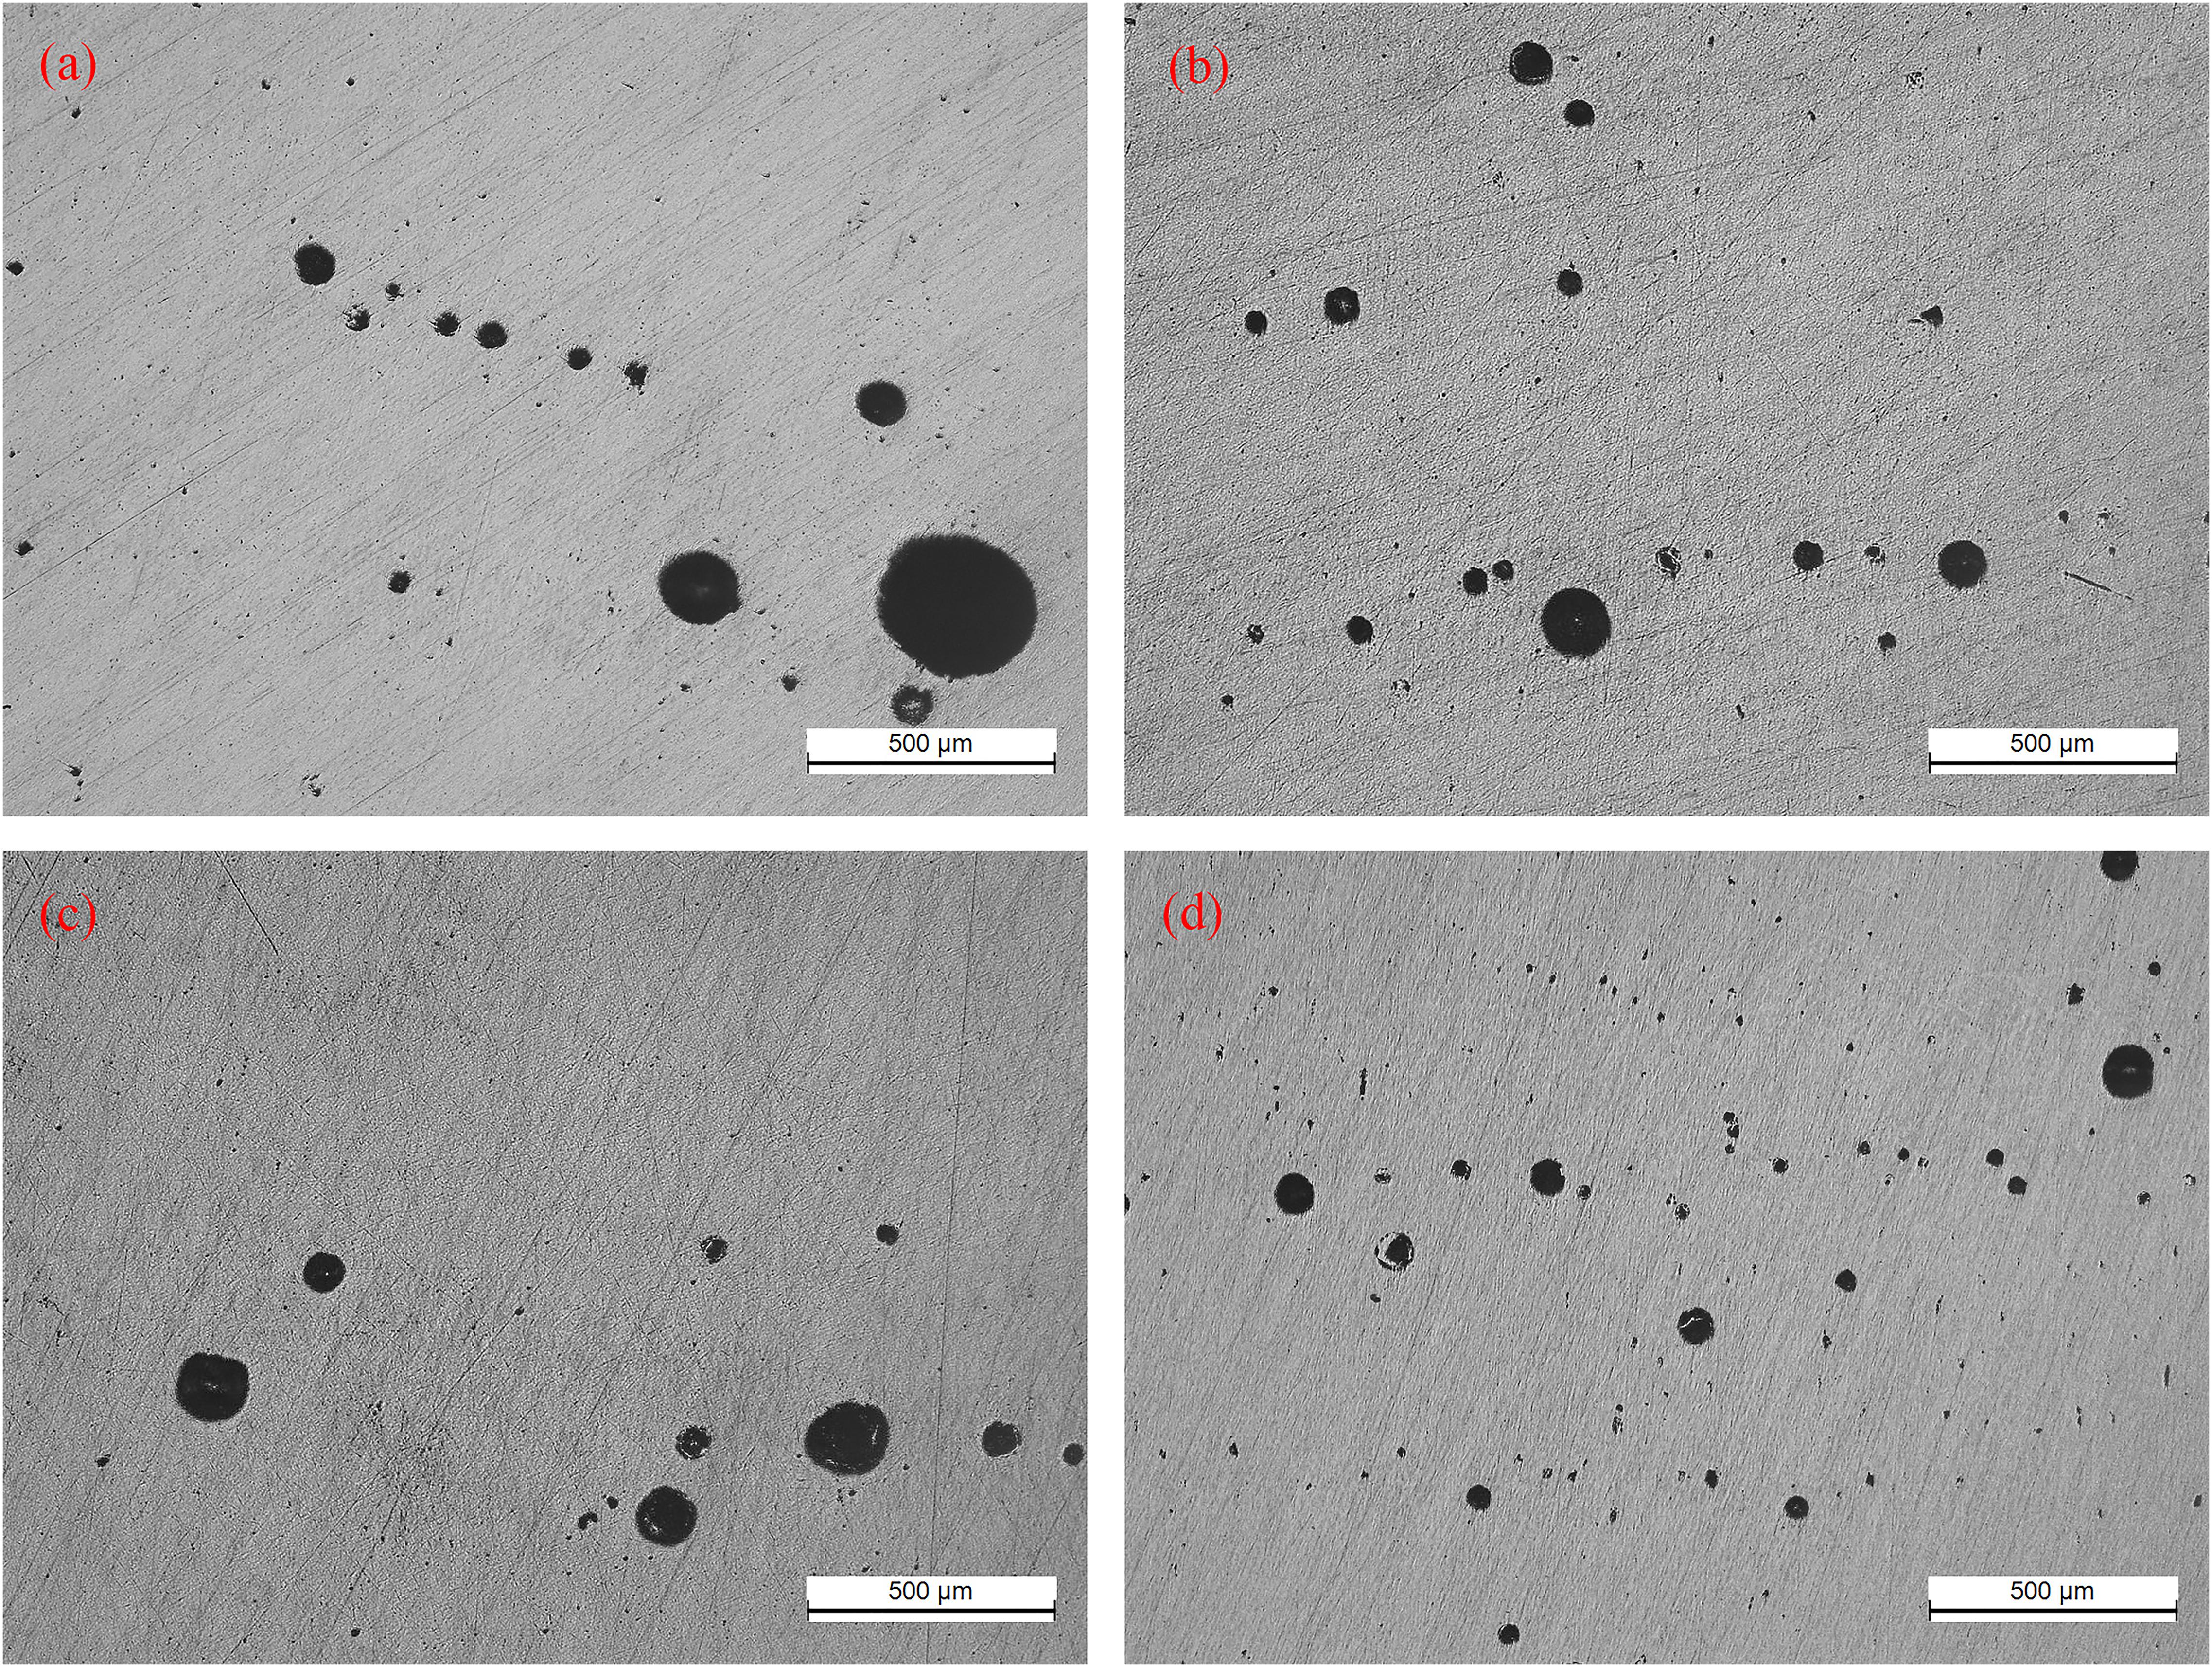
Figure 2. Porosity morphology in (a) CMT + A, (b) CMT, (c) CMT + P, and (d) CMT + PA samples. CMT, cold metal transfer; CMT + A, cold metal transfer–incorporated polarity; CMT + P, cold metal transfer–incorporated pulse; and CMT + PA, cold metal transfer–incorporated pulse and polarity.
To further analyze the pores, the x-ray CT was employed to obtain the 3D distribution of pores in Figure 3. It can be clearly seen that the micropores mainly distribute at each interlayer zone, while the micropores at the innerlayer zone are quite small. The total volume ratio of pores is 2.07, 1.84, 1.76, and 0.97% in CMT, CMT + A, CMT + P, and CMT + PA samples, respectively. This proved that the arc mode has a significant effect on reducing pores in the samples. And the pulse and polarity arc modes have a positive effect in reducing the pore defects (Cong et al., 2015).
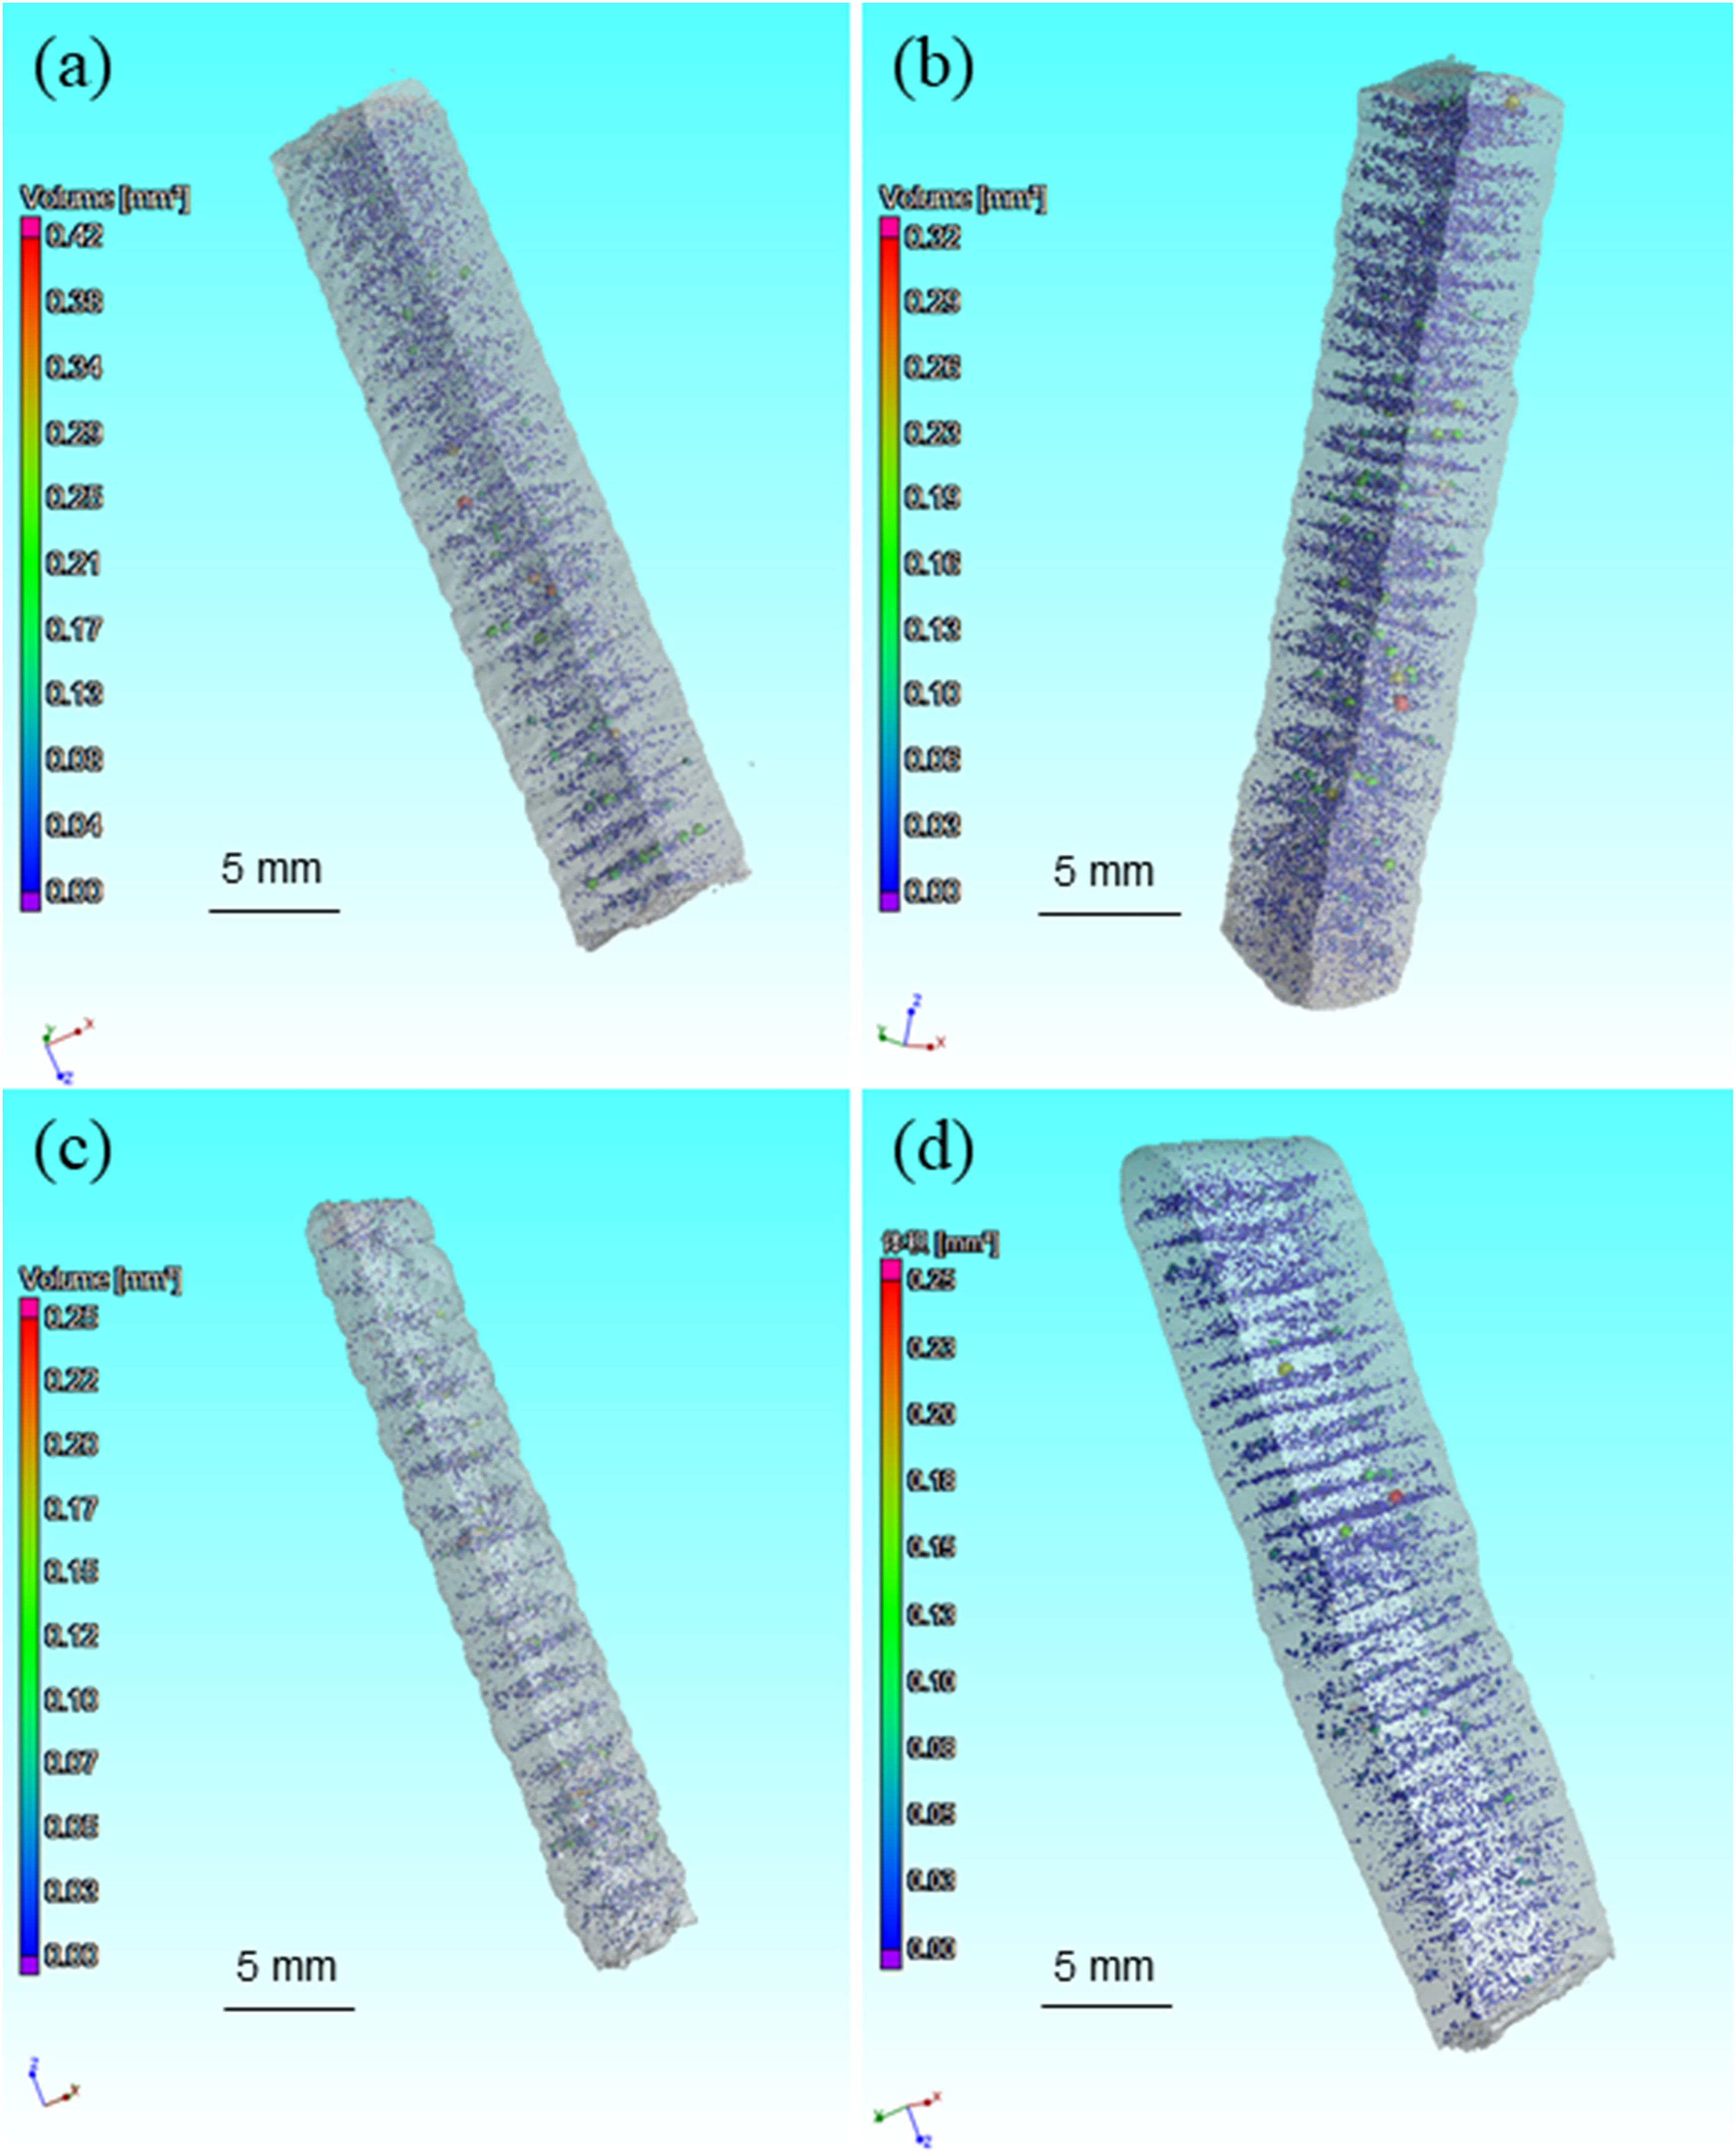
Figure 3. Porosity distribution, 3D-morphology, and location inside the as-deposited samples (a) CMT + A, (b) CMT, (c) CMT + PA, and (d) CMT + P. CMT, cold metal transfer; CMT + A, cold metal transfer–incorporated polarity; CMT + P, cold metal transfer–incorporated pulse; and CMT + PA, cold metal transfer–incorporated pulse and polarity.
Microstructure Characterization
The mechanical properties of the as-deposited samples always depend on the microstructural changes and elemental distribution after experiencing an abrupt and cyclic thermal history. Figure 4 displays the microstructures of these four samples along the vertical and horizontal sections from optical microscope (OM). These micrographs show the typical solidification characteristics of both the columnar dendritic and equiaxed dendritic structures. Each deposited layer can be divided into the interlayer and center regions. The grain structures in the four samples show a small difference. The grain structures of these four samples are all of equiaxed shape in the horizontal section, while nearly columnar structures are observed in the vertical section in the CMT and CMT + P sample. There are fine equiaxed grain regions at the interlayer region in CMT + A and CMT + PA samples, while the interlayer fine-grained regions are not obvious in the CMT + P and CMT samples. The grain size in the CMT + PA sample in the vertical section and horizontal section is almost the same, which is beneficial to eliminate the potential anisotropy of the material.
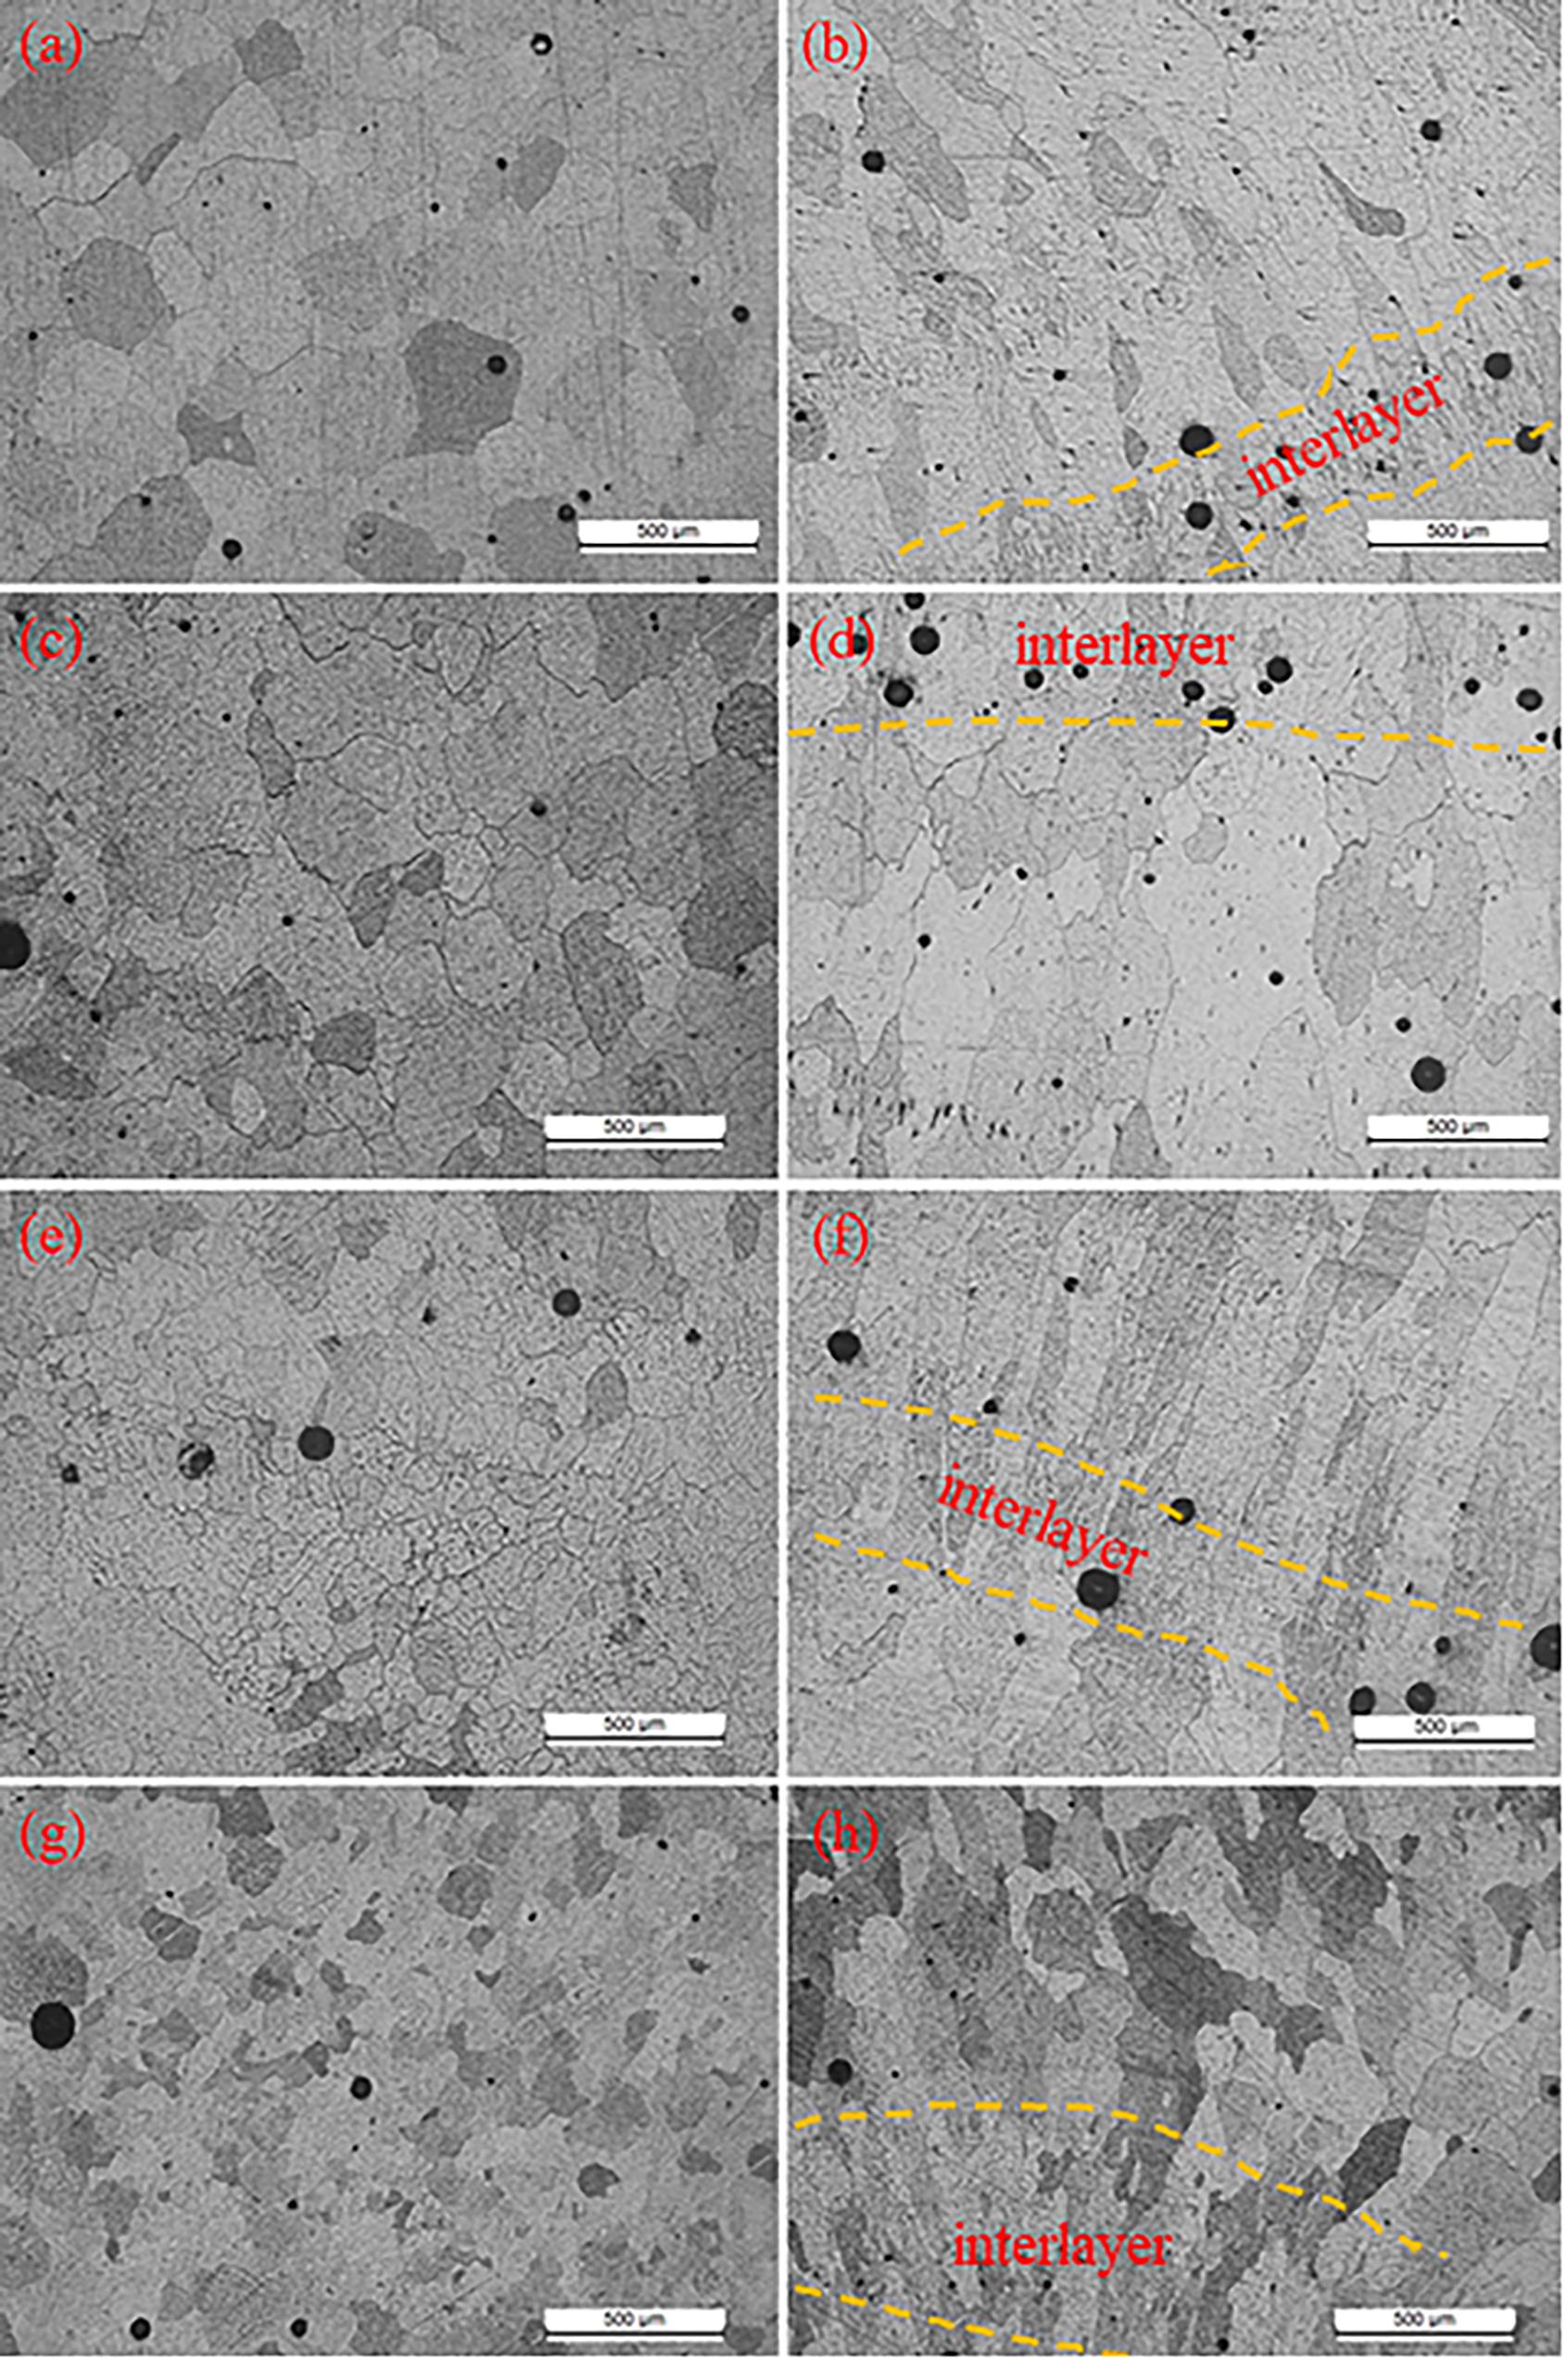
Figure 4. Optical microstructure of these four samples in the horizontal and vertical section: (a) horizontal, (b) vertical section of the CMT + A mode, (c) horizontal and (d) vertical section of the CMT mode, (e,f) CMT + P mode, and (g,h) CMT + PA mode. CMT, cold metal transfer; CMT + A, cold metal transfer–incorporated polarity; CMT + P, cold metal transfer–incorporated pulse; and CMT + PA, cold metal transfer–incorporated pulse and polarity.
Element Distribution and Phase Constitution
It is widely accepted that the high strength of the 7075 alloy is mainly ascribed to a series of second-phase particles such as typical nanosize of η(MgZn2) (Davis, 1993). The solute contents and particles change significantly during WAAM, which plays an important role in the microstructure and mechanical properties variation.
Figure 5 exhibits the constituted second-phase particle distribution of the four as-deposited samples observed using the SEM. It can be seen from Figure 5a that most of the particles, with a rod-like morphology and an average size of less than 5 μm, distribute inside the α-Al matrix. In the four samples, the second-phase particles in CMT + A and CMT + P samples have a tendency to aggregate into a band-like distribution at the interlayer zone along the fusion line, as indicated by the yellow dotted line in Figures 5b,c. On the other hand, these white particles in the CMT + PA sample are almost uniformly distributed.
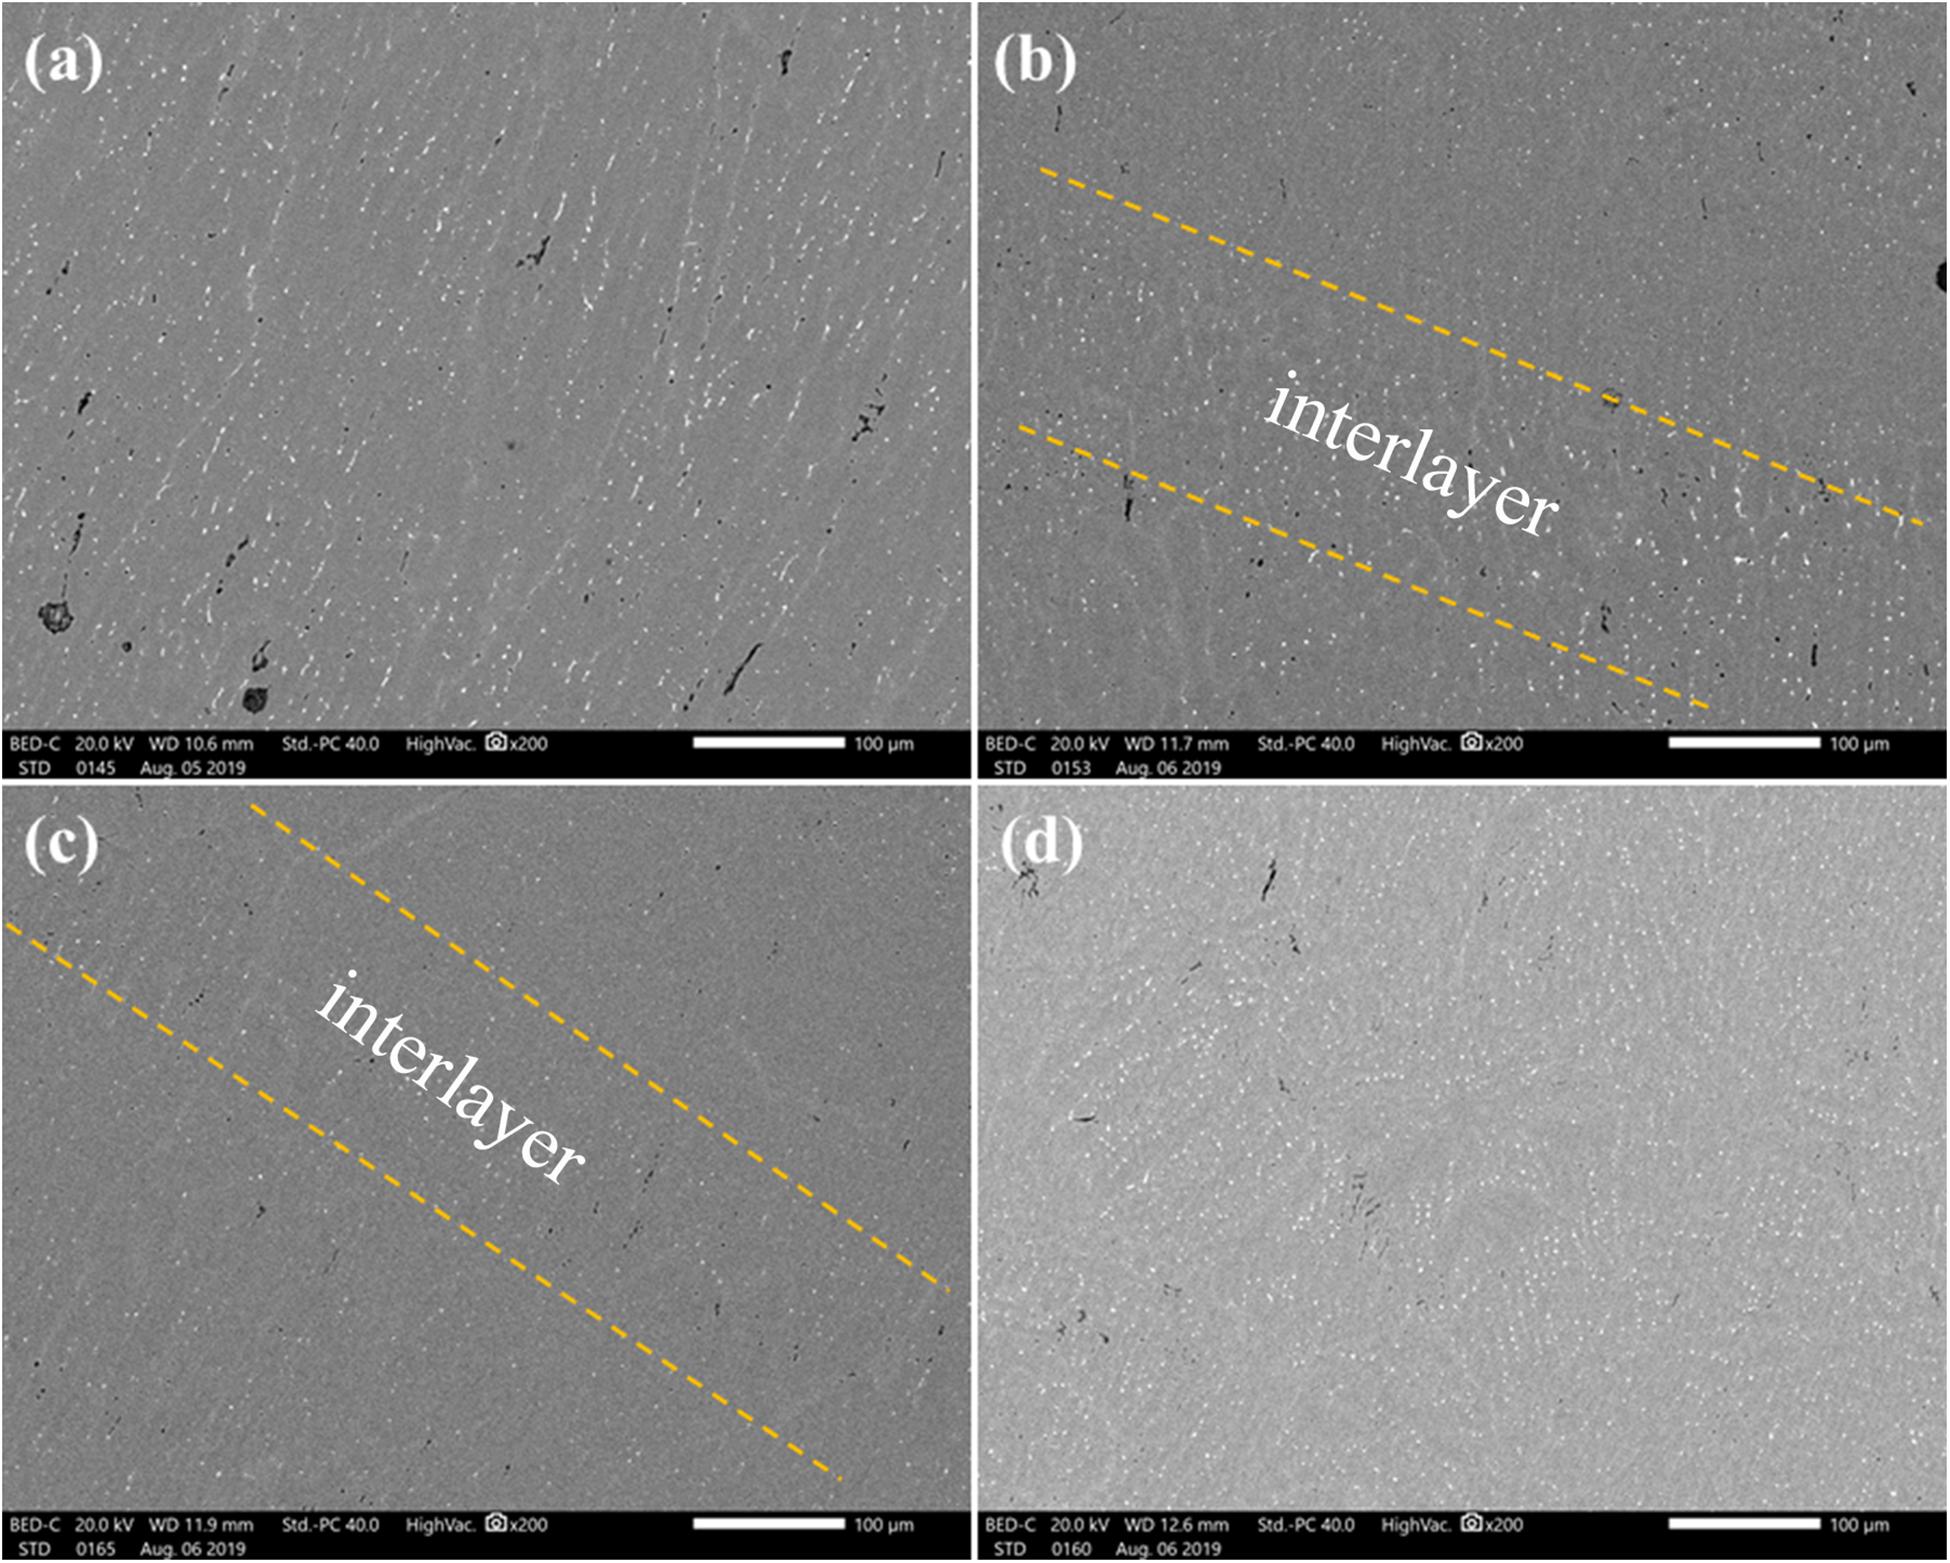
Figure 5. BSE maps of the precipitation distribution in the as-deposited sample along the vertical direction (a) CMT, (b) CMT + A, (c) CMT + P, and (d) CMT + PA. CMT, cold metal transfer; CMT + A, cold metal transfer–incorporated polarity; CMT + P, cold metal transfer–incorporated pulse; and CMT + PA, cold metal transfer–incorporated pulse and polarity.
The backscattered-electron (BSE) images are shown in Figure 6 to reveal more details of the fine and coarse particles. The morphology of the particles is mainly influenced by the alloy composition and cooling conditions, and different cooling conditions result in different morphologies. It can be seen in Figure 6b that some white particles in higher magnification show a net-like eutectic structure. These particles are most likely divorced eutectic particles formed during the final stage of cooling (Liu et al., 2019).
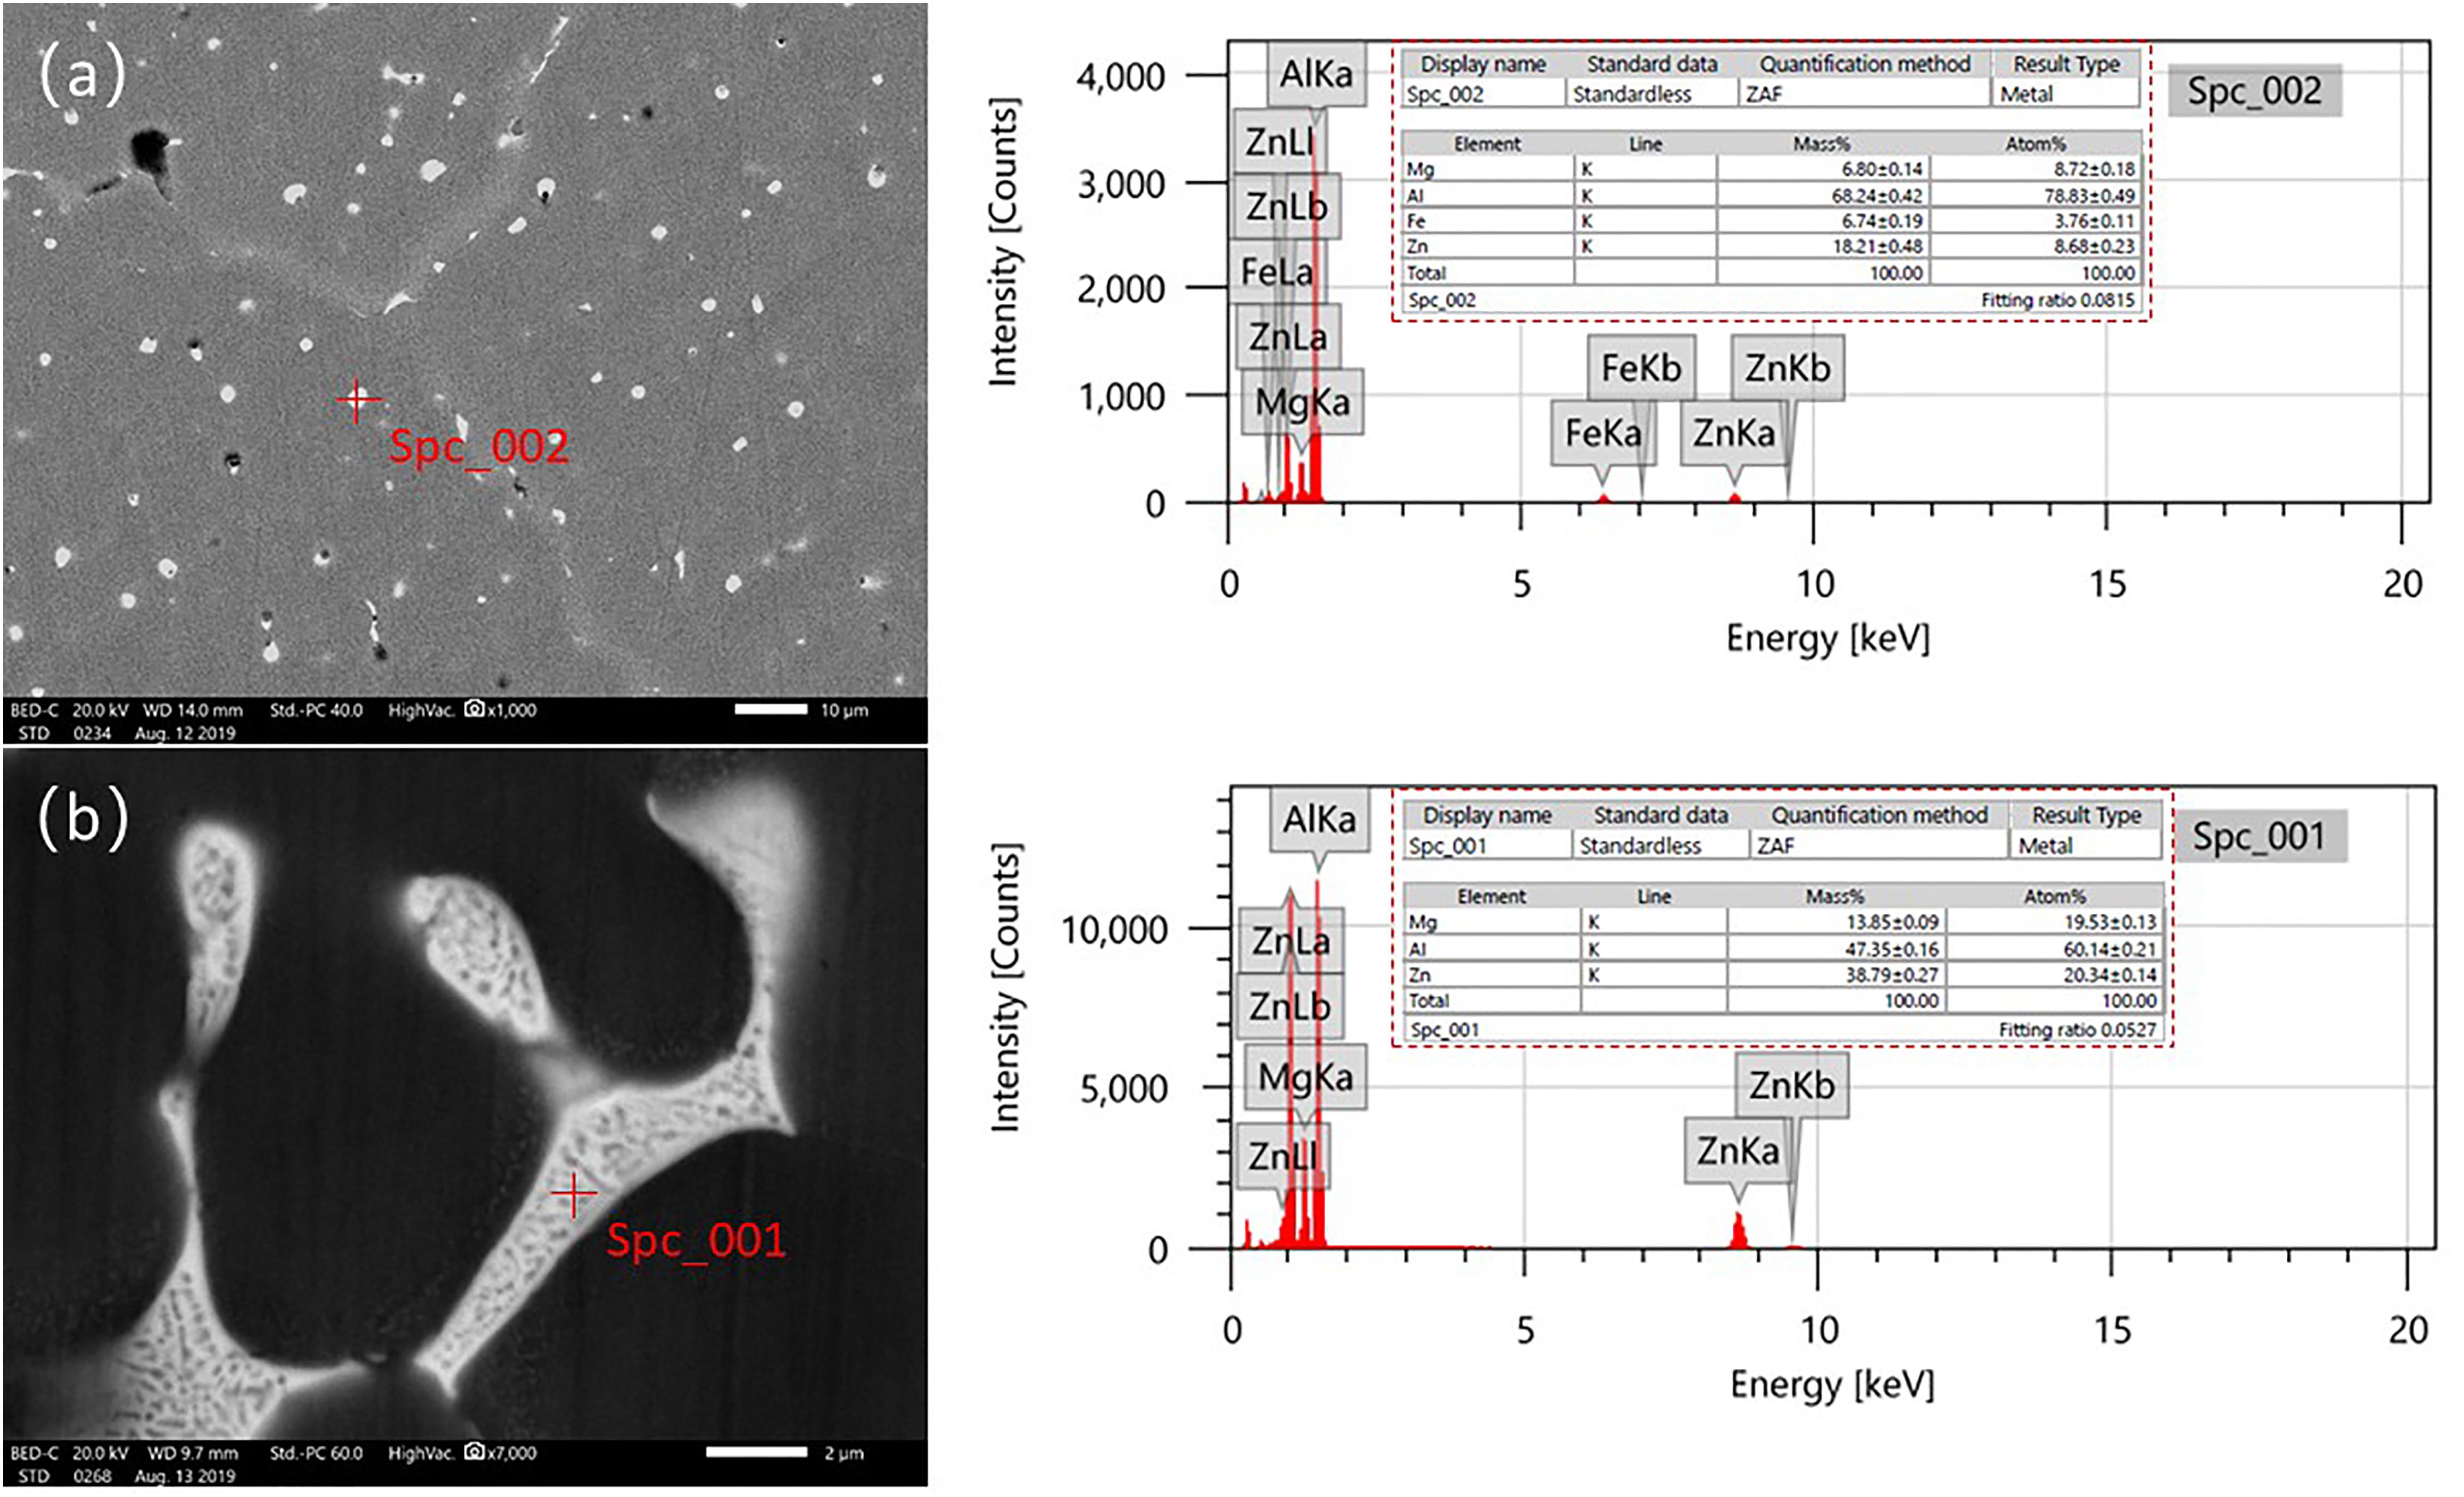
Figure 6. (a) Particle morphology and spatial distribution in as-deposited CMT + PA sample and EDS analysis of the round particle and (b) eutectic structure of the white particle and its corresponding EDS analysis. EDS, energy-dispersive x-ray spectroscopy and CMT + PA, cold metal transfer–incorporated pulse and polarity.
To further analyze the phase constitution of the white particles, EDS was performed on both the fine and coarse particles. The results show that the content of Zn and Mg in the α-Al matrix is 4.73wt.% and 1.78wt.%, respectively. Some of these fine white particles contain a large amount of Zn and only a little Fe, as shown in Figure 6a. Its chemical composition is 6.8wt.%Mg, 68.24wt.%Al, 6.74wt.%Fe, and 18.21wt.%Zn. This Fe-containing particle is considered to be detrimental to the strength of the material (Barbagallo et al., 2004). The composition of the coarse eutectic white particle is mainly Al, Mg, and Zn elements. The content of each element is 60.14, 19.53, and 20.34%, respectively (see Figure 6b), which are likely to be Al–Mg–Zn ternary compounds.
Mechanical Properties
The stress–strain curves and mechanical properties of the four as-deposited samples are shown in Figure 7. The overall mechanical properties, in terms of both strength and elongation, of the CMT + PA sample are the highest, while the tensile strength and yield strength of the CMT + A sample are the lowest. The mean value of horizontal and vertical tensile strength in the CMT + PA mode is 316.3 and 280.9 MPa, respectively, and the yield strengths are 258.3 and 238.1 MPa, respectively. The tensile strengths of the vertical and horizontal sample in the CMT + A mode are 210.6 and 227.4 MPa, and the yield strength is 205.9 and 212.3 MPa, respectively, which is the lowest among these samples. Except for the samples of the CMT + P mode, the vertical and horizontal mechanical properties are quite different in the other modes. The elongation of CMT + A is lower than other samples, which is 3% in the vertical direction and 4.2% in the horizontal direction, respectively, while the CMT + PA sample has an elongation of >6.2% in all samples.
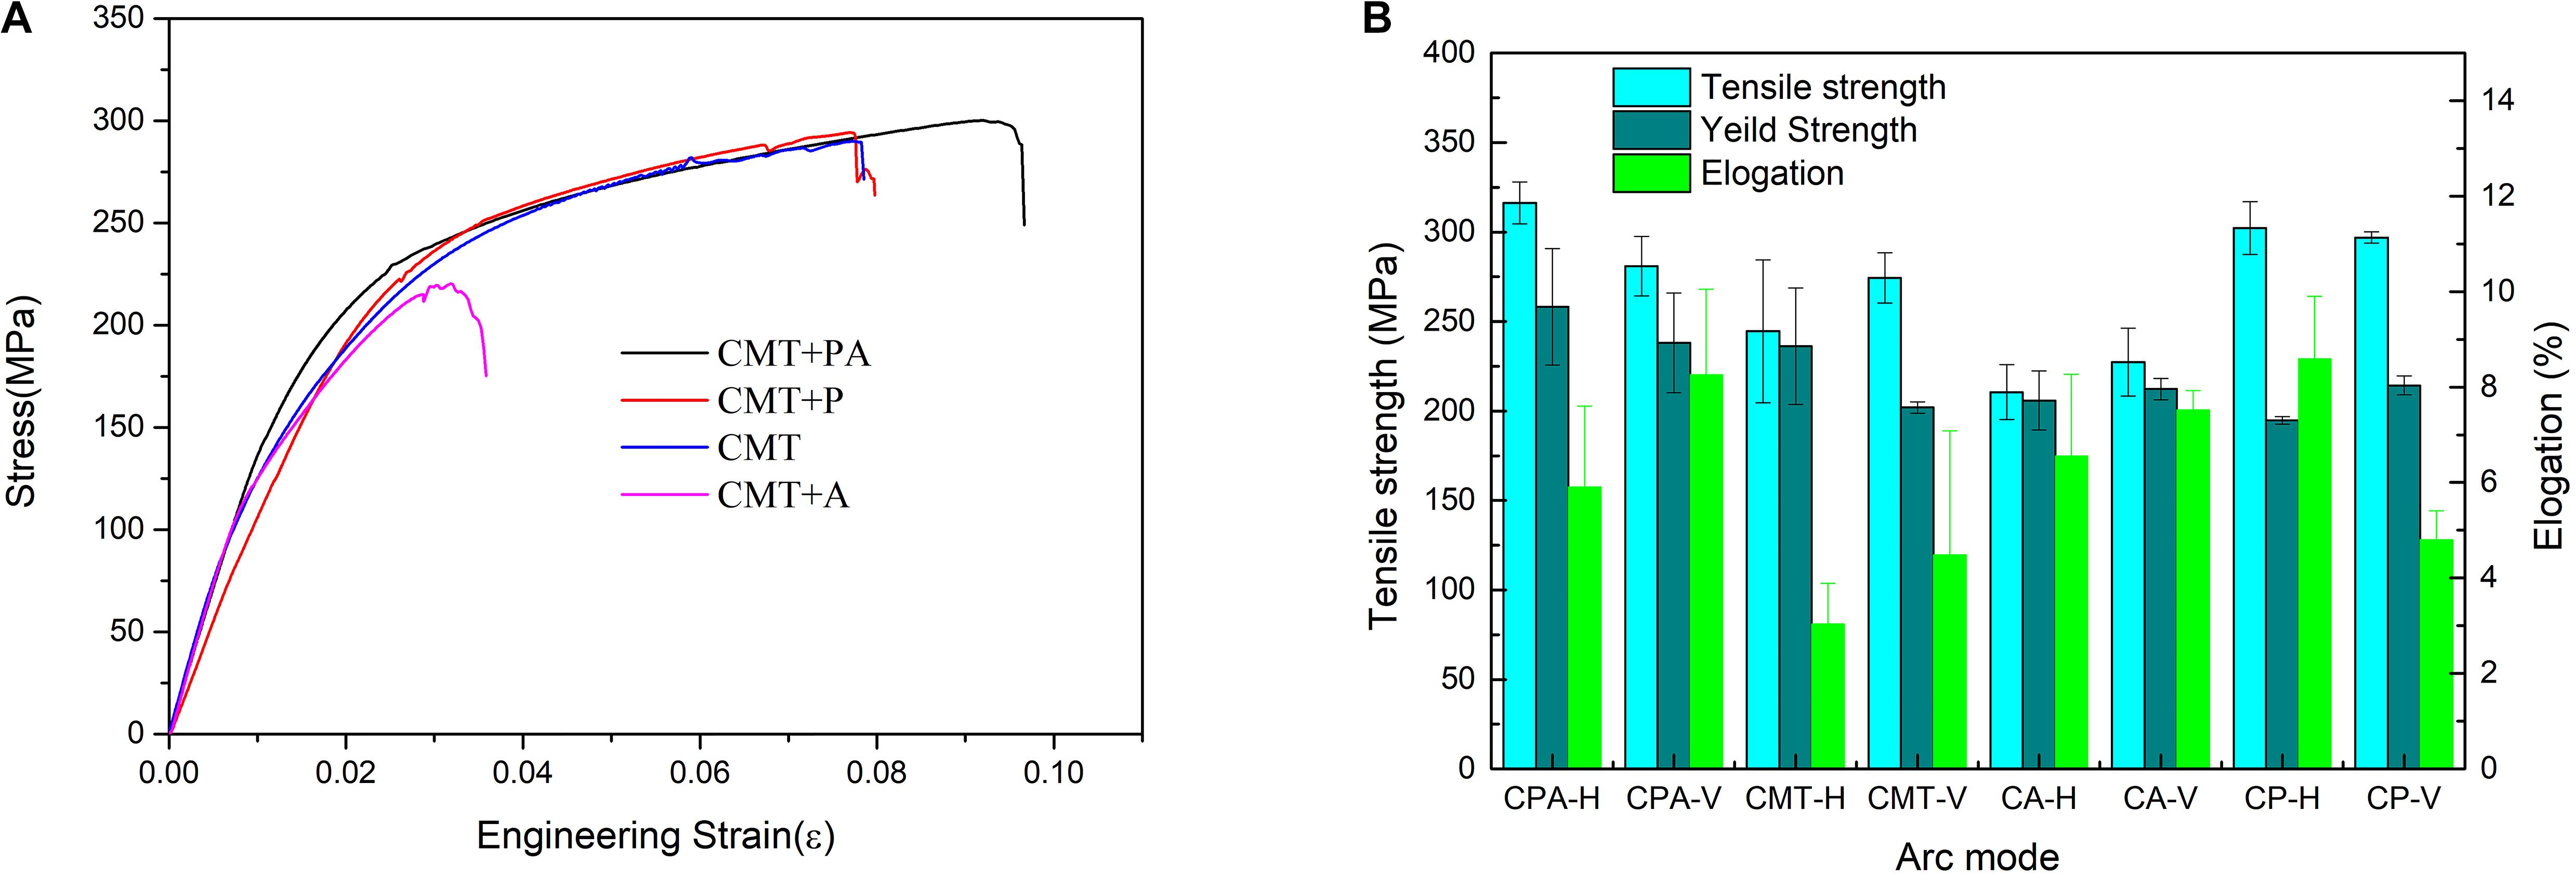
Figure 7. (A) Tensile curves and (B) histogram of the tensile strength of the four samples.
Discussion
Formation Mechanism of Porosity
The gas pores and lack of fusion pores are easily produced in additive manufacturing of metallic materials (DebRoy et al., 2018). The morphology of the gas pore is usually spherical, and the lack of the fusion pore is typically irregular. Since the majority of pores are spherical (see Figures 2, 3), it can be concluded that the lack of fusion is not the main reason for the formation of pores. Normally, the most considerable factor of gas pore formation during additive manufacturing (AM) of the aluminum alloy is hydrogen element (Wu et al., 2013), but the entrapment of metal vapor also plays an important role. In the feeding wire, the content of Zn is 5.28wt.%, and the boiling point of Zn is 907°C, which is much lower than that of the Mg (1090°C) and Al (2518°C) element. Table 3 lists the main chemical composition of these four samples. It can be clearly seen that the zinc element has reduced at least ∼0.5wt.% after WAAM. This means that zinc has vaporized in the deposited process. Therefore, zinc evaporation must have contributed to the gas pore formation. It is, therefore, reasonable to assume that these pores are a mixture of hydrogen gas pores and zinc evaporation pores. The fact that most of the gas pores are located near the interlayer region is unambiguously demonstrated from the x-ray CT, as presented in Figure 3. This non-uniformly distributed porosity should be held responsible for the anisotropic mechanical properties of the as-deposited samples, as will be detailed later.
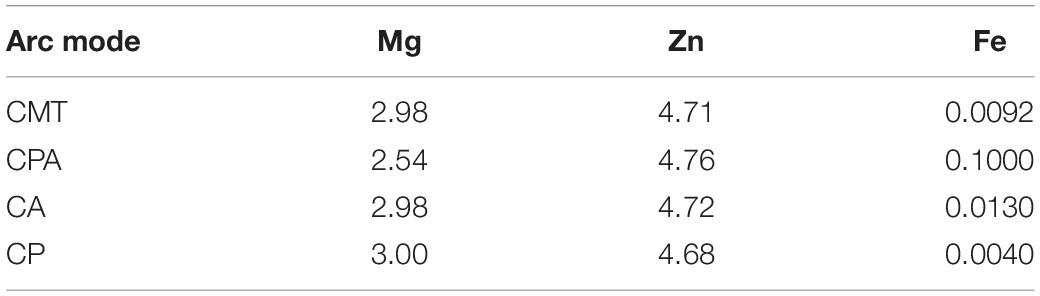
Table 3. Chemical compositions of the as-deposited samples obtained by inductively coupled plasma (ICP).
Microstructure and Second-Phase Particles
To further analyze the grain morphology and crystallographic texture, the inverse pole figure (IPF) EBSD maps of the CMT + PA and CMT samples were used, which are presented in Figures 8a–h. The effect of the arc mode on the grain morphology and grain size is evident. Equiaxed grain structure can be seen in the interlayer center region of the CMT + PA sample, while grains at the inner layer region show a larger grain size. Characteristic columnar structure is present at the inner layer region, and equiaxed grains can be seen at the interlayer region in the CMT, CMT + P, and CMT + A samples. The aspect ratio of the columnar grain in CMT, CMT + P, CMT + A, and CMT + PA samples is 3.4, 3.08, 2.88, and 2.31, respectively. The average grain size in the inner layer regions of CMT, CMT + P, CMT + A, and CMT + PA are 88, 78, 68.3, and 58.9 μm, respectively. It is, further, proved that the reduced heat input has a positive effect on columnar to equiaxed transition and decreasing the grain size; this is probably due to the fact that a faster cooling rate can be achieved at reduced heat input. Figure 9 displays the pole figures of the CMT + PA and CMT samples. Although CMT + PA shows a lower maximum texture intensity (8.53) than that of the CMT sample (13.28), crystallographic texture was produced both in the CMT sample and CMT + PA sample. This means the crystallographic texture is not the dominating reason for the differences in the mechanical properties of the CMT + PA and CMT samples.
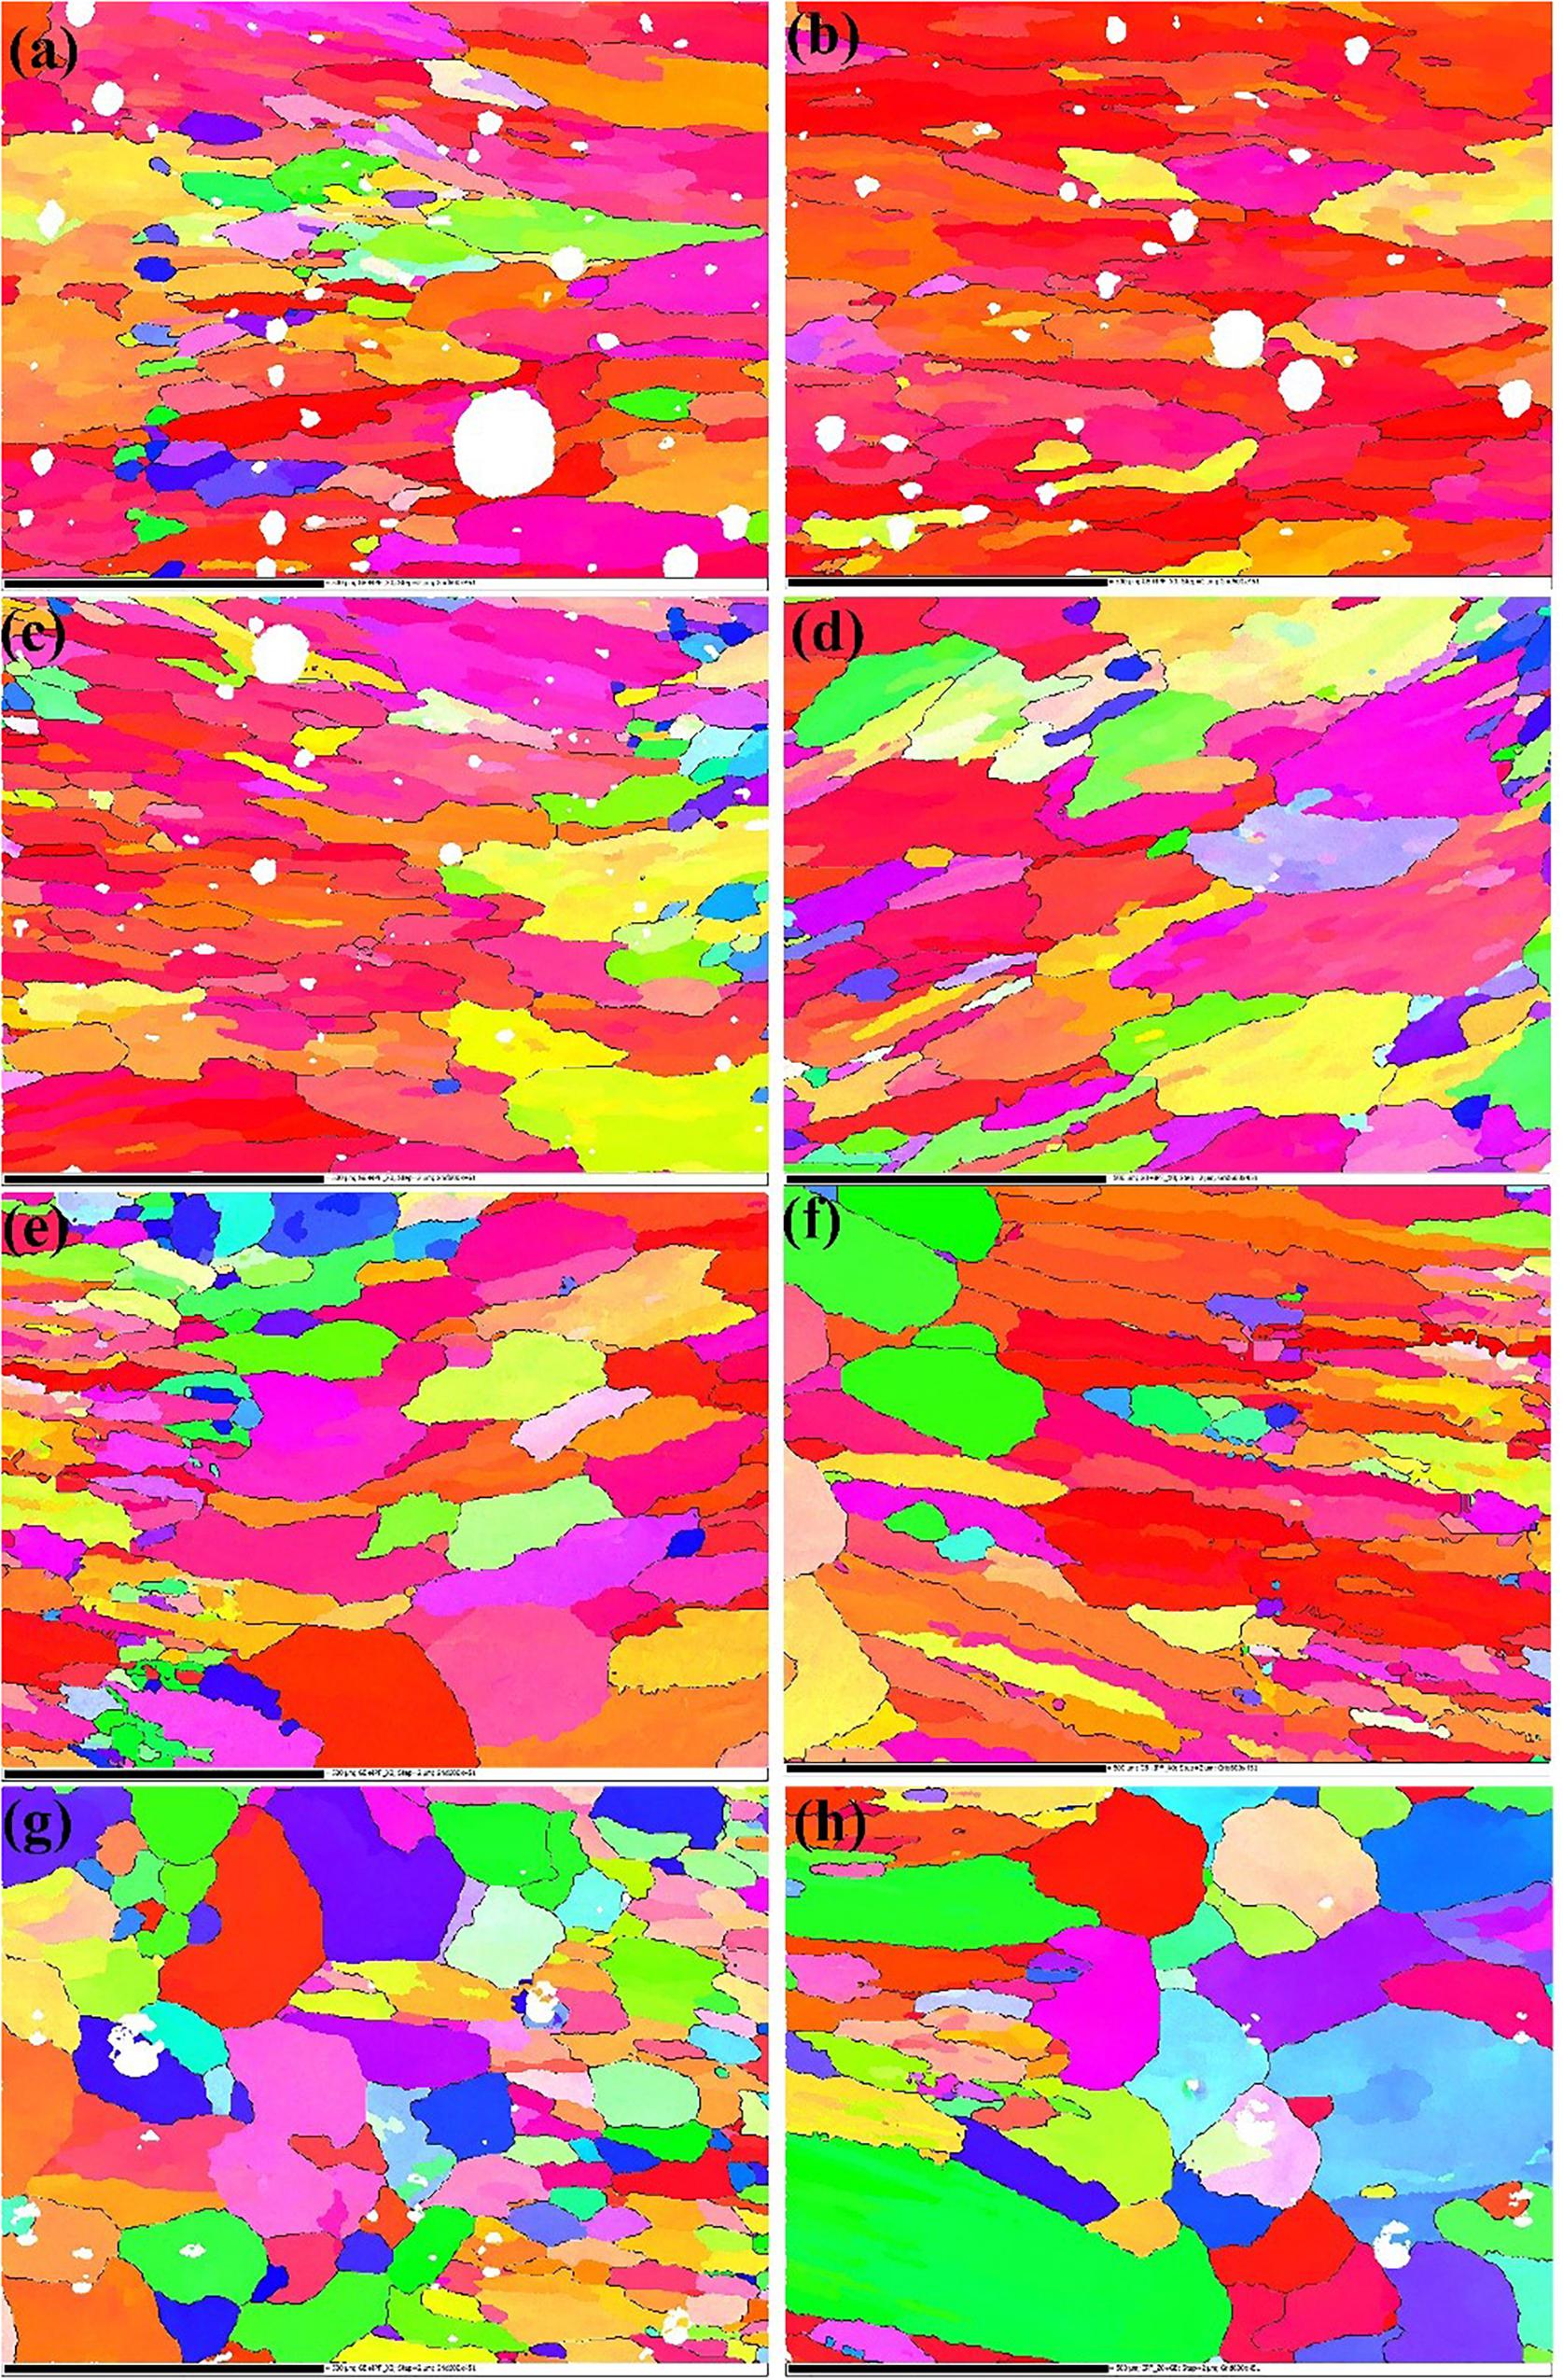
Figure 8. The center and interlayer region IPF maps of these four samples: (a) center region of the CMT sample, (b) interlayer region of the CMT sample, (c) center region of the CMT + P sample, (d) interlayer region of the CMT + P sample, (e) center region of the CMT + A sample, (f) interlayer region of the CMT + A sample, (g) center region of the CMT + PA sample, and (h) interlayer region of the CMT + PA sample. CMT, cold metal transfer; CMT + A, cold metal transfer–incorporated polarity; CMT + P, cold metal transfer–incorporated pulse; CMT + PA, cold metal transfer–incorporated pulse and polarity, and IPF, inverse pole figure.
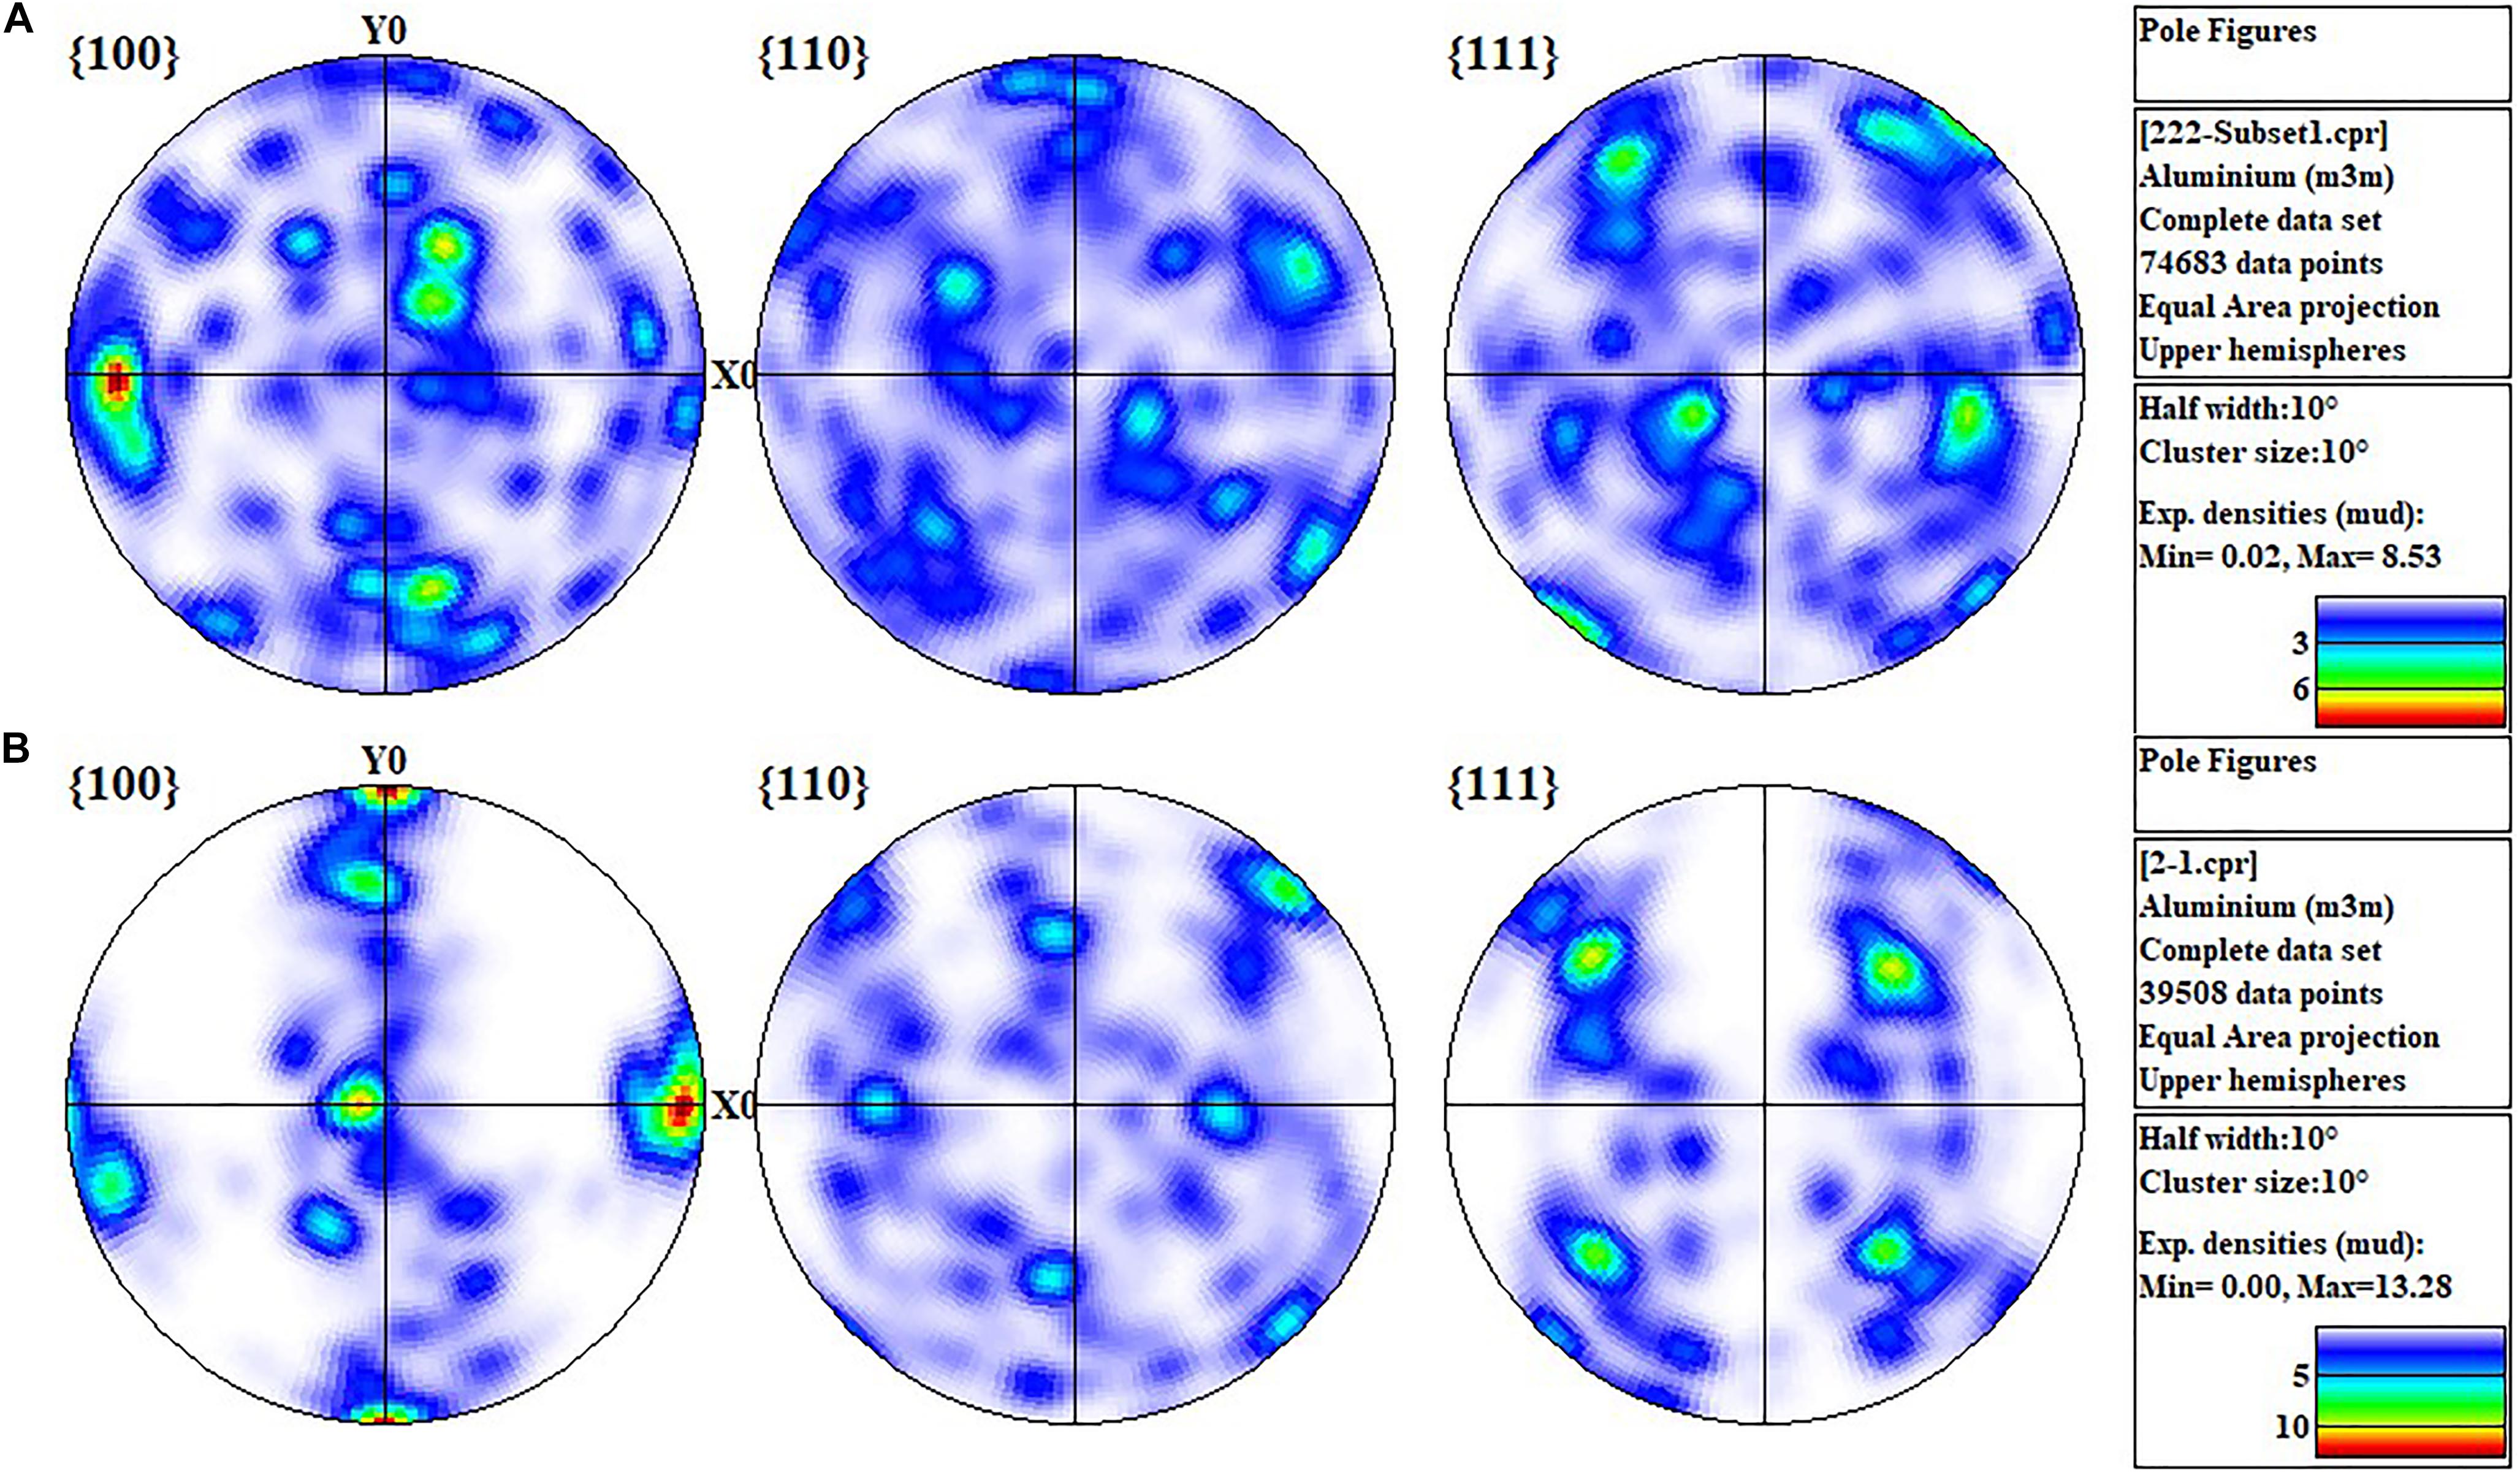
Figure 9. (A) Pole figure of CMT + PA and (B) pole figure of CMT. CMT, cold metal transfer and CMT + PA, cold metal transfer–incorporated pulse and polarity.
The arc mode also affects the status of the second-phase particles in the as-deposited samples. As shown in Figure 6, the second-phase particles may aggregate into a band-like distribution at the interlayer zone along the fusion line or being uniformly distributed, depending on the arc modes. Based on the Al–Zn–Mg ternary system, it can be concluded that the α-Al phase was the first to grow in the molten pool, since it developed a dendritic morphology (Liang et al., 1998). The liquid surrounding the solid–liquid interface was enriched with a solute (Zn and Mg). These solute elements cannot diffuse evenly due to the rapid solidification during the WAAM process. Therefore, the chemical composition of the retained liquid eventually reached the eutectic point in the ternary system; phases such as MgZn2, τ-Al2Mg3Zn3 intermetallic compounds and (α + τ-Al2Mg3Zn3) eutectic structure can be formed, as echoed in Reference Alvarez et al. (2005). According to the EDS energy spectrum results and the chemical composition of the wire filler, it is inferred that the coarse second-phase particles may be the (α-Al + τ-Al2Mg3Zn3) (Suarez et al., 2009).
Mechanical Properties
The strengthening of the aluminum alloy mainly includes solid solution strengthening, dispersion strengthening, and work hardening. The EDS energy spectrum shows that most Zn and Mg elements are dissolved into α-Al; the zinc content also increases from 4.13wt.% to 4.7wt.% in the α-Al phase under a different heat input; this contributes to the solid solution strengthening. The size of the constituent second phase in the deposited material is basically in the scale of 5 μm, as shown in Figures 6, 7. Due to their large sizes, their contribution to the strength is very limited (Huang et al., 2018). During the cyclic heating and cooling process, some nanoscale second-phase dispersion and precipitation are expected, which may contribute to the strength improvement of the samples (Fang et al., 2021). It should be noted that the high strength of 7xxx alloys depends on the massive nanoscale precipitates after an appropriate solid solution and aging heat treatment; this is not covered here since it will be the topic of our next paper. The microstructure for the four samples shows inhomogeneous grains and heterogeneous distribution of precipitated particles. The grain sizes are within the range of ∼88 to ∼58.9 μm with various arc modes; the scale of grain refinement is too small to introduce significant grain boundary strengthening (Ding et al., 2015).
It should be noted that the porosity also significantly affects the mechanical properties of the as-deposited aluminum alloys (Zhou et al., 2020; Fang et al., 2021). The strength differences in the horizontal and vertical directions of the as-deposited samples are related to the heterogeneous distribution of pores at the interlayer, as shown in Figure 3 from the x-ray CT. The fracture surfaces after the tensile testing are helpful to explain the fracture behavior; only the fractography of the sample fabricated by CMT + PA is further explained here. As shown in Figure 10, the fracture is mainly a mixture of the brittle fracture morphology and local plastic characteristics regardless of the horizontal or vertical direction. The brittle fracture of the samples is characterized by the intergranular brittle fracture with the dimple gliding surface (Figures 10b,d). The dimples are shallow and of small size (∼5 μm), as pointed out by the red arrow. This explains the low fracture elongation of the as-deposited samples. Besides, there are many pores distributed on the fracture surface. The interlayer pores can be clearly seen in Figure 10a (horizontal direction, as indicated by the red dotted lines), while pores are scattered in the vertical direction (Figure 10c, as indicated by the red dotted circles). This implies that microcracks may preferentially originate from these pores at the interlayer zone, and then these microcracks propagate and join together to form macrocracks until fracture takes place in the vertical direction. Therefore, the strength in the vertical direction is generally inferior to that of the horizontal direction in CMT + PA, CMT, and CMT + P sample. The porosity ratio in CMT + P is lower than that in the CMT + PA sample; this could be an explanation to the similar tensile strength in the horizontal and vertical direction. However, the pore accumulation at the interlayer zone in CMT + PA may cause the lower strength in the vertical direction. Even though the CMT + A sample has the lowest porosity, large pores (as illustrated in Figure 3) could be the main reason for its low tensile strength.
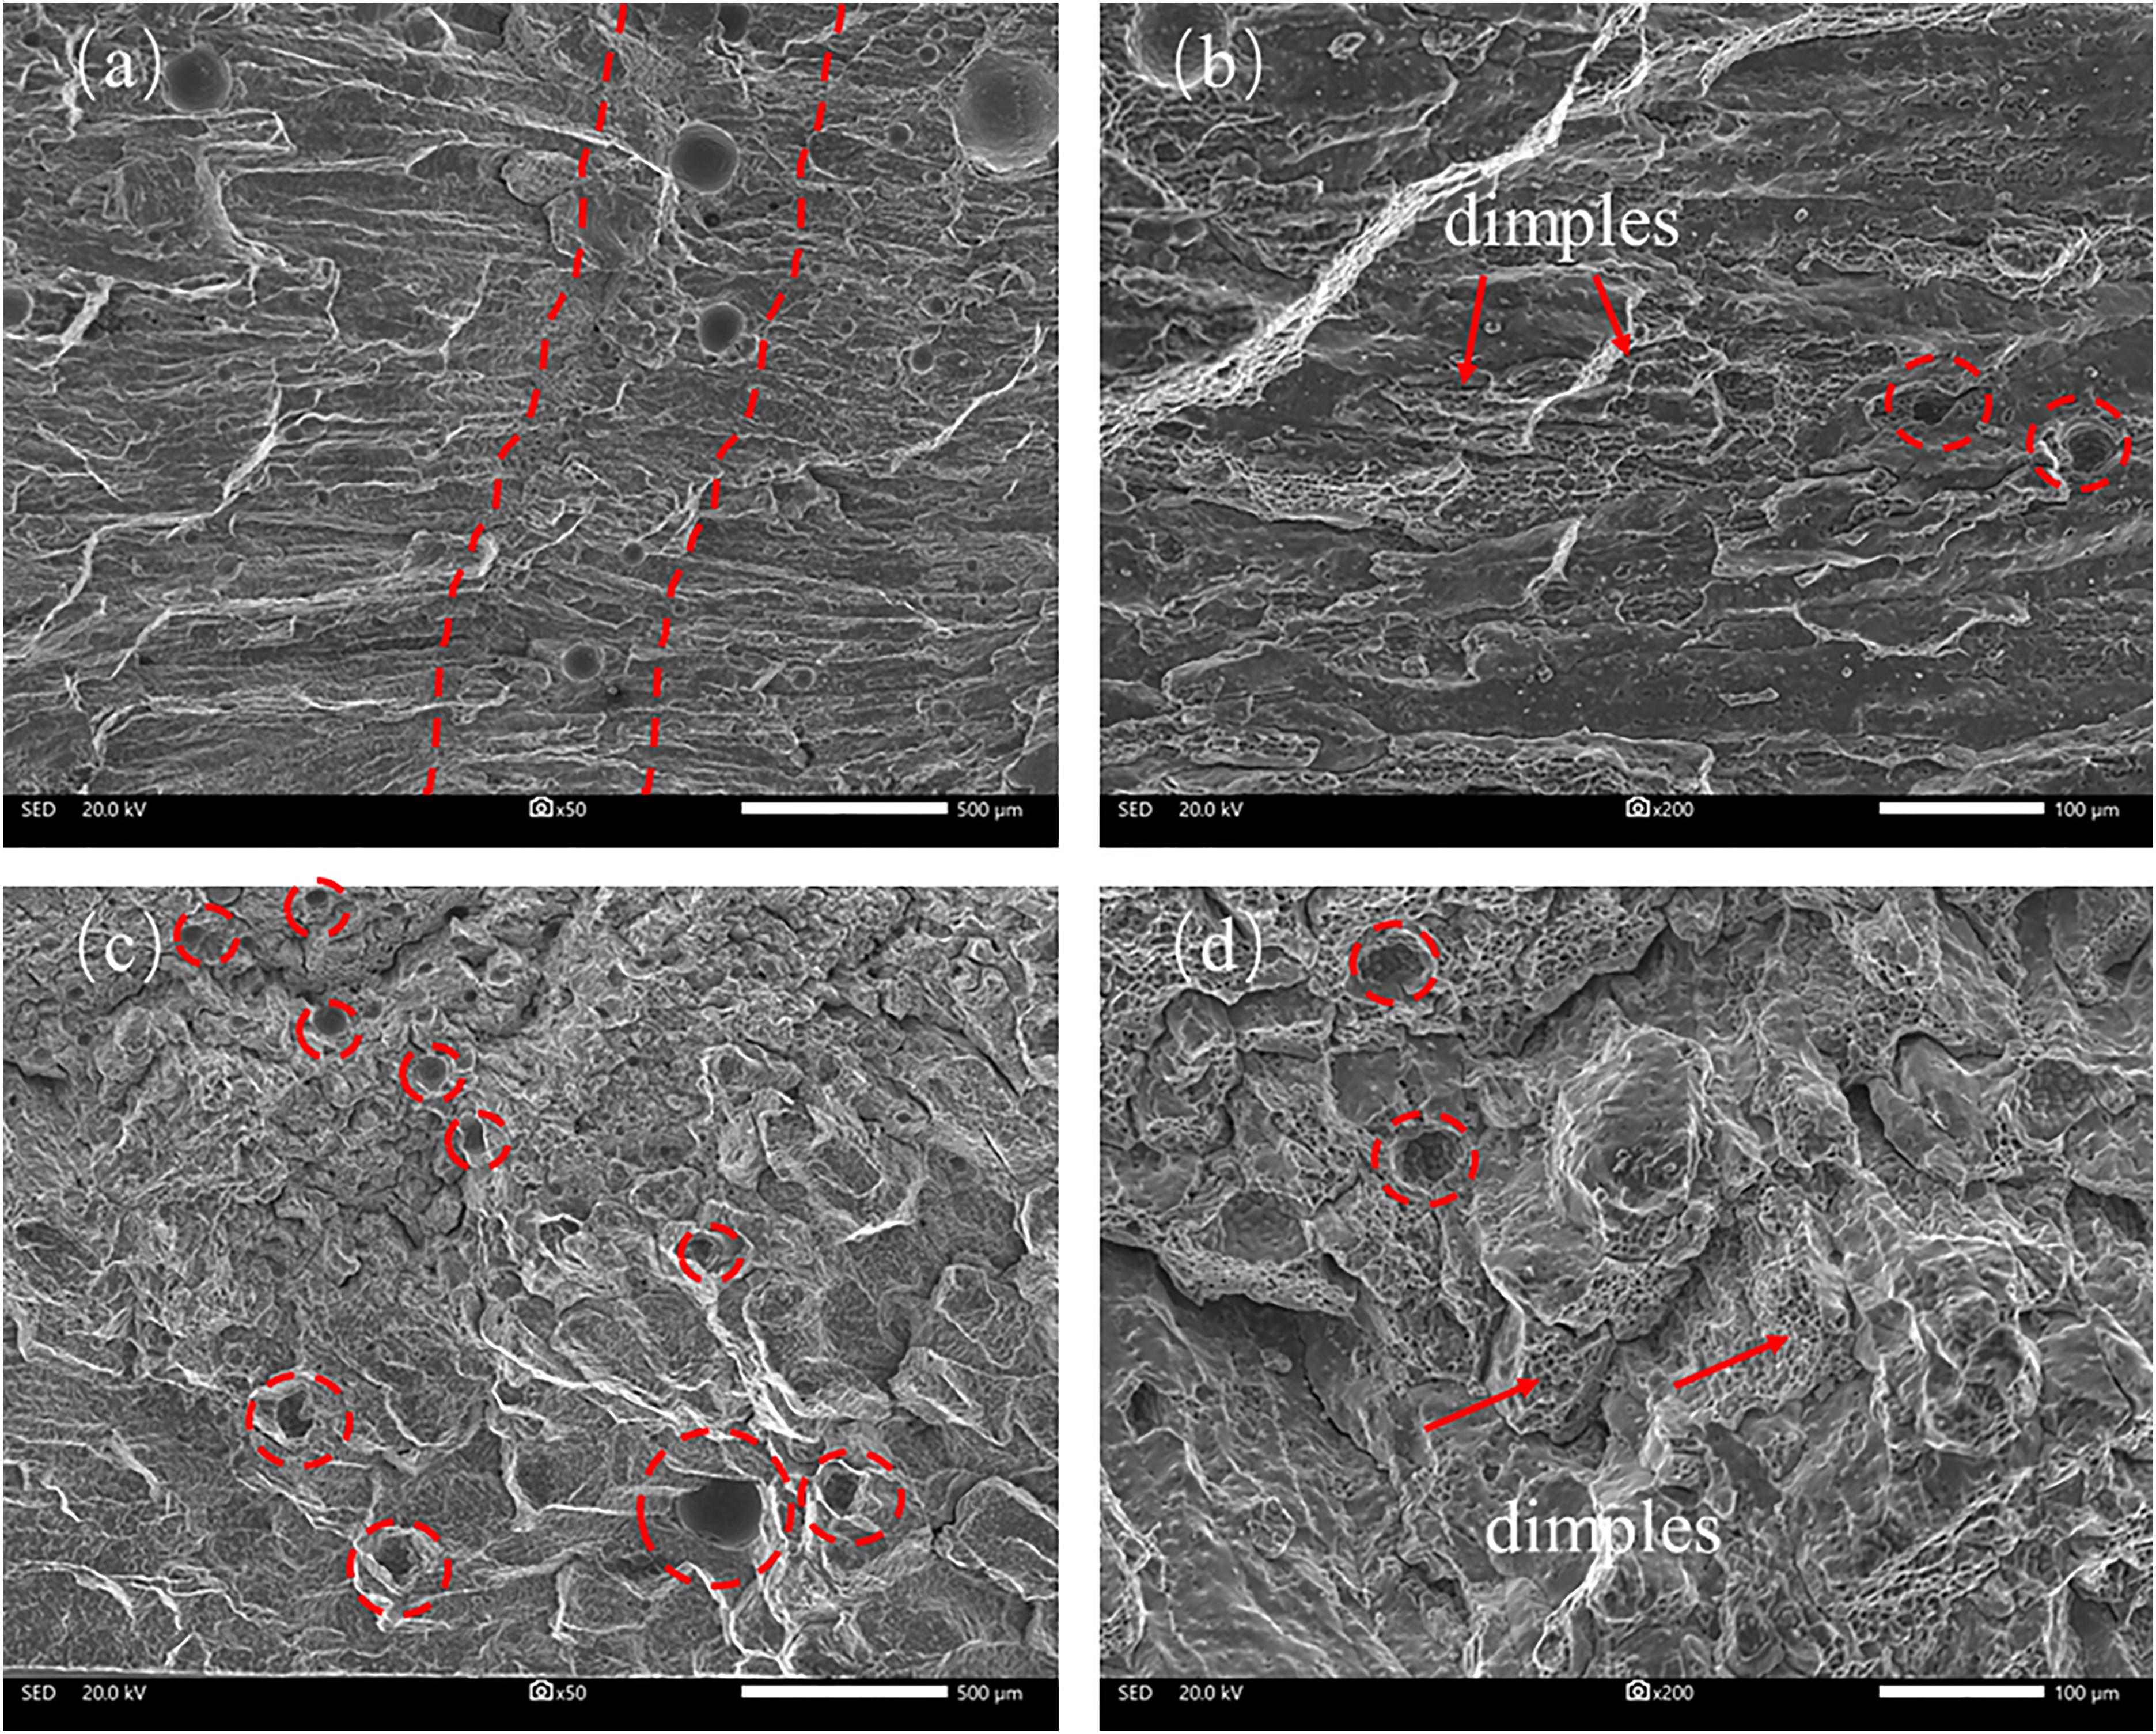
Figure 10. Fracture morphology of the CMT + PA sample along the horizontal direction (a) low-magnification and (b) high-magnification photo and the vertical direction (c) low-magnification and (d) high-magnification photo. CMT + PA, cold metal transfer–incorporated pulse and polarity.
Generally, heat treatment is an indispensable step to increase the strength of the Al–Zn–Mg alloy. The work presented in this article is mainly a preliminary exploration of fabricating a high-strength Al–Zn–Mg component using the WAAM technology. Ongoing work will focus on tailoring the chemical composition of this alloy for the WAAM process, as well as reducing the porosity and performing appropriate heat treatment to improve the mechanical properties of Al–Zn–Mg materials.
Conclusion
The Al–Zn–Mg alloy was successfully fabricated without a hot crack by WAAM. The correlation between the microstructure, second-phase particles, porosity, and mechanical properties was exploited. The following conclusion can be drawn:
(1) The heat input has a non-negligible influence on the microstructure and porosity of the Al–Zn–Mg alloy. Columnar grains tend to transform into equiaxed grains when the heat input is reduced.
(2) The pores in the as-deposited sample are dominated by gas pores. This type of porosity mainly consists of hydrogen gas pores and zinc vapor pores. The volume fraction of pores is reduced because of heat input decreasing.
(3) The tensile and yield strength of the CMT + PA sample show the optimum tensile properties among the samples fabricated by different arc modes. The mechanical anisotropy can be ascribed to the accumulated pores near the interlayer region. The fracture shows a mixture of the brittle fracture morphology with local plastic characteristics. The difference in strength along the horizontal and vertical directions is most likely caused by the heterogenous interlayer pores.
Data Availability Statement
The original contributions presented in the study are included in the article/supplementary material, further inquiries can be directed to the corresponding author/s.
Author Contributions
XF: methodology, investigation, and writing. GC: investigation, writing, and editing. JY: review and editing. YX: conceptualization and resources. KH: supervision, review, and editing. BL: project administration and supervision. All authors: contributed to the article and approved the submitted version.
Funding
This work was supported by the National Key Research and Development Program of China (Grant No. 2018YFB1105803), the China Postdoctoral Science Foundation (Grant No. 2019M663682), and the Fundamental Research Funds for the Central Universities (xzd012019033).
Conflict of Interest
YX was employed by company China Ship Design & Research Center.
The remaining authors declare that the research was conducted in the absence of any commercial or financial relationships that could be construed as a potential conflict of interest.
References
Aboulkhair, N. T., Simonelli, M., Parry, L., Ashcroft, I., Tuck, C., and Hague, R. (2019). 3D printing of Aluminium alloys: additive manufacturing of aluminium alloys using selective laser melting. Prog. Mater. Sci. 106:100578. doi: 10.1016/j.pmatsci.2019.100578
Alvarez, O., Gonzalez, C., Aramburo, G., Herrera, R., and Juarez-Islas, J. A. (2005). Characterization and prediction of microstructure in Al-Zn-Mg alloys. Mater. Sci. Eng. A 402, 320–324. doi: 10.1016/j.msea.2005.05.022
Barbagallo, S., Laukli, H. I., Lohne, O., and Cerri, E. (2004). Divorced eutectic in a HPDC magnesium-aluminum alloy. J. Alloy Compd. 378, 226–232. doi: 10.1016/j.jallcom.2003.11.174
Cong, B., Ding, J., and Williams, S. (2015). Effect of arc mode in cold metal transfer process on porosity of additively manufactured Al-6.3% Cu alloy. Int. J. Adv. Manuf. Tech. 76, 1593–1606.
DebRoy, T., Wei, H. L., Zuback, J. S., Mukherjee, T., Elmer, J. W., and Milewski, J. O. (2018). Additive manufacturing of metallic components-process, structure and properties. Prog. Mater. Sci. 92, 112–224.
Ding, D., Pan, Z., Cuiuri, D., and Li, H. (2015). Wire-feed additive manufacturing of metal components: technologies, developments and future interests. Intern. J. Adv. Manufact. Technol. 81, 465–481.
Fang, X., Zhang, L., Chen, G., Dang, X., Huang, K., Wang, L., et al. (2018). Correlations between microstructure characteristics and mechanical properties in 5183 aluminium alloy fabricated by wire-arc additive manufacturing with different arc modes. Materials 11:2075. doi: 10.3390/ma11112075
Fang, X., Zhang, L., Chen, G., Huang, K., Xue, F., Wang, L., et al. (2021). Microstructure evolution of wire-arc additively manufactured 2319 aluminum alloy with interlayer hammering. Mater. Sci. Eng. A 800:140168. doi: 10.1016/j.msea.2020.140168
Girelli, L., Giovagnoli, M., Tocci, M., Pola, A., Fortini, A., Merlin, M., et al. (2019). Evaluation of the impact behaviour of AlSi10Mg alloy produced using laser additive manufacturing. Mater. Sci. Eng. A 748, 38–51. doi: 10.1016/j.msea.2019.01.078
Huang, K., Marthinsen, K., Zhao, Q., and Logé, R. E. (2018). The double-edge effect of second-phase particles on the recrystallization behaviour and associated mechanical properties of metallic materials. Prog. Mater. Sci. 92, 284–359.
Klein, T., Schnall, M., Gomes, B., Warczok, P., Fleischhacker, D., and Morais, P. J. (2020). Wire-arc additive manufacturing of a novel high-performance Al-Zn-Mg-Cu alloy: processing, characterization and feasibility demonstration. Addit. Manuf. 37:101663.
Kuo, Y. L., Horikawa, S., and Kakehi, K. (2017). Effects of build direction and heat treatment on creep properties of Ni-base superalloy built up by additive manufacturing. Script. Mater. 129, 74–78. doi: 10.1016/j.scriptamat.2016.10.035
Li, S., Ning, J., Zhang, G. F., Zhang, L. J., Wu, J., and Zhang, L. X. (2021). Microstructural and mechanical properties of wire-arc additively manufactured Al-Zn-Mg aluminum alloy: the comparison of as-deposited and heat-treated samples. Vacuum 184:109860. doi: 10.1016/j.vacuum.2020.109860
Li, S., Zhang, L. J., Ning, J., Wang, X., Zhang, G. F., Zhang, J. X., et al. (2020). Microstructures and mechanical properties of Al-Zn-Mg aluminium alloy samples produced by wire+ arc additive manufacturing. J. Mater. Res. Technol. 9, 13770–13780. doi: 10.1016/j.jmrt.2020.09.114
Liang, P., Tarfa, T., Robinson, J. A., Wagner, S., Ochin, P., Harmelin, M. G., et al. (1998). Experimental investigation and thermodynamic calculation of the Al-Mg-Zn system. Thermochim. Acta 314, 87–110. doi: 10.1016/S0040-6031(97)00458-9
Liu, S., and Shin, Y. C. (2019). Additive manufacturing of Ti6Al4V alloy: a review. Mater. Design. 164:107552. doi: 10.1016/j.matdes.2018.107552
Liu, Y., Deng, C., Gong, B., and Bai, Y. (2019). Effects of heterogeneity and coarse secondary phases on mechanical properties of 7050-T7451 aluminum alloy friction stir welding joint. Mater. Sci. Eng. A 764:138223. doi: 10.1016/j.msea.2019.138223
Martin, J. H., Yahata, B. D., Hundley, J. M., Mayer, J. A., Schaedler, T. A., and Pollock, T. M. (2017). 3D printing of high-strength aluminium alloys. Nature 549, 365–369. doi: 10.1038/nature23894
Montero-Sistiaga, M. L., Mertens, R., Vrancken, B., Wang, X., Van Hooreweder, B., Kruth, J. P., et al. (2016). Changing the alloy composition of Al7075 for better processability by selective laser melting. J. Mater. Process. Tech. 238, 437–445. doi: 10.1016/j.jmatprotec.2016.08.003
Morais, P. J., Gomes, B., Santos, P., Gomes, M., Gradinger, R., Schnall, M., et al. (2020). Characterisation of a high-performance Al-Zn-Mg-Cu alloy designed for wire arc additive manufacturing. Materials 13:1610.
Oliveira, J. P., Santos, T. G., and Miranda, R. M. (2020). Revisiting fundamental welding concepts to improve additive manufacturing: from theory to practice. Prog. Mater. Sci. 107:100590. doi: 10.1016/j.pmatsci.2019.100590
Rosenthal, I., Stern, A., and Frage, N. (2014). Microstructure and mechanical properties of AlSi10Mg parts produced by the laser beam additive manufacturing (AM) technology. Metallogr. Microstruc. Analys. 3, 448–453. doi: 10.1007/s13632-014-0168-y
Stopyra, W., Gruber, K., Smolina, I., Kurzynowski, T., and Kuźnicka, B. (2020). Laser powder bed fusion of AA7075 alloy: influence of process parameters on porosity and hot cracking. Addit. Manuf. 35:101270. doi: 10.1016/j.addma.2020.101270
Su, C., Chen, X., Gao, C., and Wang, Y. (2019). Effect of heat input on microstructure and mechanical properties of Al-Mg alloys fabricated by WAAM. Appl. Surf. Sci. 486, 431–440. doi: 10.1016/j.apsusc.2019.04.255
Suarez, M. A., Lara, A. G., Sánchez-Arévalo, F. M., Alvarez, O., Colin, J., and Juarez-Islas, J. A. (2009). Prediction and characterization of growth temperatures in Al-Zn-Mg alloys. Mater. Charact. 60, 420–424. doi: 10.1016/j.matchar.2008.11.002
Uddin, S. Z., Murr, L. E., Terrazas, C. A., Morton, P., Roberson, D. A., and Wicker, R. B. (2018). Processing and characterization of crack-free aluminum 6061 using high-temperature heating in laser powder bed fusion additive manufacturing. Addit. Manuf. 22, 405–415. doi: 10.1016/j.addma.2018.05.047
Wang, P., Li, H. C., Prashanth, K. G., Eckert, J., and Scudino, S. (2017). Selective laser melting of Al-Zn-Mg-Cu: heat treatment, microstructure and mechanical properties. J. Alloy Compd. 707, 287–290. doi: 10.1016/j.jallcom.2016.11.210
Wu, S. C., Yu, X., Zuo, R. Z., Zhang, W. H., Xie, H. L., and Jiang, J. Z. (2013). Porosity, element loss, and strength model on softening behavior of hybrid laser arc welded Al-Zn-Mg-Cu alloy with synchrotron radiation analysis. Weld. J. 92, 64–71.
Keywords: wire and arc additive manufacturing, cold metal transfer, porosity, second phase particles, anisotropy, high strength aluminum alloy
Citation: Fang X, Chen G, Yang J, Xie Y, Huang K and Lu B (2021) Wire and Arc Additive Manufacturing of High-Strength Al–Zn–Mg Aluminum Alloy. Front. Mater. 8:656429. doi: 10.3389/fmats.2021.656429
Received: 20 January 2021; Accepted: 26 March 2021;
Published: 22 April 2021.
Edited by:
Antonio Caggiano, Darmstadt University of Technology, GermanyCopyright © 2021 Fang, Chen, Yang, Xie, Huang and Lu. This is an open-access article distributed under the terms of the Creative Commons Attribution License (CC BY). The use, distribution or reproduction in other forums is permitted, provided the original author(s) and the copyright owner(s) are credited and that the original publication in this journal is cited, in accordance with accepted academic practice. No use, distribution or reproduction is permitted which does not comply with these terms.
*Correspondence: Ke Huang, a2UuaHVhbmdAeGp0dS5lZHUuY24=