 Bang Jiang
 Qiaoxin Zhang
 Lin Shi1
 Li Liu
- 1School of Materials Science and Engineering, Wuhan University of Technology, Wuhan, China
- 2Suizhou-WIT Industry Research Institute, Suizhou, China
- 3The Institute of Technological Science, Wuhan University, Wuhan, China
- 4Changjiang River Scientific Research Institute of Changjiang Water Resources Commission, Wuhan, China
Transient liquid phase sintering (TLPS) is a promising joining technology that can achieve high temperature resistant solder joints at low temperature, showing excellent potential in power electronics. In this work, Cu/Cu-In/Cu solder joints were successfully prepared by TLPS process. The effects of bonding pressure and holding time on the microstructure and shear strength of Cu-In TLPS joints at 260 and 320°C were studied. The results showed that as bonding pressure increased from 0.1–0.6 MPa, the porosity decreased and shear strength increased significantly. No obvious change was found as bonding pressure continued to increase to 1 MPa. As holding time increased at 260°C, Cu11In9 was formed and gradually transformed to Cu2In that can withstand elevated temperature. Meanwhile, the porosity decreased while shear strength increased. It was calculated that volume expansion (12.74%) occurred during the phase transition from Cu11In9 to Cu2In. When bonding temperature increased to 320°C, only Cu2In was detected and then gradually transformed to Cu7In3 with the growing holding time. As holding time reached 120 min, their porosity increased and lead to weak shear strength due to volume shrinkage (15.43%) during the phase transition from Cu2In to Cu7In3.
Introduction
With the miniaturization and integration of power electronics, the increasing operating temperature makes the package module withstand high temperature (Teo and Sun, 2008; Yoon et al., 2013; Chen et al., 2015; Yoon et al., 2019; Xu et al., 2020). Traditional high lead solders are not suitable and needed to be replaced. Although nano-particles sintering (Ag or Cu) can obtain high temperature resistant joints, high porosity, poor electrical and thermal conductivity and Ag migration remain to be resolved (Liu et al., 2021; Tuo et al., 2021). Recently, transient liquid phase sintering (TLPS) has been developed for power electronic package for the advantages of low bonding temperature and pressure, excellent high temperature resistance and high yield strength (Kejanli et al., 2009; Lee et al., 2015; Min et al., 2020). The principle of TLPS is that low melting point metals (Sn or In) melt at bonding temperature, and react with high melting point metals (such as Au, Ag, Ni, and Cu) to form high melting point intermetallic compounds (IMCs) (Feng H. et al., 2017; Eom et al., 2019).
At present, some TLPS systems have been reported, such as Sn-Bi-Ag, Ag-Sn, Cu-Sn, Ag-In, Ni-Sn, and so on (Ohnμma et al., 2012; Wu et al., 2012; Lee et al., 2015; Fujino et al., 2016; Feng H. et al., 2017; Tatsumi et al., 2019). For Cu-In TLPS system, the melting point of In (157°C) is lower than Sn (232°C), which enables the bonding process to be carried out at a lower temperature. Meanwhile, Cu is widely used in power electronics due to excellent electrical and thermal conductivity and low price (Li et al., 2019). Moreover, according to Cu-In binary phase diagram (Bolcavage et al., 1993), the melting points of Cu7In3 (δ phase) and Cu2In (η phase) both exceed 630°C, showing excellent high temperature resistance potential. Nevertheless, the melting point of Cu11In9 is only 307°C, and its existence will weaken the reliability of solder joints. In order to improve the reliability of solder joints, it is essential to obtain Cu2In and Cu7In3 and avoid Cu11In9. It is worthwhile to explore proper bonding process parameters such as bonding temperature, pressure and holding time to obtain ideal phase composition and mechanical properties. However, no works have been reported on the effects of these parameters on the microstructure and shear property of Cu-In TLPS joints.
In this work, Cu-In TLPS joints were successfully prepared. The effects of bonding pressure on the microstructure and shear strength of solder joints were investigated. Furtherly, the microstructure evolution and variation of shear strength under different holding times were also studied.
Experiment Procedures
Cu-In solder paste was used for TLPS bonding, and Cu plates of 3 mm × 3 mm × 1 mm, and 10 mm × 10 mm × 1 mm were used as the upper and lower substrates, respectively. Cu-In solder paste consisted of Cu powders (99.9% purity, ∼2 μm), In powders (99.9% purity, ∼10 μm), and absolute ethanol as an organic solvent. The Cu content in Cu2In and Cu7In3 is 52.54 and 56.36%, respectively. Therefore, in order to make Cu content slightly excessive, a solder paste with a Cu/In ratio of 57:43 was used in this work. The morphology of Cu powders and In powders is shown in Figure 1.
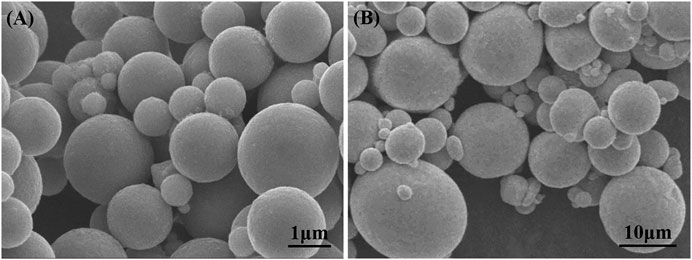
FIGURE 1. Microscopic morphology of powders: (A) Cu and (B) In.
The Cu powders and In powders were mixed and crushed with a pestle and mortar for 3 min, and then uniformly dispersed in an organic solvent for 30 min with an ultrasonic cleaner. Afterwards, Cu-In solder paste was coated on polished Cu plates by a stainless mask with a thickness of 100 μm, assembled into a Cu/Cu-In/Cu sandwich structure. The schematic diagram of the sandwich structure is shown in Figure 2A. During the bonding process, the temperature ramped from room temperature to bonding temperature (260 and 320°C) at a rate of 10°C/min, then kept for 30–180 min, and finally cooled to room temperature with the furnace. The bonding process was carried out in a vacuum furnace (vacuum degree < 10–3 Pa). The macroscopic picture of the sandwich sample after bonding is shown in Figure 2B.
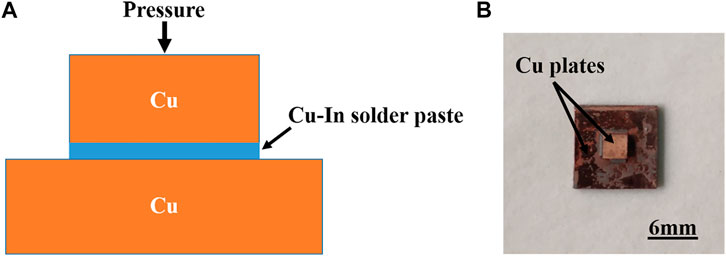
FIGURE 2. Cu/Cu-In/Cu sandwich structure: (A) Schematic diagram and (B) Macroscopic photo.
The microstructure and composition of solder joints were characterized by scanning electron microscope (SEM, Zeiss Ultra Plus) with energy dispersive spectroscopy (EDS, X-Max 50). The porosity was measured by ImageJ software along with SEM photos. The shear strength was tested by electronic universal testing machine (UTM6202) with a shear rate of 0.5 mm/min.
Results and Discussion
Effect of Bonding Pressure
Figure 3 shows the cross-sectional morphology of Cu-In TLPS joints after holding for 90 min under different bonding pressures (0.1, 0.3, 0.6, and 1 MPa) at 260 and 320°C, respectively. When 0.1 MPa was chosen as bonding pressure, large voids appeared in the bonding layer, as shown in Figures 3A,E. As bonding pressure increased to 0.3 MPa, the bonding layer tended to be dense (see Figures 3B,F). The number of voids significantly decreased, and the size of voids was about 1–2 μm. Then as bonding pressure continued to increase to 0.6 MPa (see Figures 3C,G), only a few voids of sub-micron size existed in the bonding layer. Finally, when bonding pressure reached 1 MPa, no obvious change in the compactness of the bonding layer can be observed, as shown in Figures 3D,H. Figure 4 shows the partially enlarged cross-sectional morphology of Cu-In TLPS joints after holding for 90 min under a pressure of 0.3 MPa at 260 and 320°C, and corresponding EDS results are shown in Table 1. It is worth noting that the bonding layer was composed of Cu11In9, Cu2In, and Cu at 260°C, while the composition of bonding layer was Cu2In, Cu7In3 and Cu at 320°C. The existence of low temperature phase Cu11In9 will reduce high temperature resistance of solder joints, which can be avoided by increasing bonding temperature to 320°C.
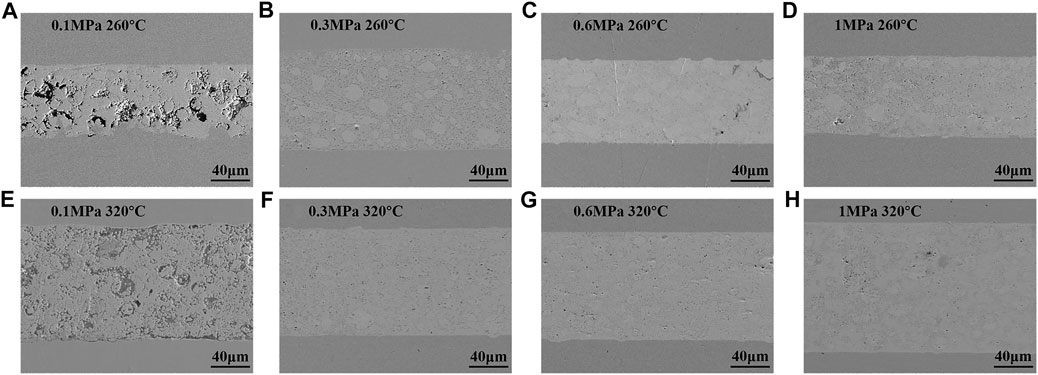
FIGURE 3. The cross-sectional morphology of Cu-In TLPS joints after holding for 90 min under different bonding pressures: (A) 0.1 MPa, (B) 0.3 MPa, (C) 0.6 MPa, and (D) 1 MPa at 260°C, (E) 0.1 MPa, (F) 0.3 MPa, (G) 0.6 MPa, and (H) 1 MPa at 320°C.
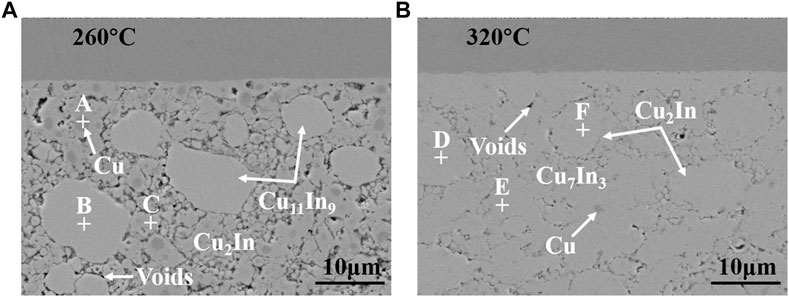
FIGURE 4. The partially enlarged cross-sectional morphology of Cu-In TLPS joints after holding for 90 min under a pressure of 0.3 MPa at (A) 260°C and (B) 320°C.
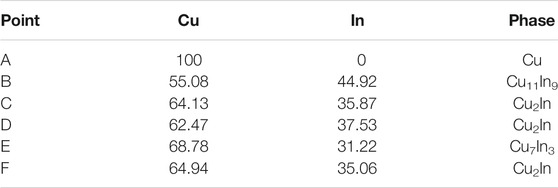
TABLE 1. The chemical composition (at.%) of each marked point in Figure 4.
The porosity and shear strength of Cu-In TLPS joints at 260 and 320°C under different bonding pressures are also shown in Figure 5. It can be seen that the porosity decreased and shear strength increased significantly as bonding pressure increased from 0.1–0.6 MPa. When bonding pressure was 0.6 MPa, a relatively dense bonding layer with a porosity of 1.8% and a shear strength of 12.1 MPa was obtained at 260°C, while a porosity of 1.5% and a shear strength of 21 MPa was obtained at 320°C. As bonding pressure continued to increase to 1 MPa, the porosity decreased and shear strength increased slightly at 320°C, while the porosity increased and shear strength decreased slightly at 260°C. The reason is highly likely that the bonding process was relatively slow at 260°C, and part of the liquid In was squeezed out under a pressure of 1 MPa. Therefore, in order to obtain a relatively high degree of compactness and shear strength under a small bonding pressure, 0.6 MPa is an optimal solution.
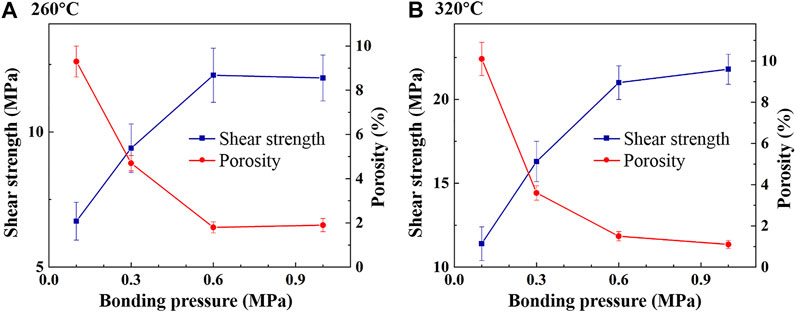
FIGURE 5. Porosity and shear strength of Cu-In TLPS joints under different bonding pressures at (A) 260°C and (B) 320°C.
Effect of Holding Time
Based on above research results, the effect of holding time on the microstructure of bonding layer at 260 and 320°C under a pressure of 0.6 MPa was studied. Figure 6 shows the microstructure of bonding layer with different holding times at 260°C. After holding for 60 min, a large amount of round-like Cu11In9 compound was formed in the bonding layer, and their sizes were about 5–20 μm, as shown in Figure 6A. Many small Cu2In compound was formed around Cu11In9, and their sizes were about 2 μm. In addition, plenty of Cu also existed in the bonding layer. Then as holding time increased to 120 min, the proportion of Cu11In9 significantly decreased, and a great deal of Cu2In appeared in the bonding layer, as shown in Figure 6B. When holding time reached 180 min in Figure 6C, a relatively dense bonding layer was obtained, which was composed of Cu2In and a small amount of Cu. By extending holding time, the low temperature phase Cu11In9 transformed into the high temperature phase Cu2In, showing excellent high temperature resistance.
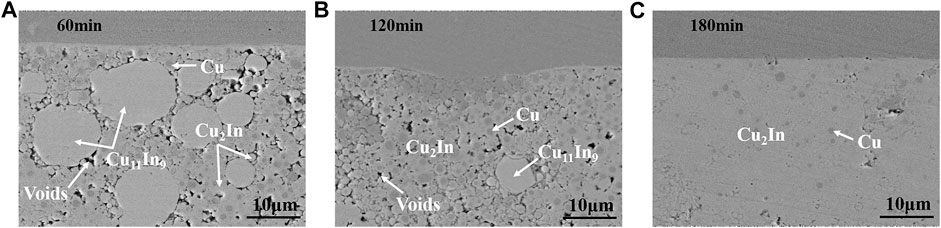
FIGURE 6. The microstructure of bonding layer with different holding times at 260°C: (A) 60 min, (B) 120 min and (C) 180 min.
Figure 7 shows the microstructure of bonding layer with different holding times at 320°C. After holding for 30 min, only Cu2In compound was generated in the bonding layer, as shown in Figure 7A. Besides, a large amount of Cu existed, and many voids appeared in the bonding layer. As holding time increased to 90 min in Figure 7B, large area of Cu2In was densely bonded, and Cu7In3 was gradually formed around Cu2In, as a result of the phase transition from Cu2In to Cu7In3. When holding time reached 150 min, a dense bonding layer was obtained, which consisted of Cu2In and Cu7In3, as shown in Figure 7C. Cu2In was in a round-like shape with a size of about 5–10 μm, surrounded by continuous and dense Cu7In3. During the whole bonding process, only high temperature phases Cu2In and Cu7In3 existed, making the solder joints possess excellent high temperature resistance.
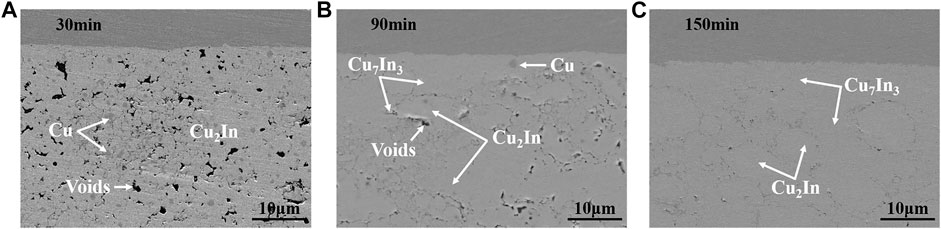
FIGURE 7. The microstructure of bonding layer with different holding times at 320°C: (A) 30 min, (B) 90 min and (C) 150 min.
After holding for a relatively long time, a dense bonding layer was obtained at both 260 and 320°C. Figure 8 shows the variation of porosity with holding time at 260 and 320°C. It can be seen that at 260°C, as holding time increased, the porosity of bonding layer generally decreased, and the porosity dropped to 0.9% at 180 min. At 320°C, the porosity of bonding layer decreased from 7.6% at 30 min to 1.5% at 90 min. However, the porosity increased to 4.2% at 120 min, which was caused by volume shrinkage during the phase transition from Cu2In to Cu7In3. Afterwards, as holding time continued to increase, the porosity dropped to 0.5% at 180 min. The change in porosity can be evaluated by volume change during the phase transition. The chemical reactions of the phase transition from Cu11In9 to Cu2In and Cu2In to Cu7In3 are shown in Eqs (1), (2), respectively.
The volume before and after the phase transition from 1 mol of Cu11In9 to 9 mol of Cu2In is V1 and V2, as shown in Eqs 3, 4.
The volume change is ΔV1, and the volume change rate is η1, as shown in Eqs 5, 6.
The volume before and after the phase transition from 3 mol of Cu2In to 1 mol of Cu7In3 is V3 and V4, as shown in Eqs 7, 8.
The volume change is ΔV2, and the volume change rate is η2, as shown in Eqs 9, 10.
where the density of Cu is ρCu = 8.96 g/cm3, the density of Cu11In9 is ρCu11In9 = 8.28 g/cm3, the density of Cu2In is ρCu2In = 7.46 g/cm3, and the density of Cu7In3 is ρCu7In3 = 8.94 g/cm3 (Koster et al., 1980; Debiaggi et al., 2012).
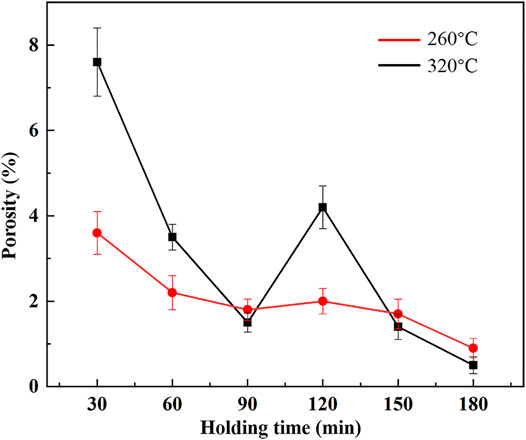
FIGURE 8. Porosity with different holding times at 260 and 320°C.
The calculation results of above volume change rates are η1 = 12.74% and η2 = −15.43%. Therefore, it can be seen that the volume expands 12.74% during the phase transition from Cu11In9 to Cu2In. The volume expansion can reduce the porosity in the bonding layer, but at the same time it can easily cause the initiation and propagation of cracks (Chung and Park, 2008; Wu et al., 2020). However, during the phase transition from Cu2In to Cu7In3, the volume shrinks 15.43%, making it easy to form voids in the bonding layer. The porosity at 320°C for 120 min is 4.2%, much smaller than the theoretical volume shrinkage, which is similar to the result of Ni-Sn TLPS system (Feng H. L. et al., 2017). The reason is that under the action of bonding temperature and pressure during bonding process, the voids in the bonding layer decreased, and the bonding layer was denser. The result of this densification is conducive to improving the quality of Cu-In TLPS joints.
Shear Strength and Fracture Morphology
Figure 9 shows the effect of holding time on shear strength at 260 and 320°C. Figure 10 shows the fracture morphology, and corresponding EDS results are shown in Table 2. When bonding temperature was 260°C, the shear strength increased with the extension of holding time. As holding time increased, the transition from Cu11In9 to Cu2In occurred. The proportion of both Cu11In9 and Cu decreased while the proportion of Cu2In increased, which can also be observed from the fracture morphology in Figures 10A–C. It can be concluded that the shear strength of Cu2In is better than Cu11In9, which is consistent with the research result by Liu et al. (2021). As shown in Figures 10A–C, many small holes appeared on the surface of Cu11In9 and Cu2In. The fracture occurred at the interface of Cu11In9/Cu and Cu2In/Cu, showing an inter-granular fracture.
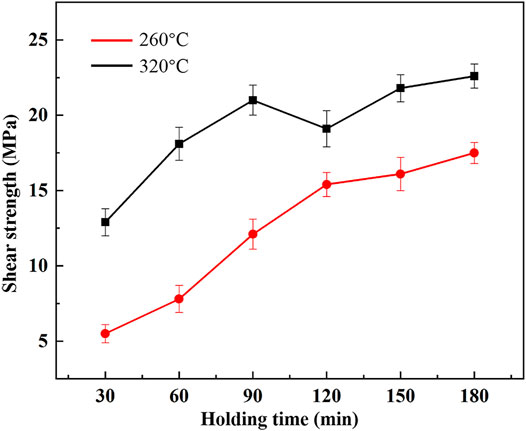
FIGURE 9. Shear strength with different holding times at 260 and 320°C.
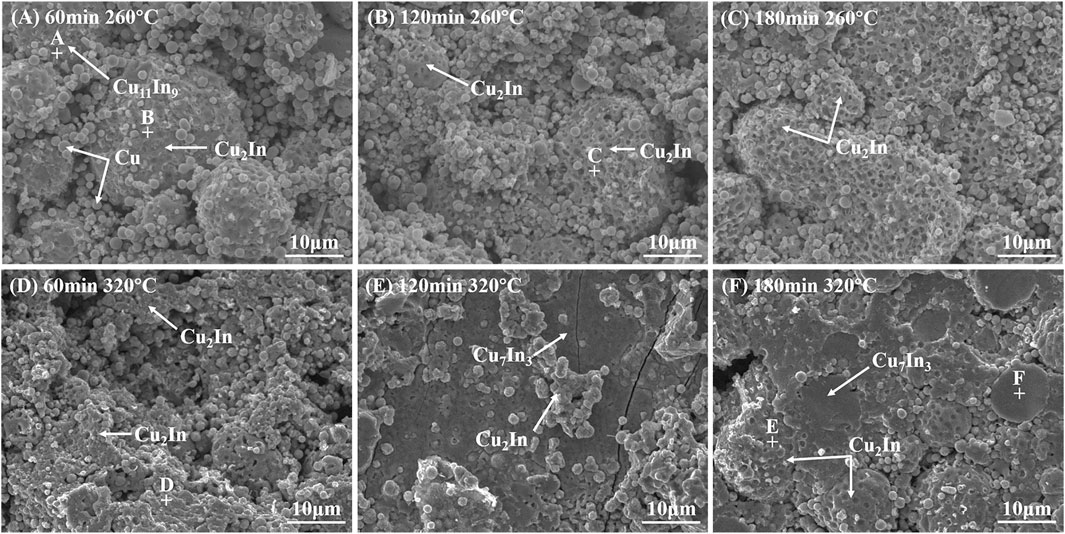
FIGURE 10. Fracture morphology with different holding times at 260 and 320°C: (A) 60 min, (B) 120 min, (C) 180 min at 260°C, (D) 60 min, (E) 120 min, (F) 180 min at 320°C.
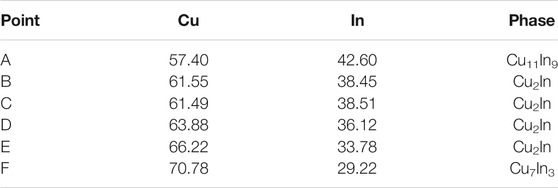
TABLE 2. The chemical composition (at.%) of each marked point in Figure 10.
When bonding temperature was 320°C, the shear strength continuously increased from 12.9 MPa at 30 min to 21 MPa at 90 min. After holding for 60 min, a large number of rock sugar-like fractures can be seen from the fracture morphology in Figure 10D, showing an inter-granular fracture. However, the shear strength decreased to 19.1 MPa at 120 min, which was due to the increase of porosity caused by volume shrinkage. Some rock sugar-like fractures can also be seen in Figure 10E. Moreover, fractures were observed across the Cu7In3 phase, showing a combination of inter-granular and trans-granular fractures, which is similar to the result in Cu/Au-Sn/Cu system (Peng et al., 2018). As holding time reached 150 min, the shear strength increased to 21.8 MPa because a dense bonding layer was obtained. The shear strength changed little as holding time continued to increase. As shown in Figure 10F, many smooth Cu7In3 fractures appeared at 180 min, showing a trans-granular fracture. Besides, the fracture occurred at the interface of Cu2In/Cu7In3 in some areas, so the fracture mode at 180 min was also a combination of inter-granular and trans-granular fractures.
Conclusion
In this work, the effects of bonding pressure and holding time on microstructure and shear strength of Cu-In TLPS joints at 260 and 320°C were studied. Conclusion can be drawn as follows:
1. The compactness and shear strength of solder joints were positively correlated with bonding pressure in a range of 0.1–0.6 MPa. No obvious change was found as bonding pressure increased to 1 MPa.
2. As holding time increased, low temperature phase Cu11In9 transformed into high temperature phase Cu2In at 260°C, while no Cu11In9 was generated in the entire bonding process at 320°C.
3. The porosity generally decreased due to volume expansion (12.74%) during the phase transition from Cu11In9 to Cu2In at 260°C, and the shear strength increased with the extension of holding time. The fracture occurred at the interface of Cu11In9/Cu and Cu2In/Cu, showing an inter-granular fracture.
4. The porosity increased and shear strength decreased after holding for 120 min at 320°C due to volume shrinkage (15.43%) during the phase transition from Cu2In to Cu7In3. The fracture was shown as an inter-granular fracture at 60 min and a combination of inter-granular and trans-granular fractures at both 120 min and 180 min.
Data Availability Statement
The raw data supporting the conclusion of this article will be made available by the authors, without undue reservation.
Author Contributions
BJ: Methodology, writing original draft QZ: Resources LS: Validation ZC: Project administration LL: Conceptualization, writing-review and editing CZ: Invesitgation, supervision.
Funding
This research was supported by the National Nature Science Foundation of China (Grant No. 62004144, 61904127) and the Fund of National Dam Safety Research Center (Grant No. CX 2020B07). Additional thanks also due to the Fundamental Research Funds for the Central Universities (Grant No. 202401002, 203134004, 2042019kf0013) and Fundamental Research Fund for the Central Research Institutes (Grant No. CKSF2-19374/CL).
Conflict of Interest
The authors declare that the research was conducted in the absence of any commercial or financial relationships that could be construed as a potential conflict of interest.
References
Bolcavage, A., Chen, S. W., Kao, C. R., Chang, Y. A., and Romig, A. D. (1993). Phase Equilibria of the Cu-In System I: Experimental Investigation. Jpe 14, 14–21. doi:10.1007/BF02652157
Chen, Y., Gao, X., Wang, J., He, W., Silberschmidt, V. V., Wang, S., et al. (2015). Properties and Application of Polyimide-Based Composites by Blending Surface Functionalized boron Nitride Nanoplates. J. Appl. Polym. Sci. 132, 41889. doi:10.1002/app.41889
Chung, S. W., and Park, S. B. (2008). Numerical Investigation of Underfill Failure Due to Phase Change of Pb-free Flip Chip Solders during Board-Level Reflow. IEEE Trans. Compon. Packag. Technol. 31, 661–669. doi:10.1109/TCAPT.2008.922010
Debiaggi, S. R., Toro, C. D., Cabeza, G. F., and Guillermet, A. F. (2012). Ab Initio comparative Study of the Cu-In and Cu-Sn Intermetallic Phases in Cu-In-Sn Alloys. J. Alloy. Compd. 542, 280–292. doi:10.1016/j.jallcom.2012.06.138
Eom, Y. S., Jang, K. S., Son, J. H., Bae, H. C., and Choi, K. S. (2019). Conductive Adhesive with Transient Liquid‐phase Sintering Technology for High‐power Device Applications. ETRI J. 41, 820–828. doi:10.4218/etrij.2018-0250
Feng, H., Huang, J., Yang, J., Zhou, S., Zhang, R., and Chen, S. (2017). A Transient Liquid Phase Sintering Bonding Process Using Nickel-Tin Mixed Powder for the New Generation of High-Temperature Power Devices. J. Elec. Materi. 46, 4152–4159. doi:10.1007/s11664-017-5357-4
Feng, H.-L., Huang, J.-H., Yang, J., Zhou, S.-K., Zhang, R., Wang, Y., et al. (2017). Investigation of Microstructural Evolution and Electrical Properties for Ni-Sn Transient Liquid-phase Sintering Bonding. Electron. Mater. Lett. 13, 489–496. doi:10.1007/s13391-017-6317-0
Fujino, M., Narusawa, H., Kuramochi, Y., Higurashi, E., Suga, T., Shiratori, T., et al. (2016). Transient liquid-phase sintering using silver and tin powder mixture for die bonding. Jpn. J. Appl. Phys. 55, 04EC14. doi:10.7567/JJAP.55.04EC14
Kejanli, H., Taşkin, M., Kolukisa, S., and Topuz, P. (2009). Transient Liquid Phase (Tlp) Diffusion Bonding of Ti45Ni49Cu6 P/M Components Using Cu Interlayer. Int. J. Adv. Manuf. Technol. 44, 695–699. doi:10.1007/s00170-008-1860-3
Koster, A. S., Wolff, L. R., and Visser, G. J. (1980). Structure of Copper-Indium Cu7In3. Acta Crystallogr. Sect. B 36, 3094–3096. doi:10.1107/S0567740880010886
Lee, J.-B., Hwang, H.-Y., and Rhee, M.-W. (2015). Reliability Investigation of Cu/In TLP Bonding. J. Elec. Materi. 44, 435–441. doi:10.1007/s11664-014-3373-1
Li, J., Zhang, P., He, H., and Shi, B. (2020). Enhanced the thermal Conductivity of Flexible Copper Foil by Introducing Graphene. Mater. Des. 187, 108373. doi:10.1016/j.matdes.2019.108373
Liu, Z., Yang, L., Xu, Y. H., Zhang, Y. C., Lu, K. J., Xu, F., et al. (2021). Study on Microstructure and Shear Property of Cu/In-xCu/Cu Transient Liquid Phase Bonding Joints. J. Electron. Mater. 50, 217–223. doi:10.1007/s11664-020-08504-0
Min, K. D., Jung, K.-H., Lee, C.-J., Jeong, H., Hwang, B.-U., and Jung, S.-B. (2020). Transient Liquid Phase Sintering of Ni and Sn-58Bi on Microstructures and Mechanical Properties for Ni-Ni Bonding. Electron. Mater. Lett. 16, 347–354. doi:10.1007/s13391-020-00221-4
Ohnμma, I., Kainuma, R., and Ishida, K. (2012). Development of Heat Resistant Pb-free Joints by TLPS Process of Ag and Sn-Bi-Ag alloy Powders. J. Min. Metall. B Metall. 48, 413–418. doi:10.2298/JMMB121123052O
Peng, J., Liu, H. S., Ma, H. B., Shi, X. M., and Wang, R. C. (2018). Microstructure Evolution and Mechanical Reliability of Cu/Au-Sn/Cu Joints during Transient Liquid Phase Bonding. J. Mater. Sci. 53, 9287–9296. doi:10.1007/s10853-018-2204-9
Tatsumi, H., Lis, A., Yamaguchi, H., Matsuda, T., Sano, T., Kashiba, Y., et al. (2019). Evolution of Transient Liquid-phase Sintered Cu-Sn Skeleton Microstructure during thermal Aging. Appl. Sci. 9, 157. doi:10.3390/app9010157
Teo, J. W. R., and Sun, Y. F. (2008). Spalling Behavior of Interfacial Intermetallic Compounds in Pb-free Solder Joints Subjected to Temperature Cycling Loading. Acta Materialia 56, 242–249. doi:10.1016/j.actamat.2007.09.026
Tuo, C., Yao, Z., Liu, W., Liu, S., Liu, L., Chen, Z., et al. (2021). Fabrication and Characteristics of Cu@Ag Composite Solder Preform by Electromagnetic Compaction for Power Electronics. J. Mater. Process. Tech. 292, 117056. doi:10.1016/j.jmatprotec.2021.117056
Wu, D., Xie, X., Zhang, Y., Zhang, D., Du, W., Zhang, X., et al. (2020). MnO2/Carbon Composites for Supercapacitor: Synthesis and Electrochemical Performance. Front. Mater. 7, 2. doi:10.3389/fmats.2020.00002
Wu, Y.-Y., Lin, W. P., and Lee, C. C. (2012). A Study of Chemical Reactions of Silver and Indium at 180 °C. J. Mater. Sci. Mater. Electron. 23, 2235–2244. doi:10.1007/s10854-012-0778-6
Xu, J., Jin, L., Liao, Z., Wang, Q., Tang, X., Zhong, Z., et al. (2020). Quantum Spin-Wave Materials, Interface Effects and Functional Devices for Information Applications. Front. Mater. 7, 597386. doi:10.3389/fmats.2020.594386
Yoon, J.-W., Kim, Y.-S., and Jeong, S.-E. (2019). Nickel-tin Transient Liquid Phase Sintering with High Bonding Strength for High-Temperature Power Applications. J. Mater. Sci. Mater. Electron. 30, 20205–20212. doi:10.1007/s10854-019-02404-8
Keywords: transient liquid phase sintering, intermetallic compound, microstructure evolution, shear strength, porosity
Citation: Jiang B, Zhang Q, Shi L, Zhu C, Chen Z, Liu L and Shi Y (2021) Microstructure Evolution and Shear Property of Cu-In Transient Liquid Phase Sintering Joints. Front. Mater. 8:658464. doi: 10.3389/fmats.2021.658464
Received: 25 January 2021; Accepted: 17 May 2021;
Published: 17 June 2021.
Edited by:
Xingxing Wang, North China University of Water Conservancy and Electric Power, ChinaReviewed by:
Xiaowu Hu, Nanchang University, ChinaXue Songbai, Nanjing University of Aeronautics and Astronautics, China
Copyright © 2021 Jiang, Zhang, Shi, Zhu, Chen, Liu and Shi. This is an open-access article distributed under the terms of the Creative Commons Attribution License (CC BY). The use, distribution or reproduction in other forums is permitted, provided the original author(s) and the copyright owner(s) are credited and that the original publication in this journal is cited, in accordance with accepted academic practice. No use, distribution or reproduction is permitted which does not comply with these terms.
*Correspondence: Li Liu, bC5saXVAd2h1dC5lZHUuY24=