 Nur Amirah Mohd Zahri1
 Farazila Yusof1,2*
 Irfan Anjum Badruddin3
 A. S. Md. Abdul Haseeb1,4
 Nazatul Liana Sukiman1,4
 Sarfaraz Kamangar3
- 1Department of Mechanical Engineering, Faculty of Engineering, University Malaya, Kuala Lumpur, Malaysia
- 2Advanced Manufacturing and Material Processing (AMMP Centre), University Malaya, Kuala Lumpur, Malaysia
- 3Mechanical Engineering Department, College of Engineering King Khalid University, Abha, Saudi Arabia
- 4Centre of Advanced Materials (CAM), University Malaya, Kuala Lumpur, Malaysia
Utilization of open-cell metal foams in functional applications such as in energy absorption, noise absorber, heat insulator, and lightweight panels is trending in many industrial applications. The development of reliable joining technologies for sandwiched metal foams is crucial for thermal application and one of the techniques used is brazing process. In the current work, copper foam was sandwiched between a copper plate using amorphous filler of Cu-9.7Sn-5.7Ni-7.0P (Cu: copper, Sn: tin, Ni: nickel, and P: phosphorus) via brazing technique. The shear test was conducted on the brazed joint interface of copper/copper foam, while the compressive test was carried out on the brazed sample. Microstructures of the copper substrate surface obtained from the shear fracture of brazed copper/copper foam show the tear region and cleavage fractures. The stress–strain curve of shear and compressive strength explains the deformation behavior of the brazed sample.
Introduction
Naturally porous materials such as corals, woods, and bones are lightweight and durable structures. These examples from nature have become an inspiration for metallurgist to produce porous metal foam structures (Zhao et al., 2006). Their use has started in the 1960s in the application of metallic foam for the cooling of inter-ballistic missile components of the US Navy. The commercial usage of metallic foams was available in the early 1980s and has wide applications such as in transportation, infrastructure and construction, automotive, aerospace, and military equipment (Nawaz et al., 2012; Liu et al., 2014). Research and development in metallic foam includes utilization in thermal applications, such as in heat exchanger equipment (Abadi et al., 2016), heat sinks in electronics (Hu et al., 2016), engine combustion, aircraft, and automotive systems (Shirzadi et al., 2008). There is a growing demand in metal foam, with a USD 82.0 million share in the global market (Grand View Research, 2017).
The fabrication process plays a vital role in the manufacturing of metal foam, in particular in the metal foam pore density (pore per inch: PPI) and porosity (%). These properties determine the mechanical and thermal properties of metal foam, which affect its functionality in the intended application (Vesenjak et al., 2016). There are several methods of metal foam fabrication, such as electrodeposition (Kim et al., 2016), powder metallurgy, casting, metal vapor, and metal ions (Xie and Evans, 2004; Ramos and Dunand, 2012; Wang and Guo, 2016). The choice of process would depend on the required foam structure, whether open cell or closed cell. In addition, the metal foam material is selected based on their intended applications. Metal foam material can be fabricated from nickel (Ni) (Ochiai et al., 2010; Sun et al., 2018), iron (Fe) (Alavi et al., 2017), copper (Cu) (Rybar et al., 2016), aluminum (Al) (Saw et al., 2017), or stainless steel (SS) (Tuzovskaya et al., 2012).
The high surface area of metal foam enables the transfer of high amount of heat with a small volume of metal (Zhao, 2012). The foam structure consists of highly interconnected branches and porosities, which can be closed-cell or open-cell structures. Closed-cell metal foam generally has air-filled pores with cell wall barriers. In contrast, open-cell metal foam has continuous interconnected branches network formed a cell wall with a node. The interconnected branches of foams are surrounded by void spaces which are linked through pores (Tan and Chong, 2016). These voids create a highly porous structure and result in a large ratio of area per unit volume. Closed-cell metal foams are utilized in structural applications due to their strengths, while open-cell metal foams are applied in functional applications such as in cooling, heating, and condensing (Ghosh, 2009). Other applications of open-cell structures are in sound absorption and high temperature gas and fluid filtrations. Previous studies carried out a mechanical analysis of metal foam to identify the metal foam failure and behavior mechanisms. Chen et al. (2017) have studied the compression characteristics of open-cell Cu foam by varying the strain rates (10–2, 10–3 , and 10–4 s−1) and Cu foam porosity (90.3, 95.7, and 96.4%). The results show that the compression strengths, Young’s modulus, and yield strength of the Cu foam, increase with increasing strain rate and decreasing Cu foam porosity. The failure mechanism of the compression deformation shows that the Cu foam experiences layer-by-layer collapse. This failure occurs due to the formation of stress concentration at the weak branch of Cu foam, as shown by the plastic stage deformation on the compressive stress–strain curve. Liu et al. (2014) have investigated the effect of strain rates ranging from 10–3 to 2,400 s−1 on the Cu foam mechanism and behavior. The compressive stress–strain curves of lotus-type porous Cu consist of a linear elastic stage, a plateau stage, and the densification stage for all strain rates. Material with a lower strain rate has less sensitivity toward stress–strain curve until the strain rate exceeds 1.0 s−1. The plateau stage of the compressive stress–strain curve would be affected by the high strain rate. At high strain rates, the gases in the pores have insufficient time to escape which directly increase the atmospheric pressure and lead to an increase in the plateau stress.
The current work has considered metal foam heat exchanger applications due to abundant of works on the thermal performance using a metal foam (Chein et al., 2009; Odabaee and Hooman, 2012; Hu et al., 2016; Zhang et al., 2018). In heat exchanger application, the fluid medium would pass through the pores and make contacts with the large surface area of metal foam branches (Kim et al., 2016). The flows of fluid medium through the metal foam pores require a high strength of foam branches and brazing joint. Several works have discussed the use of brazing in the fabrication of Cu foam heat exchangers (Chein et al., 2009; Ribeiro et al., 2012; Hu et al., 2016), although the process on joining of the metal foam heat exchanger was not explained in detail. But there are some of the researchers reported solely in metal foam joining without the application. Jarvis et al. (2011) have conducted the brazing of nickel (Ni) foam to Ti6Al4V (Ti: titanium, Al: aluminum, and V: vanadium) using Ti15Cu25Ni with different binder systems of polyvinyl alcohol (PVA), polyvinyl butyral (PVB), and polyethylene glycol-polymethyl methacrylate (PEG-PMMA). Shear test results of the joints show that crack deformations were formed in a majority of the Ni foam area for joints produced with PVA and PVB binders, while the joint produced with PEG-PMMA binder has shown a line crack deformation on the Ni foam. These results suggest that joint failures tend to occur through the foam instead of in the joint interface. Nannan et al. (2013) have carried out brazing of aluminum (Al) foam–Al foam using Al86SiMg filler by varying the vacuum pressure (6.63 × 10⁻³ and 5.0 Pa) and the amount of filler layer (monolayer and multilayer). The joint bending strength of brazed Al foam–Al foam was the highest for the multilayer filler in high vacuum, followed by the joint produced with multilayer layer in a low vacuum and then with monolayer filler in high vacuum. Song et al. (2015) have fabricated a steel/aluminum foam/steel sandwiched brazed joint using an aluminum–silicon-based alloy filler. It was found that increasing the brazing time for an additional 10 min resulted in the decrease of the shear joint strength due to formation of a brittle phase. The highest shear strength obtained was 6.26 MPa for the joint produced at 620 °C for 10 min brazing time. Ubertalli et al. (2017) have studied the joining of AA6016 (Al0.25Mg1.0Si)/Al foam/AA6016 using different fillers of Zn (250 µm thickness) and Zn + 2% Al (350 µm thickness) with 5 min holding time at 430°C and 1 min holding time at 420°C, respectively. The joining using Zn + 2% Al filler shows higher stiffness with the diffusion of Al-rich and Zn-rich in the joining area. Zahri et al. (2019) found the strength of brazed Cu foam with a Cu-4.0Sn-9.9Ni-7.8P amorphous filler is dependent on the foam pore density. The diffusion of P and Ni elements into the foam allows it to coat the foam branches and leads to the increase in foam strength. Similar phenomenon was found by Sami et al. (2020). Authors investigated the sandwiched Cu foam brazing using a single layer of Cu-9.7Sn-5.7Ni-7P foil at 680°C for 15 min. Phosphorus plays a vital role in hardening foam branches which higher phosphorus percentage was found across the foam. Besides, the nickel percentage also was discovered higher in the middle and the top-side joint of the foam. Studies on metal foam joining have been increasing in recent years. However, research on the deformation behavior of metal foam is still scarce. Hence, the aims of this study are to investigate the deformation behavior through a 1) compressive strength of Cu/Cu foam/Cu which will accommodate a strong mass fluid flow during heat exchanger operation and 2) shear strength of Cu/Cu foam joining which may affect the thermal conduction due to the thermal resistance at the joining interface (Heo et al., 2019).
Materials and Methods
The Cu foam of different pore densities 15 PPI, 25 PPI, and 50 PPI (hereinafter referred to as foam A, foam B, and foam C, respectively) was purchased from Duranice Applied Materials (Dalian, China). The pore densities (ranging from 15 PPI to 50 PPI) of Cu foam were chosen due to their influence in heat rate performance. Mancin et al. (2012) have found that very high pore density (60 PPI and above) in foam metal would cause a pressure drop in the heat exchanger and require more pumping power. The foam was sandwiched between Cu (C & W hardware, Kuala Lumpur, Malaysia) with amorphous Cu-9.7Sn-5.7Ni-7.0P filler (Metglas® Inc., Conway, United States) was in between faying surface of Cu and Cu foam.
The sample of Cu/filler/Cu foam/filler/Cu was undergone a brazing process at difference brazing temperatures (660C, 680C, 700C, and 720°C). Four different brazing temperature parameters were fixed above the filler liquidus temperature of 643°C (Zahri et al., 2020). The argon gas was used to avoid oxidation during brazing at a high temperature. The formation of oxide on the specimen’s surface would reduce the wettability of the filler, resulting in a weak joint. The short holding time of 5 min was selected to minimize the energy used (Zhong et al., 2012) without jeopardizing the mechanical strength of the joint. The brazing cycle consisted of a preheating stage at 350°C for 30 min. Zaharinie et al., 2015 have reported that a preheating stage of 350°C for 30 min would not affect the grain growth as the preheating temperature was less than the targeted annealing temperature range. The preheating may soften and assist in the full melting of the filler metal during brazing. The uniform heating rate and preheating phases were fixed at 5°C/min and 30 min, respectively, because Cu is usually difficult to join rapidly due to its high thermal conductivity (Srinath et al., 2011). Finally, the specimen was cooled at a slow rate of 5°C/min to avoid formation of residual stresses and allow the intermetallic compound phases to achieve a stable equilibrium (Ubertalli et al., 2017).
The ImageJ 1.52v (Wayne Rasband, National Institutes of Health, United States) was used to measure the size of Cu foam structure. The compression test and the shear test were performed to evaluate the brazed joint strength of Cu/Cu foam and compressive strength of brazed Cu/Cu foam/Cu foam, respectively. It was conducted in accordance to ASTM Standard C273 for sandwich core materials using an Instron Universal Testing Machine 3369 equipped with Bluehill 2.0 software (Instron Inc., Norwood, United States). A 50 kN load cell was fitted operating in displacement control mode at a cross-head speed of 1 mm/min, conducted at room temperature. Then, the fractured Cu substrate surface from Cu/Cu foam shear fracture, in this shear test, was analyzed for fracture behavior. Scanning electron microscope (SEM) micrographs of the fractured Cu substrate surface were acquired using a JEOL JSM 6360A (Tokyo, Japan). In addition, energy-dispersive X-ray spectroscopy (EDX) analysis was carried out to obtain elemental composition (%) of the samples. The EDX apparatus was equipped with the elemental analysis software JEOL JED-2300 (Tokyo, Japan).
Results
Cu Foam
Figure 1 shows a macroscopic Cu foam with different pore densities for a Cu/Cu foam brazing. The size of Cu foam structure, including cell wall area, pore diameter area, and branch area, was measured using ImageJ software as tabulated in Table 1. Macroscopic images and measurements show the decrease in sizes of the pores, cell walls, and Cu foam branches from foam A, foam B, and foam C, respectively. However, the number of Cu foam interconnected branches had increased from foam A to foam B and finally to foam C, increasing the surface area of the foam. It has been reported that the increase in Cu foam pore density would result in the increase in total heat transfer and pressure drop. Hu et al. (2016) have reported that the increase in Cu foam from 5 PPI to 15 PPI yields total heat transfer rate and pressure drop increment by 67 and 62%, respectively.
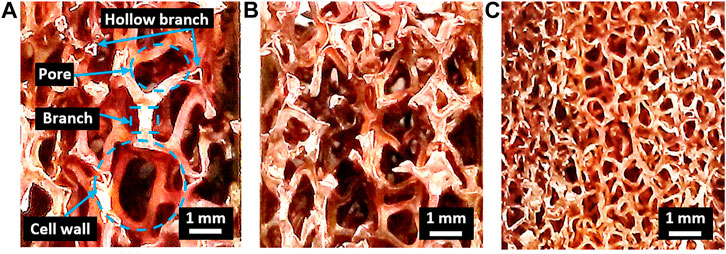
FIGURE 1. Cu foam macrostructure (A) foam A, (B) foam b, and (C) foam C.
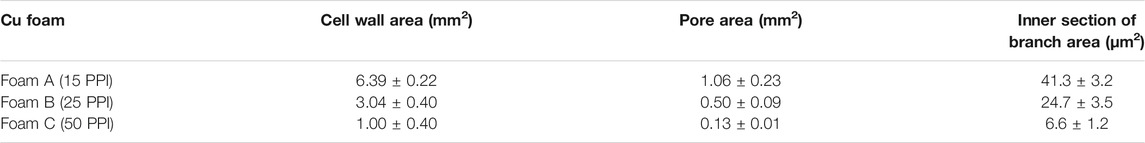
TABLE 1. Size of Cu foam for (A) foam A, (B) foam B, and (C) foam C
Compressive Strength of Cu/Cu Foam/Cu
Figure 2 shows a constant compressive strength value of Cu/Cu foam/Cu as the brazing temperature increases from 660C to 700°C, followed by an increase at 720°C. The brazing temperature parameter was fixed up to 720°C only regardless of highest compressive strength value. This is due to the high value of compressive strength, Cu foam branches degradation, and required strength in application utilization. Further elaboration is explained in discussion section. Next, the pore density of Cu foam has a significant effect on the compressive strength performance. The compressive strengths of Cu/Cu foam/Cu increase from foam A to foam B and finally to foam C as shown in Figure 2. In comparison, the compressive strengths of nonbrazed Cu/Cu foam/Cu for foam A, foam B, and foam C were 3.23, 5.31, and 7.74 MPa, respectively, as shown as a straight line in Figure 2. The compressive strength of nonbrazed samples was lower than the values obtained for brazed sample. The percentage increments between nonbrazed and the highest compressive strength of brazed sample (at 720°C) were 102.34, 69.77, and 43.16% for foam A, foam B, and foam C, respectively.
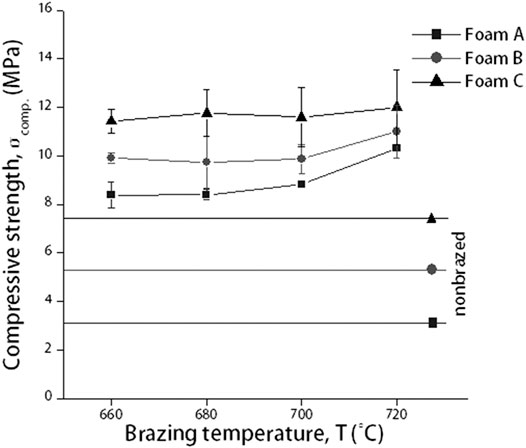
FIGURE 2. Compressive strength of nonbrazed and brazed Cu/Cu foam/Cu using amorphous filler with different Cu foam pore densities and brazing temperature.
Next, the compressive stress–strain curve of brazed Cu/Cu foam/Cu using amorphous filler at brazing temperature of 720°C was plotted in Figure 3. Generally, a compressive stress–strain curve of porous materials can be divided into three regions which are linear elastic, plateau, and densification (Gnyloskurenko et al., 2005; Liu et al., 2014; Haidar and Sekh, 2018).
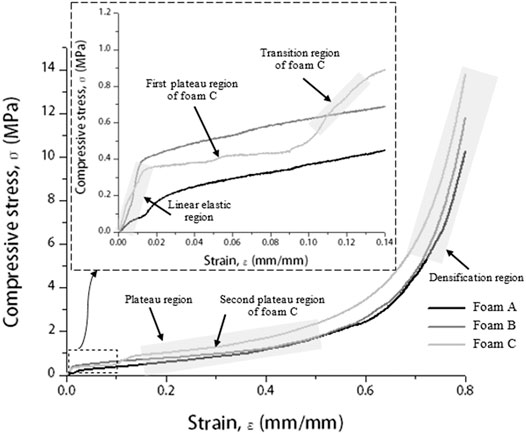
FIGURE 3. Compressive stress–strain curve of brazed Cu/Cu foam/Cu at a brazing temperature of 720°C with different Cu foam pore densities and inset shows an elastic curve at a strain range of 0–0.14ε.
Shear Strength of Cu/Cu Foam Brazed Joint Interface
The shear strengths of Cu/Cu foam using amorphous filler increase as the brazing temperature increases from 660 to 680°C as shown in Figure 4. A decrease in shear strength was seen as the brazing temperature increases to 700°C with an insignificant increase as the brazing temperature reaches 720°C. The parameter of brazing temperature was not further investigated beyond 720 °C due to insignificant increasing shear strength from brazing temperature at 700–720°C. Beside the highest shear strength obtained for Cu/Cu foam using amorphous filler is at a brazing temperature of 680°C for all Cu foam pore densities. While increasing the Cu foam, density was found to have reduced the shear strengths of the joint. Foam C has a higher porosity and smaller pore sizes as compared to foam A but has lower shear strength.
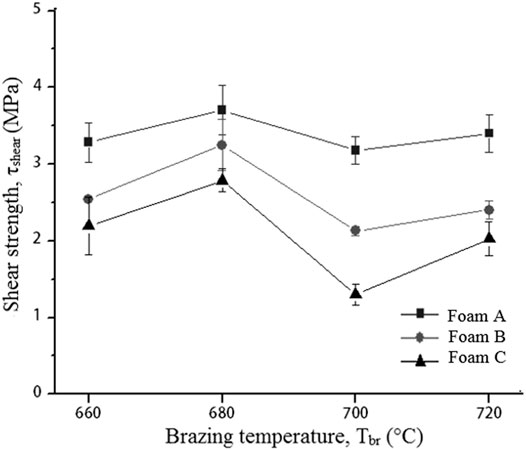
FIGURE 4. Shear strength of brazed Cu/Cu foam using amorphous filler with different Cu foam pore densities and brazing temperature.
Figure 5 shows shear stress–strain curves of brazed Cu/Cu foam/Cu using amorphous filler with different Cu foam pore densities at 680°C brazing temperature. The brazing temperature was selected based on the highest shear strength (Figure 4). Generally, a shear stress–strain curve of Cu/Cu foam brazed joint can be divided into four regions which are elastic, plateau, densification, and shearing (Kaya, 2020).
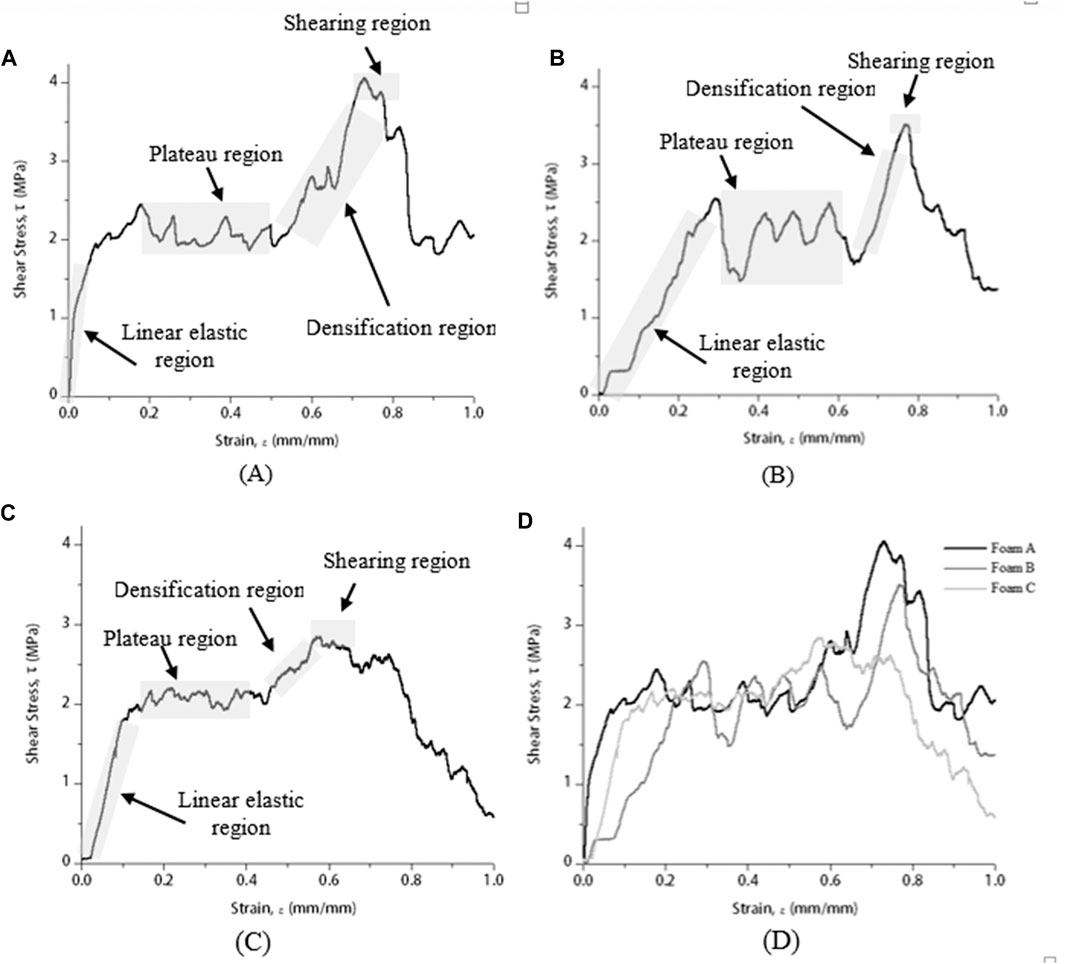
FIGURE 5. Shear stress–strain curve of brazed Cu/Cu foam/Cu using amorphous filler at 680°C with different Cu foam pore densities of (A) foam A, (B) foam B, (C) foam C, and (D) combined.
Shear Fracture of Cu Substrate Surface From Brazed Cu/Cu Foam
Figure 6 shows top view back scattered electron (BSE) image of Cu substrate shear fracture surface from the brazed Cu/Cu foam shear test. From the images, it can be deduced that the shear fracture of brazed Cu/Cu foam experienced a mixture of ductile and brittle fracture. The tear region shows high concentration of Cu and phosphorus (P), indicating a brazed joint interface between Cu and Cu foam branches.
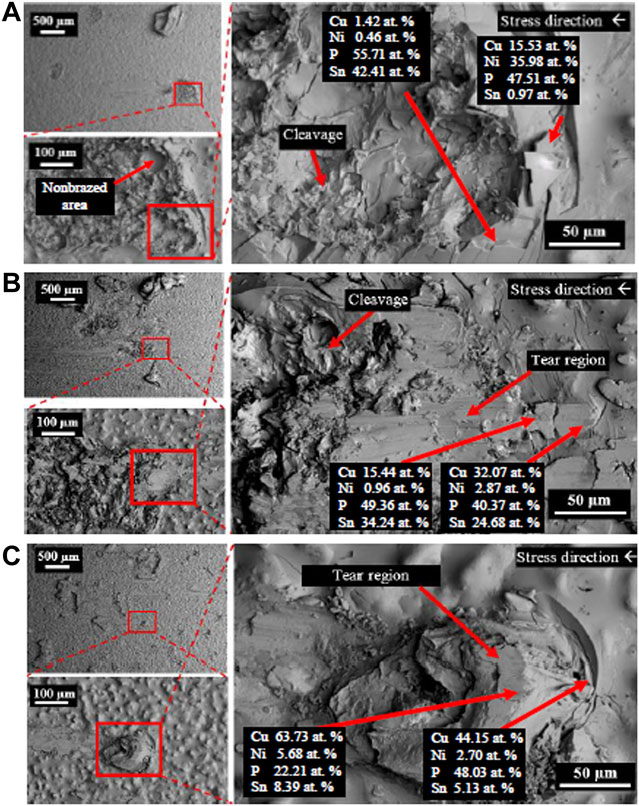
FIGURE 6. Shear fracture of top-view Cu substrate surface from the brazed Cu/Cu foam shear test with different Cu foam pore densities of (A) foam A, (B) foam B, and (C) foam C.
Side-view BSE images of Cu substrate surface from the Cu/Cu foam shear fracture were also captured as shown in Figure 7. The dark gray (island-shaped) and light gray areas indicating the filler and the diffusion regions, respectively. The diffusion region, shown as a brighter area than the Cu substrate, is an interaction layer between Cu/filler and Cu foam/filler which are formed during brazing.
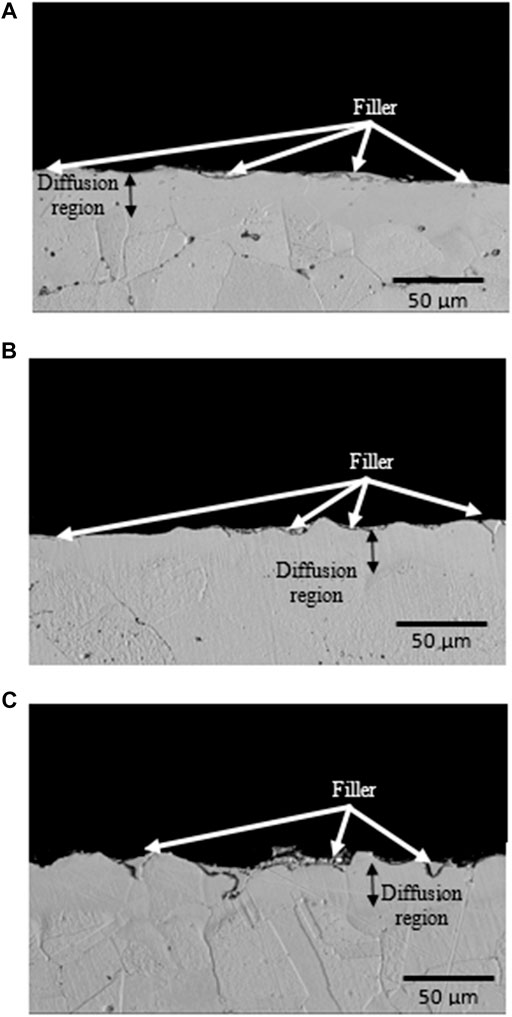
FIGURE 7. Shear fracture of side-view Cu substrate surface from the brazed Cu/Cu foam shear test with different Cu foam pore densities of (A) foam A, (B) foam B, and (C) foam C.
Discussion
The constant compressive strength of Cu/Cu foam/Cu from 660 to 700°C could be due to the inability of filler B to flow to the Cu foam via capillary action. Increasing the brazing temperature enabled sufficient heat input to provide the required energy to break the atomic bonds in the amorphous filler, allowing it to flow freely and coat the Cu foam branch. This has resulted in the increase in compressive strengths at 720°C. The highest compressive strength of foam C can be attributed to the abundance of branching structure as shown in Figure 1C. The increase in compressive strengths with the increase in Cu foam pore densities correlate to the rise in the size of Cu foam structure, as tabulated in Table 1. Figure 1 shows the high number of branches in foam C as compared to foam B and foam A. This interconnected branch would be able to resist the applied load better than foams with lesser interconnected branches. The increase in the amounts of Cu foam branches in foam A, foam B, and foam C would correspondingly increase their compressive strength values. In comparison, the result presents that by using amorphous filler in the brazed Cu/Cu foam/Cu would significantly enhance its compressive strength performance. During brazing, the molten filler flows toward the Cu foam branches and would coat them during solidification. The solidified filler on the Cu foam branches would increase the compressive strength of the brazed Cu/Cu foam/Cu as compared to the nonbrazed Cu/Cu foam/Cu.
The compressive stress–strain curve of brazed Cu/Cu foam/Cu shows that in the linear elastic region (inset of Figure 3), the stress gradually increases with increasing strain, at a low strain range (<0.015). Here, the compressive stress concentration reaches the yield strength of the Cu foam cell wall and leads to a reduction of Cu foam pore size. Beyond the elastic region, the plastic deformation of the Cu/Cu foam/Cu is indicated by a plateau region. A long and smooth plateau region corresponds to a ductile behavior with nearly constant stress. It can be theorized from this result that Cu/Cu foam/Cu can still absorb the energy of the impact even though it was in a state of compressive deformation. The compressive stress–strain curve also illustrates the ability of foam C to absorb excess energy because of its high-stress amplitude. The continual deformation causes the reduction in pore size and porosities of Cu foam (Liu et al., 2010). Finally, a sharp increase in densification with increasing strain indicates compaction on the Cu foam branches. When the Cu foam becomes sufficiently compact, the cell wall would collapse with further load application. The compressive stress–strain curve of brazed Cu/Cu foam/Cu with a foam C shows a primary (first) and secondary plateau regions. The first and secondary plateau regions appear in the stress–strain curve due to the deformation of foam C is considered to occur in the high porosity layer and then shifted to the low porosity layer, respectively. Initially, the deformations started in the high porosity layer present primary maximum stress in the first plateau region. The continual deformation causes the reduction in foam porosity, and pore size leads to the initial point of densification for the high porosity layer. However, at this point, it is considered as the endpoint of the first plateau region because the second plateau region appeared indicates the deformation of the low porosity layer. At this stage, the deformation of Cu foam shifted to the low porosity layer, which is known as the transition region. The transition step for a deformation of Cu foam low porosity layer occurs due to the Cu foam high porosity layer has been collapsed in the early stage. After that, the densification of the Cu foam low porosity layer started. The stress increase sharply in the densification region indicates the Cu foam branches become sufficiently collapse and compact. Hangai et al. (2015) have reported similar plateau regions in the compressive stress–strain curve for the deformation behavior study of functionally graded aluminum foams. Authors improved the aluminum foam by adding a blowing agent titanium (II) hydride (TiH2) using a friction stir welding method. The result shows different steps in the plateau region in the compressive stress–strain curve with the addition of TiH2. Authors found that the combination of high porosity and low porosity layers of foam can control the foam deformation.
On the other hand, the highest shear strength of Cu/Cu foam is at brazing temperature of 680°C. The heat is considered sufficient for the diffusion of filler atoms into the brazed joint interface of Cu/Cu foam. However, further increasing the brazing temperature would compromise the strength of Cu foam due to the fragility of its interconnected branches. A high brazing temperature would cause coarseness in the microstructure formation and decrease the shear strength of Cu/Cu foam. The interconnected structure with small branches (foam C) resulted in a large surface area between Cu and Cu foam C (Figure 1). However, this large surface area did not result in increased shear strength properties as the molten filler has to spread in more hollow spaces in foam C. This observation is similar to past results which have found that a highly porous metal yields low shear strengths. For example, Wan et al. (2012) have conducted shear tests on a porous metal fiber sintered sheet (PMFSS) at different porosities. Increasing the porosity of PMFSS from 70 to 90% resulted in decreased shear strengths from 7.7 to 0.9 MPa. Zahri et al. (2020) studied the interfacial microstructure of Cu and Cu foam brazed joint. A high number of cavities were found in the brazing interface region for the highest pore density Cu foam leading to a low shear strength. The formation of cavities is due to the entrapped gas in the void spaces of Cu foam. Moreover, the presence of copper phosphide (Cu3P) and nickel phosphide (Ni3P) brittle phases play a vital role in determining the shear strength result.
The shear stress–strain curve in Figure 5 consists of four different regions to present the shear strength behavior of Cu/Cu foam brazed joint strength. Initially, the elastic region takes place when the stress gradually increases with the increasing strain between the stress load and the brazed sample. The continual deformation presented a hardening plateau region where the stress is nearly constant with the increasing strain. Fluctuate and noise curves correspond to the solid and void spaces of the brazed joint interface between the Cu substrate surface and porous structures of the Cu foam interconnected branches. Beyond the plateau region, a larger slope and sharp increase with increasing strain is indicated by a densification region. At this region, the deformation of the brazed joint sample is subjected to compressive loading instead of shearing loading. Finally, a lower slope with nearly constant stress in the shear stress–strain curve is denoted as the shearing region. Kaya (2020) has reported a similar shear stress–strain curve for a 316L open-cell stainless steel (SS) foam. The SS foam owns high ductility and experiences a high plasticity. The plateau region and enlarged area under the shear stress–strain curve (Figure 5) indicate the Cu/Cu foam brazed joint interface owns a high ductility property. The brazed joint of Cu/Cu foam capable of absorbing energy before the sheared off occurs. The brazed Cu foam has a lower shear energy absorption capacity found from the shear stress–strain curve, compared to the compressive energy absorption capacity (compressive stress–strain curve in Figure 3).
The compressive strength and shear strength play vital roles in the brazed Cu/Cu foam/Cu. The strength of Cu foam and a strong brazing joint is required properties in heat exchanger applications (Boomsma et al., 2003). The compressive strength of Cu/Cu foam/Cu is needed to accommodate strong mass fluid flow during heat exchanger operation. While the shear strength determines the contact joining quality between substrate and the foam which affect the thermal conduction due to the thermal resistance at the joining interface (Heo et al., 2019). The highest compressive strength values obtained ranged from 10 to 12 MPa at 720°C. Beyond the brazing temperature of 720°C, the metal foam branch in the brazing seam region may degrade and reduce the shear strength result. In the current work, the highest shear strength values obtained ranged from 2.8 to 3.7 MPa at 680°C. The current study shows that the brazing temperature at 680 °C is the most favorable to braze Cu/Cu foam/Cu. Lower brazing temperatures minimize operational costs by saving time and energy. The American Welding Society (2006) has stated that a lower brazing temperature minimizes heating effects such as annealing, grain growth, and distortion of the substrate. Moreover, a lower brazing temperature reduces the interactions between substrate and filler metal, overcoming possible erosions of the substrate. The shear strength in the current study is adequate to withstand the pressure of fluid flow in plate-fin heat exchanger application. Shah and Sekulić (2003) have reported that the plate-fin heat exchanger is designed for a moderate operating pressure which is less than 700 kPa. Hudson Products Corporation (2007) has developed the air-cooled heat exchanger with an airflow pressure of 345–689 kPa.
The fracture behavior of Cu fractured surfaces from the Cu/Cu foam shear test was observed. There is a mixture of tear and cleavage regions in the BSE images of the Cu fractured surfaces. The enlarged area under the shear stress–strain curves of the brazed Cu/Cu foam (Figure 5) and tear regions in BSE images (Figure 6) shows evidence of ductile behavior. BSE images show multiple crack formations were found perpendicular to the stress loading direction, then continue propagating to develop tear region, followed by brittle cleavages. Several tear regions were observed as smooth fractures probably due to shear band formation and sliding (Yang et al., 2019). There are significant differences in BSE image of the Cu substrate shear fracture surface of foam A, foam B, and foam C. As seen on the low magnification (500 µm scale) BSE image of Figure 6, a greater proliferation of patch marks on the Cu fractured surface was observed as the pore density of Cu foam increased (from foam A to foam B to foam C). The increased number of patch marks on foam C indicates high amounts of Cu foam branches were brazed with the Cu substrate. However, high amounts of brazed branches are not an indication of strong bond formation as shown in shear strength result. Based on previous results, low shear strength was obtained in the brazing joint of Cu/Cu foam using 40 µm filler for foam C (having large amounts of branches) as compared to foam A (smaller amounts of branches). This was due to the small pore sizes and hollow structures of the Cu foam C interconnected branches (Figure 1). Figure 6A shows the Cu substrate surface from the Cu/Cu foam shear fracture consisting of a nonbrazed area due to the hollow structure of Cu foam. This nonbrazed area was surrounded by fractured Cu foam, indicating the foam has a hollow structure. The dark gray was found on the tear region surface which shows the filler presence and diffuses into the Cu foam branches. The tear region presents a ductility of Cu/Cu foam interface before experiences a brittle fracture by cleavage formations. The EDX point analysis on the tear region (Figure 6) shows the P and/or Ni enriched. The possible phases that may present are Cu3P and Ni3P existence as reported in the previous work (Zahri et al., 2021). The past work has conducted X-ray diffraction (XRD) for the phase determination on the Cu fractured surface from the shear test of Cu/Cu foam with Cu-9.0Sn-7.0Ni-6.0P filler. The brittle phases of Cu3P and Ni3P have appeared in the XRD pattern. Other than that, the mapping analysis was carried out on Cu fractured surface. There are noticeable amounts of phosphorus and nickel elements that have been accumulated in both tear and cleavage fracture. The XRD and mapping analysis in the past work support that the brittle phases of Cu3P and Ni3P have been concentrated on the fractured area. While the side-view BSE images of Cu substrate surface from the Cu/Cu foam shear fracture have shown that the crack formation has propagated along the filler region, higher amounts of filler region were observed for the brazed joint interface Cu/Cu foam A as compared to the brazed Cu/Cu foam B and Cu/Cu foam C. This was due to the large pore sizes in foam A which are saturated with the filler. In contrast, Cu foam C has a higher number of branches, which are reflected in the accumulation of filler region, as observed on the Cu substrate surface of the Cu/Cu foam shear fracture. The distribution of the filler region was nonhomogeneous as expected from the highly porous interconnected structure of the Cu foam. The highest shear strength obtained in brazed Cu/Cu foam A can be attributed to the large formation of filler regions.
Conclusion
The joining and compressive strength of Cu/Cu foam/Cu measure the ability of foam in heat exchanger application. The large branch area with a less branch number of foam A leads to higher brazed joint strength but lower compressive strength than that of foam B and foam C. The brazed Cu/Cu foam/Cu possesses a ductile behavior that manages to resist the compressive deformation by absorbing excess energy. The Cu/Cu foam brazed joint also capable in absorbing energy before the sheared off occur. The enlarged area under the shear stress–strain curve of brazed joint presents the Cu/Cu foam joining owns a ductile behavior. However, a cleavage fracture (brittle behavior) was spotted on the Cu substrate fractured surface from the shear test of Cu/Cu foam. The presence of Ni and a high concentration of P in the brazed joint causes the brittle behavior occurrence.
Data Availability Statement
The raw data supporting the conclusions of this article will be made available by the authors, without undue reservation.
Author Contributions
NM, FY, H, and NS contributed to the research design and analysis of the research work. NM contributed on the data collection while IB and SK helped in providing the advice on the research work. NM wrote the first draft of the manuscript and other authors checked and revised the manuscript.
Conflict of Interest
The authors declare that the research was conducted in the absence of any commercial or financial relationships that could be construed as a potential conflict of interest.
Acknowledgments
The authors extend their appreciation to the Deanship of Scientific Research at King Khalid University for funding this work through the research groups program under grant number RGP.2/166/42 and RU-Grant–Faculty Program, University Malaya (GPF053A-2018) for the purchasing the research materials.
References
Abadi, G. B., Kim, D. Y., Yoon, S. Y., and Kim, K. C. (2016). Thermal Performance of a 10-kW Phase-Change Plate Heat Exchanger with Metal Foam Filled Channels. App Therm. Eng. 99, 790. doi:10.1016/j.applthermaleng.2016.01.156
Alavi, R., Trenggono, A., Champagne, S., and Hermawan, H. (2017). Investigation on Mechanical Behavior of Biodegradable Iron Foams under Different Compression Test Conditions. Metals 7, 202. doi:10.3390/met7060202
American Welding Society (Aws), (2006). C3 on Brazing and solderingBrazing Handbook. 5th Edition. Miami, FL: American Welding Society.
Boomsma, K., Poulikakos, D., and Zwick, F. (2003). Metal Foams as Compact High Performance Heat Exchangers. Mech. Mater. 35, 1161–1176. doi:10.1016/j.mechmat.2003.02.001
Chein, R., Yang, H., Tsai, T.-H., and Lu, C. (2009). Experimental Study of Heat Sink Performance Using Copper Foams Fabricated by Electroforming. Microsyst Technol. 16, 1157–1164. doi:10.1007/s00542-009-0950-y
Chen, J., Li, X., Li, W., He, J., Li, C., Dai, S., et al. (2017). Study on the Compression Properties and Deformation Failure Mechanism of Open-Cell Copper Foam. Adv. Eng. Mater. 19, 1600861. doi:10.1002/adem.201600861
Ghosh, I. (2009). How Good Is Open-Cell Metal Foam as Heat Transfer Surface?. J. Heat Trans. 131, 1. doi:10.1115/1.3160537
Gnyloskurenko, S., Nakamura, T., Byakova, A., Podrezov, Y., Ishikawa, R., and Maeda, M. (2005). Development of Lightweight Al Alloy and Technique. Can. Metallurgical Q. 44, 7–12. doi:10.1179/00084430579440974210.1179/cmq.2005.44.1.7
Metal foam market analysis by material (Aluminium, Nickel, Magnesium, Copper) by application (heat exchanger, energy absorbers, side impact bars), by end use and segment forecast, 2018-2025. Grand View Research. (2017). Retrieved from http://grandviewresearch.com.
Haidar, S., and Sekh, M. (2018). Effects of Production Parameters on Density and Tensile Properties of Aluminium MMC Foam. Int. J. Adv. Manage. Technol. Eng. Sci. 8, 924. Retrieved from https://www.researchgate.net/publication/326624037_Effects_of_Production_ Parameters_on_Density_and_Tensile_Properties_of_Aluminium_MMC_Foam.
Hangai, Y., Utsunomiya, T., Kuwazuru, O., Kitahara, S., and Yoshikawa, N. (2015). Deformation and Plateau Region of Functionally Graded Aluminum Foam by Amount Combinations of Added Blowing Agent. Materials 8, 7161–7168. doi:10.3390/ma8105366
Heo, H., Kim, G., Kim, D. Y., Moon, C., Kim, K. C., Jung, K., et al. (2019). Microstructure and Mechanical Properties of Ni Foam/stainless Steel Joint Brazed Using Ni-Based Alloy. Mater. Sci. Eng. A 740-741, 63–70. doi:10.1016/j.msea.2018.10.022
Hu, H., Weng, X., Zhuang, D., Ding, G., Lai, Z., and Xu, X. (2016). Heat Transfer and Pressure Drop Characteristics of Wet Air Flow in Metal Foam under Dehumidifying Conditions. Appl. Therm. Eng. 93, 1124–1134. doi:10.1016/j.applthermaleng.2015.09.019
Hudson Products Corporation. (2007). The Basic of Air-cooled Heat Exchangers. Available at: https://files.chartindustries.com/hudson/BasicsofACHEBrochure-Web.pdf.
Jarvis, T., Voice, W., and Goodall, R. (2011). The Bonding of Nickel Foam to Ti-6Al-4V Using Ti-Cu-Ni Braze Alloy. Mater. Sci. Eng. A 528, 2592–2601. doi:10.1016/j.msea.2010.11.077
Kaya, A. C. (2020). In situ shear Behavior of Open-Cell Austenitic 316L Steel Foams. Mater. Chem. Phys. 252, 123303. doi:10.1016/j.matchemphys.2020.123303
Kim, S-H., Heo, H-J., Yoon, T-J., and Kang, C-Y. (2016). Effect of Bonding Pressure and Bonding Time on the Tensile Properties of Cu-Foam/Cu-Plate Diffusion Bonded Joint. Korean J. Met. Mat 54, 899. doi:10.3365/KJMM.2016.54.12.899
Liu, P., Tan, Q., Wu, L., and He, G. (2010). Compressive and Pseudo-elastic Hysteresis Behavior of Entangled Titanium Wire Materials. Mater. Sci. Eng. A 527, 3301–3309. doi:10.1016/j.msea.2010.02.071
Liu, X.-h., Huang, H.-y., and Xie, J.-x. (2014). Effect of Strain Rate on the Compressive Deformation Behaviors of Lotus-type Porous Copper. Int. J. Miner Metall. Mater. 21, 687–695. doi:10.1007/s12613-014-0959-9
Mancin, S., Zilio, C., Diani, A., and Rosetto, L. (2012). Experimental air heat transfer and pressure drop through copper foams. Exp. Therm. Fluid Sci. 36, 224–232. doi:10.1016/j.expthermflusci.2011.09.016
Nannan, C., Yi, F., Jie, C., Bin, L., Fanyan, C., and Jingsong, Z. (2013). Vacuum Brazing Processes of Aluminum Foam. Rare Metal Mater. Eng. 42, 1118–1122. doi:10.1016/S1875-5372(13)60072-7
Nawaz, K., Bock, J., and Jacobi, A. M. (2012). Thermal-hydraulic Performance of Metal Foam Heat Exchangers [Paper Presentation 2012, July 16-19]. 14th in International Refrigeration and Air Conditioning Conference (Indiana, US: Purdue University). Retrieved from https://docs.lib.purdue.edu/iracc/1283/. doi:10.1615/tfec2018.tfh.020802
Ochiai, S., Nakano, S., Fukazawa, Y., Aly, M. S., Okuda, H., Kato, K., et al. (2010). Tensile Deformation and Failure Behavior of Open Cell Nickel and Copper Foams. Mater. Trans. 51, 699–706. doi:10.2320/matertrans.M2009383
Odabaee, M., and Hooman, K. (2012). Metal Foam Heat Exchangers for Heat Transfer Augmentation from a Tube Bank. Appl. Therm. Eng. 36, 456–463. doi:10.1016/j.applthermaleng.2011.10.063
Ramos, A. I. C., and Dunand, D. C. (2012). Preparation and Characterization of Directionally Freeze-Cast Copper Foams. Metals 2, 265–273. doi:10.3390/met2030265
Ribeiro, G. B., Barbosa, J. R., and Prata, A. T. (2012). Performance of Microchannel Condensers with Metal Foams on the Air-Side: Application in Small-Scale Refrigeration Systems. App Therm. Eng. 36, 152160. doi:10.1016/j.applthermaleng.2011.12.032
Rybar, R., Beer, M., Kudelas, D., and Pandula, B. (2016). Copper Metal Foam as an Essential Construction Element of Innovative Heat Exchanger. Metalurgija 55, 489. Retrieved from: https://hrcak.srce.hr/file/226427.
Sami, M. M., Zaharinie, T., Yusof, F., and Ariga, T. (2020). Investigation on Strength and Microstructural Evolution of Porous Cu/Cu Brazed Joints Using Cu-Ni-Sn-P Filler. Metals 10, 416. doi:10.3390/met10030416
Saw, L. H., Ye, Y., Yew, M. C., Chong, W. T., Yew, M. K., and Ng, T. C. (2017). Computational Fluid Dynamics Simulation on Open Cell Aluminium Foams for Li-Ion Battery Cooling System. Appl. Energ. 204, 1489–1499. doi:10.1016/j.apenergy.2017.04.022
Shah, R. K., and Sekulić, D. P. (2003). Fundamentals of Heat Exchanger Design. Hoboken, New Jersey: John Wiley & Sons. doi:10.1002/9780470172605
Shirzadi, A. A., Zhu, Y., and Bhadeshia, H. K. D. H. (2008). Joining Ceramics to Metals Using Metallic Foam. Mater. Sci. Eng. A 496, 501–506. doi:10.1016/j.msea.2008.06.007
Song, Y. F., Xiao, L. R., Zhao, X. J., Zhou, H., Zhang, W., Guo, L., et al. (2015). Fabrication, Microstructure and Shear Properties of Al Foam Sandwich. Mater. Manufacturing Process. 31, 1046–1051. doi:10.1080/10426914.2015.1037900
Srinath, M. S., Sharma, A. K., and Kumar, P. (2011). A New Approach to Joining of Bulk Copper Using Microwave Energy. Mater. Des. 32, 2685–2694. doi:10.1016/j.matdes.2011.01.023
Sun, R., Zhu, Y., Guo, W., Peng, P., Li, L., Zhang, Y., et al. (2018). Microstructural Evolution and Thermal Stress Relaxation of Al2O3/1Cr18Ni9Ti Brazed Joints with Nickel Foam. Vacuum 148, 18–26. doi:10.1016/j.vacuum.2017.10.030
Tan, W.-C., and Chong, K.-K. (2016). Simplification of Heat Transfer Modelling for 3-D Open Cell Copper Foam by Using Single-Direction Aligned Cylinder-Bank Geometry. Appl. Therm. Eng. 107, 1192–1200. doi:10.1016/j.applthermaleng.2016.07.035
Tuzovskaya, I., Pacheco Benito, S., Chinthaginjala, J. K., Reed, C., Lefferts, L., and Van Der Meer, T. (2012). Heat Exchange Performance of Stainless Steel and Carbon Foams Modified with Carbon Nano Fibers. Int. J. Heat Mass Transfer 55, 5769–5776. doi:10.1016/j.ijheatmasstransfer.2012.05.073
Ubertalli, G., Ferraris, M., and Bangash, M. K. (2017). Joining of AL-6016 to Al-Foam Using Zn-Based Joining Materials. Composites A: Appl. Sci. Manufacturing 96, 122–128. doi:10.1016/j.compositesa.2017.02.019
Vesenjak, M., Hokamoto, K., Sakamoto, M., Nishi, T., Krstulović-Opara, L., and Ren, Z. (2016). Mechanical and Microstructural Analysis of Unidirectional Porous (UniPore) Copper. Mater. Des. 90, 867–880. doi:10.1016/j.matdes.2015.11.038
Wan, Z., Liu, B., Zhou, W., Tang, Y., Hui, K. S., and Hui, K. N. (2012). Experimental Study on Shear Properties of Porous Metal Fiber Sintered Sheet. Mater. Sci. Eng. A 544, 33–37. doi:10.1016/j.msea.2012.02.070
Wang, H., and Guo, L. (2016). Experimental Investigation on Pressure Drop and Heat Transfer in Metal Foam Filled Tubes under Convective Boundary Condition. Chem. Eng. Sci. 155, 438–448. doi:10.1016/j.ces.2016.08.031
Xie, S., and Evans, J. R. G. (2004). High Porosity Copper Foam. J. Mater. Sci. 39, 5877–5880. doi:10.1023/B:JMSC.0000040107.04387.b7
Yang, G.-N., Shao, Y., and Yao, K.-F. (2019). Understanding the Fracture Behaviors of Metallic Glasses-An Overview. Appl. Sci. 9, 4277. doi:10.3390/app9204277
Zaharinie, T., Huda, Z., Izuan, M. F., and Hamdi, M. (2015). Development of Optimum Process Parameters and a Study of the Effects of Surface Roughness on Brazing of Copper. Appl. Surf. Sci. 331, 127–131. doi:10.1016/j.apsusc.2015.01.078
Zahri, N. A. M., Yusof, F., Ariga, T., Haseeb, A. S. M. A., Mansoor, M. A., and Sukiman, N. L. (2019). Open Cell Copper Foam Joining: Joint Strength and Interfacial Behaviour. Mat Sci. Techno 35, 2004. doi:10.1080/02670836.2019.1661649
Zahri, N. A. M., Yusof, F., Miyashita, Y., Ariga, T., Haseeb, A. S. M. A., Jamadon, N. H., et al. (2020). Brazing of Porous Copper Foam/copper with Amorphous Cu-9.7Sn-5.7Ni-7.0P (Wt%) Filler Metal: Interfacial Microstructure and Diffusion Behavior. Weld World 64, 209. doi:10.1007/s40194-019-00804-2
Zahri, N. A. M., Yusof, F., Miyashita, Y., Ariga, T., Haseeb, A. S. M. A., and Sukiman, N. L. (2021). Effect of Porous Copper Pore Density on Joint Interface: Microstructure and Mechanical Analysis. J. Harbin Ins Tech. doi:10.11916/j.ssn.1005-9113.2020056
Zhang, Y., Long, E., and Zhang, M. (2018). Experimental Study on Heat Sink with Porous Copper as Conductive Material for CPU Cooling. Mater. Today Proc. 5, 15004–15009. doi:10.1016/j.matpr.2018.04.046
Zhao, C. Y., Lu, W., and Tassou, S. A. (2006). Thermal Analysis on Metal-Foam Filled Heat Exchangers. Part II: Tube Heat Exchangers. Int. J. Heat Mass Transfer 49, 2762–2770. doi:10.1016/j.ijheatmasstransfer.2005.12.014
Zhao, C. Y. (2012). Review on Thermal Transport in High Porosity Cellular Metal Foams with Open Cells. Int. J. Heat Mass Transfer 55, 3618–3632. doi:10.1016/j.ijheatmasstransfer.2012.03.017
Zhong, Z., Zhou, J., Shen, X., and Ling, X. (2012). Study on Vacuum Brazing of Glass to Kovar ® Alloy with Cu-Ni-Sn-P. Weld J. 91, 237. Retrieved from: http://files.aws.org/wj/supplement/WJ_2012_09_s237.pdf.
Keywords: metal foam, porous, brazing, deformation, compressive, shear, stress-strain, fracture behavior
Citation: Mohd Zahri NA, Yusof F, Badruddin IA, Haseeb ASMA, Sukiman NL and Kamangar S (2021) Deformation and Fracture Behavior of Sandwiched Copper Foam Brazed Joint Using Amorphous Copper–Tin–Nickel–Phosphorus Filler. Front. Mater. 8:665219. doi: 10.3389/fmats.2021.665219
Received: 07 February 2021; Accepted: 04 May 2021;
Published: 31 May 2021.
Edited by:
Guang Zeng, Central South University, ChinaCopyright © 2021 Mohd Zahri, Yusof, Badruddin, Haseeb, Sukiman and Kamangar. This is an open-access article distributed under the terms of the Creative Commons Attribution License (CC BY). The use, distribution or reproduction in other forums is permitted, provided the original author(s) and the copyright owner(s) are credited and that the original publication in this journal is cited, in accordance with accepted academic practice. No use, distribution or reproduction is permitted which does not comply with these terms.
*Correspondence: Farazila Yusof, ZmFyYXppbGFAdW0uZWR1Lm15