 Yixuan Chen
 Jian Jiang
 Xiaojun Qin1
 Qian Feng
- 1Hubei Key Laboratory of Earthquake Early Warning, Institute of Seismology, China Earthquake Administration, Wuhan, China
- 2Wuhan Institute of Earthquake Engineering Co. Ltd., Wuhan, China
The bolted connection is widely utilized in engineering to practically and rigidly couple structural components. The integrity of the connection is paramount to the safety of the structure and has prompted the development of many monitoring methods, including the piezoelectricity-based active sensing method. However, the active sensing method cannot quantify bolt looseness due to the unclear relationship between bolt looseness and the single monitoring index typically used in the active sensing method. Thus, the authors propose the unique combination of a one-dimensional convolutional neural network (1DCNN) and multichannel active sensing for quantitative monitoring of bolted connections. In an experiment, piezoelectric ceramic transducer (PZT) patches are bonded on steel plates connected by a bolt. Each patch is wired to a multichannel active sensing monitoring system. After obtaining multichannel stress wave signals at different looseness levels, a looseness vector is calculated to generate training and validation datasets. A baseline 1DCNN model and a novel model improved using the convolutional block attention module (CBAM) are used to monitor the bolt looseness. Finally, the authors verify that the multichannel active sensing method combined with the 1DCNN model can accurately perform quantitative monitoring of bolt looseness, and the monitoring accuracy of the baseline 1DCNN model is above 91.07% in three different specimens. Compared with the baseline 1DCNN model, the monitoring accuracy of the CBAMCNN model improved by approximately 5%. Overall, the method proposed in this article offers a new and highly accurate approach for quantitative monitoring of bolted connections.
Introduction
The bolted connection has been extensively applied across many types of steel structures, such as large stadiums, steel-framed residences, and high-speed railways. Bolted connections are advantageous in terms of simple construction, convenient installation and replacement, safe operation, and reliability. However, since bolts are often used to couple dissimilar structural components, the connection is likely to introduce dynamic nonlinearities when under the action of unfavorable forces such as cyclic and vibration loads (Lacayo and Allen, 2019; Lacayo et al., 2019). This introduction of nonlinear behavior is difficult to solve, and it can also degrade structural performance and eventually induce structural failure if not addressed in a timely manner. Therefore, the state of the bolted connection should be closely monitored in real time to improve the safety of engineering structures (Xu et al., 2018).
Methods to monitor bolt looseness are based mainly on structural health–monitoring principles, which include, but are not limited to, the vibration-based method (Amerini et al., 2010; Li and Jing, 2020), the optical fiber sensing–based method (Guarino and Hamilton, 2017; You et al., 2020), the percussion-based method (Wang et al., 2019; Wang et al., 2020b; Wang and Song, 2020), the electromechanical impedance (EMI) method (Ritdumrongkul et al., 2003; Huo et al., 2017b; Wang et al., 2017), and methods based on the contact acoustic theory. Each of the methods mentioned above have unique limitations. Vibration-based monitoring approaches have difficulty detecting bolt looseness because low-order frequency responses of the connection are not sensitive to the local structural damage and high-frequency vibrations easily dissipate (Amerini et al., 2010). Percussion-based methods are highly dependent on human skill, while the accuracy of EMI methods is susceptible to unexpected changes in the surrounding environment. Methods based on contact acoustic theory include the active sensing method (Tao et al., 2016; Zhao et al., 2020), the high-order harmonics method (Li and Jing, 2017; Li et al., 2019), and the sideband modulation method (Meyer and Adams, 2015; Zhang et al., 2018). The analysis of high-order harmonics and spectral sidebands can shed light on nonlinear mechanisms of bolt loosening, but damping and instrumental noise can obfuscate information carried in high-frequency stress waves. On the other hand, the active sensing method provides superior performance due to the advantages of convenient implementation, fast response, and availability of a wide spectral bandwidth to perform monitoring. A concept of “smart washers” was proposed to monitor bolt looseness through a normalized wavelet energy index (Huo et al., 2017). Taking into account the aging of piezoceramic materials, the tracking of normalized coda wave energy helped to monitor the tightness of a single bolt (Hei et al., 2020). However, these methods are inadequate for conducting quantitative monitoring because they fail to accurately and quantitatively correlate bolt looseness states with a single monitoring index.
In recent years, research on piezoelectricity-based monitoring methods (i.e., including the impedance and active sensing methods) combined with machine learning have gradually attracted widespread attention. The methods combined EMI and back propagation neural networks (BPNNs) to inspect the looseness of bolted ball joints (Xu et al., 2019). Their method used the RMSD value of the EMI sub-band signal as the input and the torque level of the bolt joint as the expected output of the model. The LibSVM model in conjunction with the EMI method was used to identify the position of loose bolts (Zhang et al., 2017). An algorithm-based least square support vector machine was used to realize bolt state recognition (Wang et al., 2020). In their study, multivariate, multiscale fuzzy entropy from the stress wave signals was obtained and subsequently employed as the input for training the genetic algorithm and least squares support vector machine (GA-LSSVM). The output is the number of loose bolts. In a similar manner, the stacking-based ensemble learning classifier was employed to determine the looseness state of the bolt group (Wang et al., 2021). Compared with traditional machine learning algorithms, deep learning is more powerful and more adaptable, especially in solving more complex problems that are data driven. With the rapid development and widespread application of artificial intelligence, a variety of deep learning architectures have been developed, such as the convolutional neural network (CNN) (Avci et al., 2017), long short-term memory (LSTM) (Huang et al., 2015; Luo et al., 2019), and generative adversarial networks (GANs) (Lei et al., 2020; Liu et al., 2020). In particular, the convolutional neural network is often used in structural health–monitoring tasks due to its ability to share weights, form local connections, and down-sample (Goodfellow et al., 2016). The Bayesian model and modal strain energy were used to determine the bolt looseness (Hu et al., 2018). The simultaneous use of CNNs and the analysis of guided waves helped to identify the location of the damage in a pressure vessel (Hu et al., 2020), in a steel plate structure (Lim and Sohn, 2020), and in aerospace structural material (Xu et al., 2019). The above discussion of the literature shows that significant research activity is currently centered around the use of CNNs to identify surface damage of structures by extracting structural damage information from monitoring data; however, there are limited reports regarding the use of CNNs to quantify bolt looseness based on active sensing signals.
Therefore, this article presents the development and implementation of a one-dimensional (1D) CNN model that is integrated with multichannel active sensing to detect the looseness of bolted connections in steel structures. Through the active sensing method, multichannel stress wave signals are obtained under different levels of torque. Multi-domain looseness indicators from different channels are then calculated and concatenated into a one-dimensional index vector based on the order of the channels. The mixture of data from different channels enables a comprehensive evaluation of bolt looseness severity. The 1DCNN model is trained using these vectors to perform bolt looseness identification. Moreover, spatial and channel attention mechanisms are introduced into the baseline 1DCNN model to improve the recognition accuracy. Finally, the feasibility of the proposed method is demonstrated through experiments. It should be noted that this article presents the first attempt to combine the active sensing method with a 1DCNN improved by the CBAM to explore the quantitative monitoring of bolt looseness. The findings of this research have a great potential to open the door to the use of machine learning and active sensing in future monitoring applications for steel structures. Moreover, the findings can promote further development of automatic monitoring techniques that are based on the piezoelectric active sensing method. The rest of this article consists of four sections and is organized as follows: section two provides a detailed background of the methods proposed in this article, including the 1DCNN model, the spatial channel attention mechanism, the active sensing method, and the looseness index. Section three presents the experimental setup, while section four discusses the experimental results. Section five closes with the conclusions.
Theoretical Background
Figure 1 presents the fundamental framework of the method presented in this article. In step 1, a multichannel active sensing monitoring system is set up, and the data acquisition for training and validation is carried out. In step 2, multi-domain looseness indices for different torque levels are calculated and are later combined into a one-dimensional looseness index vector based on the order of the channels. In step 3, the training and validation datasets are input to the baseline 1DCNN model and the improved CBAMCNN model for determining the final model. In step 4, a new test dataset is fed into the finalized model for quantitatively monitoring the looseness of the bolt. In this study, seven degrees of looseness are recognized and labeled L1, L2...L7.
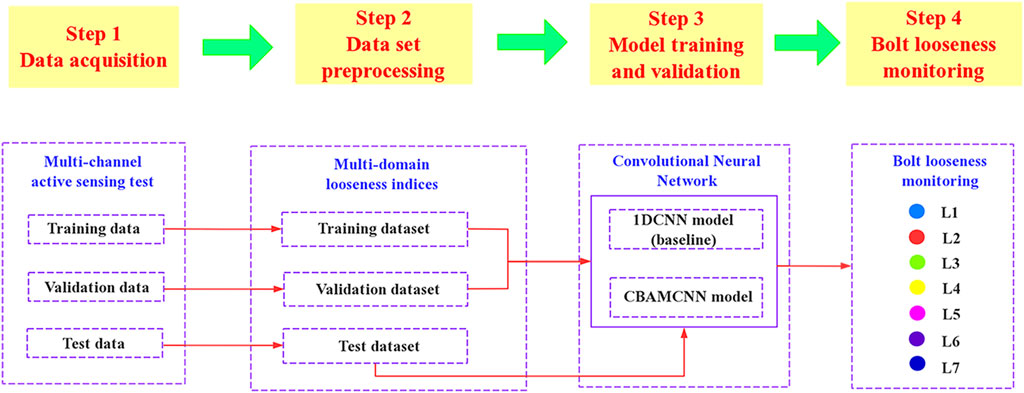
FIGURE 1. Quantitative monitoring method of bolt looseness.
Multichannel Piezoelectric Active Sensing
The principle of active sensing being applied to monitoring bolt looseness is depicted in Figure 2. Considering the symmetry of the steel plate, four PZT patches labeled PZT1–4 are employed in the experiment. PZT1 serves as an actuator, while the rest are sensors (i.e., PZT2, PZT3, and PZT4). The stress wave is generated by PZT1 after being excited by a frequency sweep signal. The stress wave propagates through the contact surface of the steel plates to reach the sensors. A close relation between the propagating energy of the stress wave and the bolt connection state can be observed (Zhang et al., 2016). When the steel plates are tightly connected, the stress wave can propagate to the bottom plate efficiently. Otherwise, the stress wave dissipates rapidly.
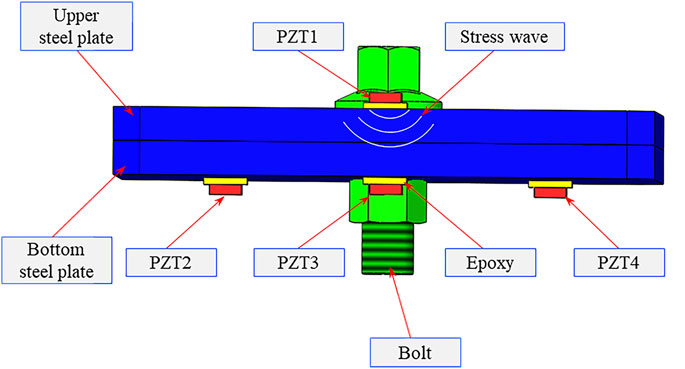
FIGURE 2. Diagram illustrating the active sensing approach to monitor bolt looseness.
Multichannel and Multi-Domain Feature Extraction
In order to gauge the efficiency of the model and its recognition accuracy, multi-domain looseness indices are calculated to analyze the stress wave signals, which carry bolt looseness information. The looseness indices used in this experiment include the following: time-domain signal energy, the maximum value of the average periodogram, and three-layer wavelet packet decomposition energy. These indices are described below.
Time Domain Signal Energy
The process of stress wave propagation is accompanied by energy dissipation, so the signal energy can be used to characterize the bolt looseness. The signal energy refers to the sum of the squares of the time-domain amplitude, as shown below:
where
The Maximum Value of the Average Periodic Diagram
In this study, the average periodic diagram method proposed by Welch is used to perform spectral analysis on the received signals. By using the windowing and averaging processing techniques, random fluctuations of the signal can be reduced to ensure sufficient spectral resolution (Bartlett, 1950). The average periodic diagram method provides a new perspective for analyzing the stress wave signal. The steps to the method are as follows:
a) Divide the received signal
where
b) Apply the windowing function
where
c) Perform the discrete Fourier transform of each signal sequence as shown below:
where
d) Calculate the average value of the power spectrum and estimate for each signal sequence as shown below:
where
e) Obtain the maximum value of the average periodic diagrams through the following relation:
Wavelet Packet Decomposition Energy
Wavelet packet decomposition is a multi-resolution analysis method, which has been widely used in structural damage research (Toliyat et al., 2003; Teotrakool et al., 2009; Liu et al., 2018). It can perform multilevel and adaptive decomposition of the original signal through the wavelet tree.
In this study,
In order to accelerate model training and increase recognition accuracy, the looseness index vector above is standardized to
One-Dimensional Convolutional Neural Network Model
Inspired by the human visual nervous system, the CNN, a state-of-the-art deep learning model, has demonstrated excellent performance in a wide variety of classification tasks. Local connections and shared weights are prominent features of CNNs. These unique features effectively decrease the number of weights and accelerate training.
In this study, a baseline 1DCNN model was established to monitor the bolt looseness more efficiently. Its framework is presented in Figure 3. As seen in the figure, the baseline 1DCNN model is composed of an input layer, a convolutional layer (CL), a flattening layer (FL), a fully connected layer (FC), and a SoftMax layer. In this model, a convolutional layer consists of three convolution kernels of different sizes (i.e., 1 × 3, 1 × 4, and 1 × 5). The kernels can extract advanced features and fuse the information of bolt looseness from different stress wave signals at the same time. Then, the flattening layer expands the looseness information extracted by the convolutional layers and maps the information onto the fully connected layer. Finally, a SoftMax function presents the probability of each class. Tanh activation functions are used in the model in order to improve the fidelity of the input information and encourage rapid convergence. Furthermore, dropout (Fraser-Thomas et al., 2008) operations are employed to mitigate overfitting. The Adam optimizer (
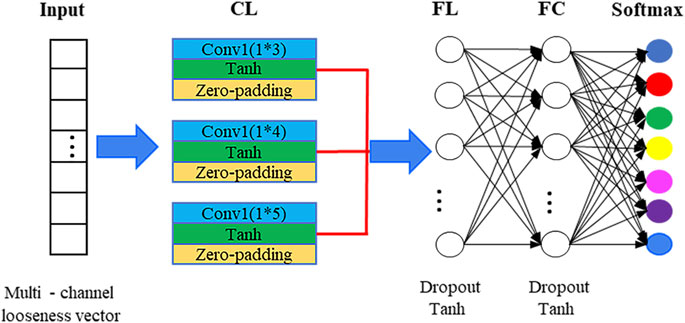
FIGURE 3. Architecture diagram of the baseline 1DCNN model.
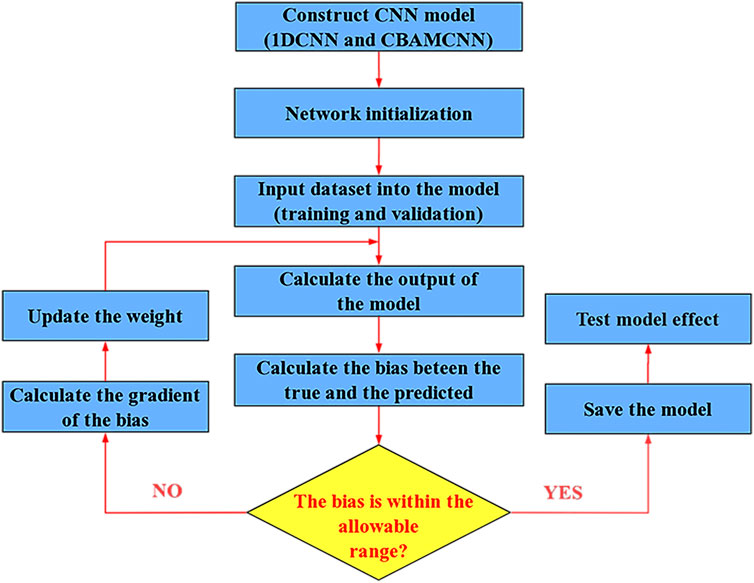
FIGURE 4. Training process of the baseline model (1DCNN) and the improved model (CBAMCNN).
Convolutional Block Attention Module
The convolutional block attention module (CBAM) was implemented in this study to improve the monitoring accuracy of the model. As shown in Figure 5, the CBAM consists of the channel attention mechanism and the spatial attention mechanism (Ban et al., 2020; Zhao et al., 2020). The overall computational process of the CBAM can be summarized as follows. The feature
where
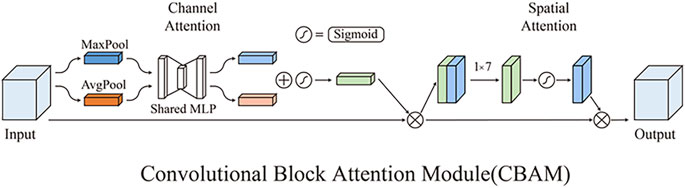
FIGURE 5. Calculation principle of the convolution block attention module.
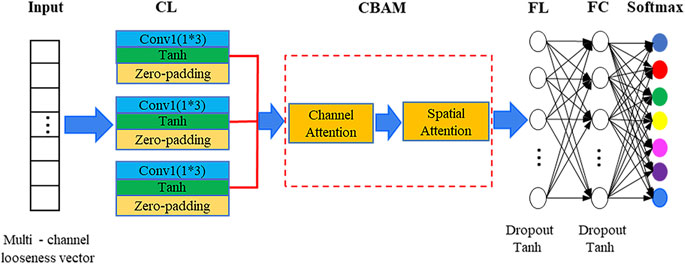
FIGURE 6. Architecture diagram of the CBAMCNN model.
For the sake of conciseness, the computational operations of the channel attention weight
where
Experimental Setup
As shown in Figure 7, in order to verify the method introduced in this study, a set of benchtop experiments was conducted on two steel plates connected by one M12 bolt. Each specimen is equipped with four PZT patches. PZT1, serving the role of the actuator, is installed on the upper steel plate. PZT2–PZT4, serving as sensors, are installed on the bottom steel plate. The epoxy adhesive used to bond the PZTs to the steel plates also electrically insulated the PZTs from the steel plate. The type of piezoelectric patch used in this experiment is the compression type, and its size is 10°mm3 × 10°mm3 × 0.5°mm3. The dimensions of the specimen are shown in Figure 8. As shown in Figure 9, a multifunction data acquisition system (NI USB-6363) with multichannel capacity collected data and transmitted excitation signals. The data acquisition system was connected to a laptop that ran LabVIEW. A power amplifier (Trek model 2100 HF) magnified the excitation signals. During the experiments, PZT1 generated a stress wave excited by a swept sine signal transmitted by the data acquisition system. After propagating and being modulated by the steel plate interface, the stress wave is captured by the three sensors at a sampling rate of 2 MHz. Subsequently, the received signals in different channels are used to calculate the looseness indices. The frequency of the swept sine signal in this study ranges from 100 Hz to 300 kHz with a duration of 0.5 s and an amplitude of 1 V. The loading of the specimen consisted of increasing the torque level from 0 Nm to 30 Nm at increments of 5 Nm, as listed in Table 1. Different torque values lead to different degrees of looseness. The experiments are repeated on specimen A, specimen B, and specimen C. For every looseness condition, the active sensing method is executed 100 times to construct an experimental dataset. The dataset has 560 and 140 samples for training and validation. Then, the baseline 1DCNN model and the improved model (CBAMCNN) using the attention mechanism are established to monitor the bolt looseness. In the training process, the model hyperparameters are adjusted and determined according to the loss function value and accuracy between the training dataset and the validation dataset. Finally, 140 test signals have been re-collected to achieve bolt looseness identification.
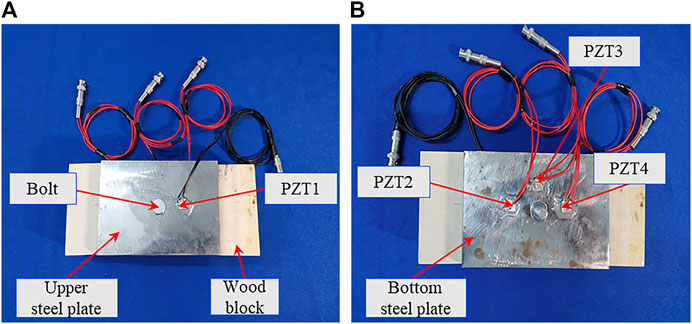
FIGURE 7. Multichannel active sensing sensor layout scheme. (A) Sensor layout scheme of the upper steel plate. (B) Sensor layout scheme of the bottom steel plate.
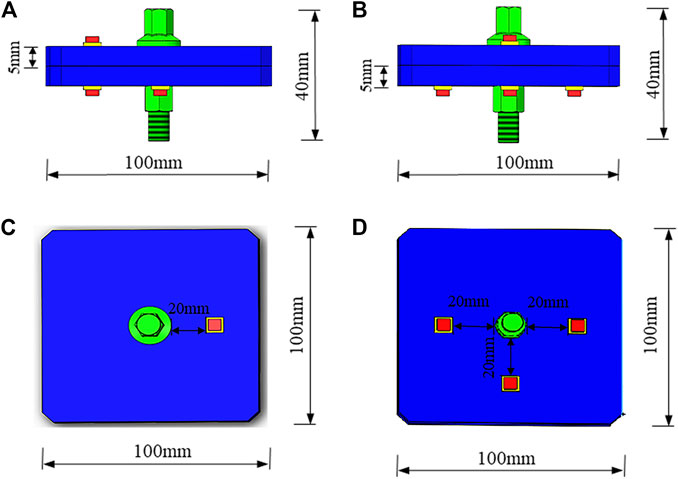
FIGURE 8. Detailed geometry of the specimen. (A) Front view. (B) Side view. (C) Up view. (D) Bottom view.
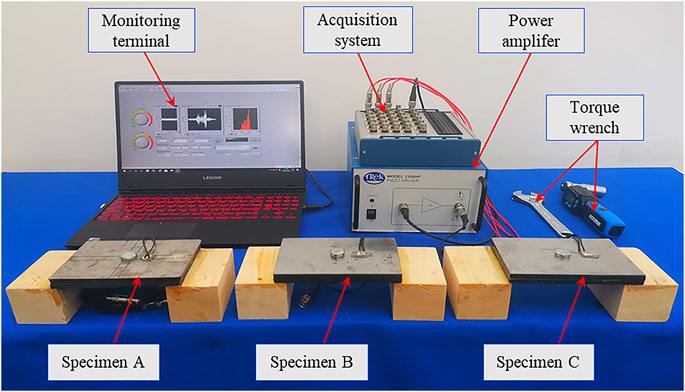
FIGURE 9. Experimental setup of monitoring the bolt looseness using the piezoelectric active sensing method.

TABLE 1. Torque values of different degrees of looseness.
Results
Experimental Results and Analysis Based on Wavelet Packet Analysis
Figure 10 shows the stress wave signals and wavelet packet energy of different torque levels, measured during the experiment with specimen A. The amplitudes of the received stress wave signals corresponding to different torque levels vary between –1 and 1 V. The amplitude of the received signal is therefore related to the bolt looseness. When the torque level reached 30 Nm, the maximum value of the stress wave signal reached 0.8 V. As the bolt loosened, the amplitude of the received signal decreased but followed a different path than when the bolt was tightened, thus making it difficult to quantitatively monitor the bolt looseness based solely on the amplitude. The presence of multiple peaks in each stress wave can be attributed to the different frequency components and the reflections of the stress wave within the connection assembly (Wang et al., 2021). On the other hand, the wavelet packet energy method can provide a clearer analysis of the received signals. As the torque level decreased, the wavelet packet energy was reduced in proportion to the dissipated energy of the stress wave. Thus, analysis based on wavelet packet energy can characterize the bolt looseness to a certain extent, but the characterization is not fully quantitative due to the undefined relationship between wavelet packet energy and the torque level.
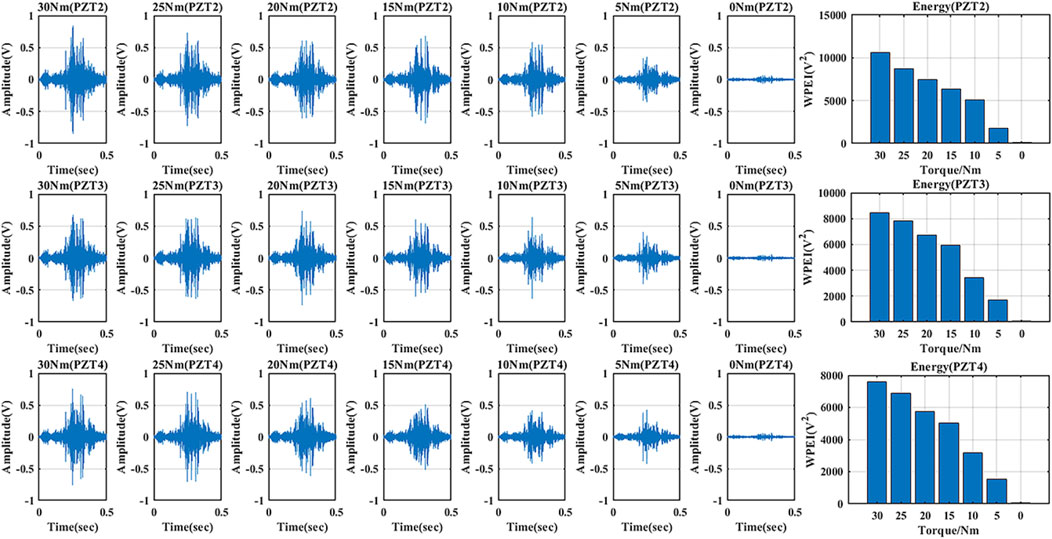
FIGURE 10. Stress wave signals and wavelet energy received in the three channels under different torque levels.
Looseness Indicators
In order to provide more looseness information, some indicators are extracted from the stress waves to characterize the bolt looseness. Indicators include the energy of the time-domain signal, the maximum value of the average periodogram (MVOMP), and the three-layer wavelet packet decomposition energy. For convenience, the authors only show the first four wavelet packet energy components. As shown in Figure 11, all the indicators can effectively represent the looseness of the bolt. As the torque decreases, the looseness indicators of different sensor channels decrease, which provides the looseness information from different perspectives. These diversified looseness indicators furnish a basis for data fusion with the CNN. Therefore, the looseness feature vectors of multi-domain indicators are concatenated to construct the corresponding dataset.
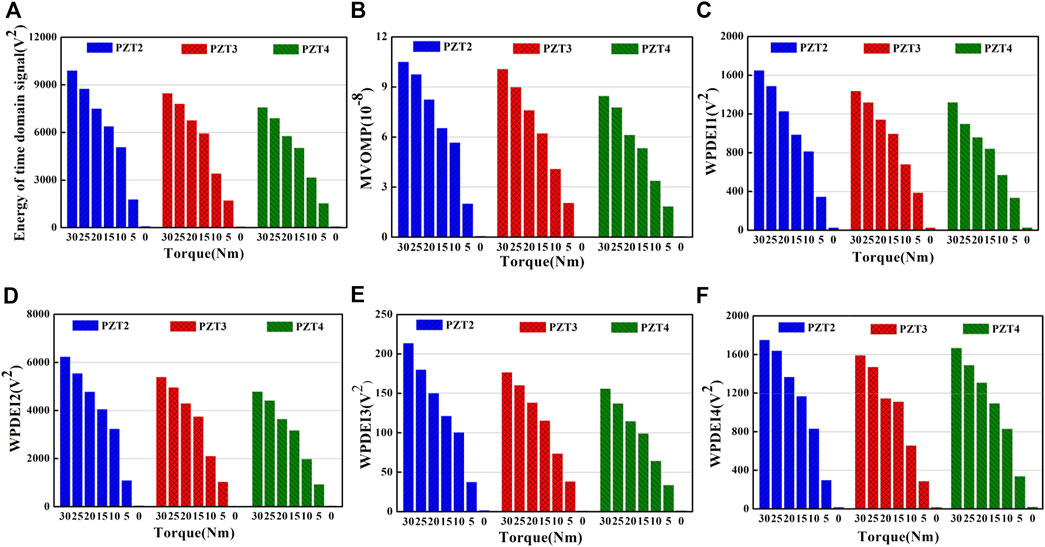
FIGURE 11. Looseness indicators of different channels under different torque levels. (A) Indicator of signal energy. (B) Maximum value of the mean periodogram. (C) First component of the wavelet packet energy. (D) Second component of the wavelet packet energy. (E) Third component of the wavelet packet energy. (F) Fourth component of the wavelet packet energy.
Quantitative Monitoring Results of the Convolutional Neural Network Model
In consideration of the drawbacks of traditional methods, both a baseline 1DCNN model and one improved by the attention mechanism are trained to quantitatively monitor the bolt looseness. The accuracy is set as the metric by which to evaluate the classification performance of the presented method. The accuracy is the ratio between the number of correct predictions and the total number of test datasets.
In order to observe the influence of channel availability on the recognition capabilities of the 1DCNN model, seven different scenarios of channel availability are used to train the baseline 1DCNN model. Single-channel, dual-channel, and multichannel scenarios, respectively, refer to cases where there are one, two, and three PZT sensors being used to monitor bolt looseness. According to the sensor layout scheme, the three cases of single-channel testing are the sole use of PZT2, PZT3, or PZT4. Likewise, the three cases of dual-channel testing include using the following PZT pairs: PZTs 2 and 3, PZTs 2 and 4, and PZTs 3 and 4. Finally, in multichannel testing, all three PZTs (i.e., PZTs 2–4) are used. Taking specimen A as an example, the evaluation indices for the different scenarios are listed in Table 2. As seen in the table, the use of all three channels yielded the best performance, and the accuracy is approximately 92.85%. The evaluation indices for the dual-channel scenario ranged from 88.57 to 90.71% and are higher than those for the single-channel scenario. Compared with the baseline 1DCNN model, the CBAMCNN model performed better for the multichannel (5% improvement) and the dual-channel (5.9% improvement) scenarios. However, the performance is similar when only one channel is used, likely because data from one channel is insufficient despite the improvements offered by the attention mechanism.

TABLE 2. Recognition result of the 1DCNN and CBAMCNN models.
In order to better understand the whole process of the 1DCNN model, PZT2 (single-channel), PZTs 2 and 4 (dual-channel) and PZTs 2–4 (multichannel) are selected to describe the training, validation, and testing processes according to the accuracy. The accuracy and loss curves during training and validation are shown in Figures 12A–C. In general, the model training is stable and convergent without overfitting. Model training is completed at 600 iterations, upon which the accuracy of the validation rose above 90%. The result of the test dataset is shown in the form of a confusion matrix. As shown in Figures 12D,E, the recognition errors of the multichannel scenario are less than those of the single-channel and dual-channel scenarios. Of the 140 test samples, there are, respectively, 18 and 15 misrecognitions for the single-channel and dual-channel scenarios and only 10 misrecognitions for the multichannel method.
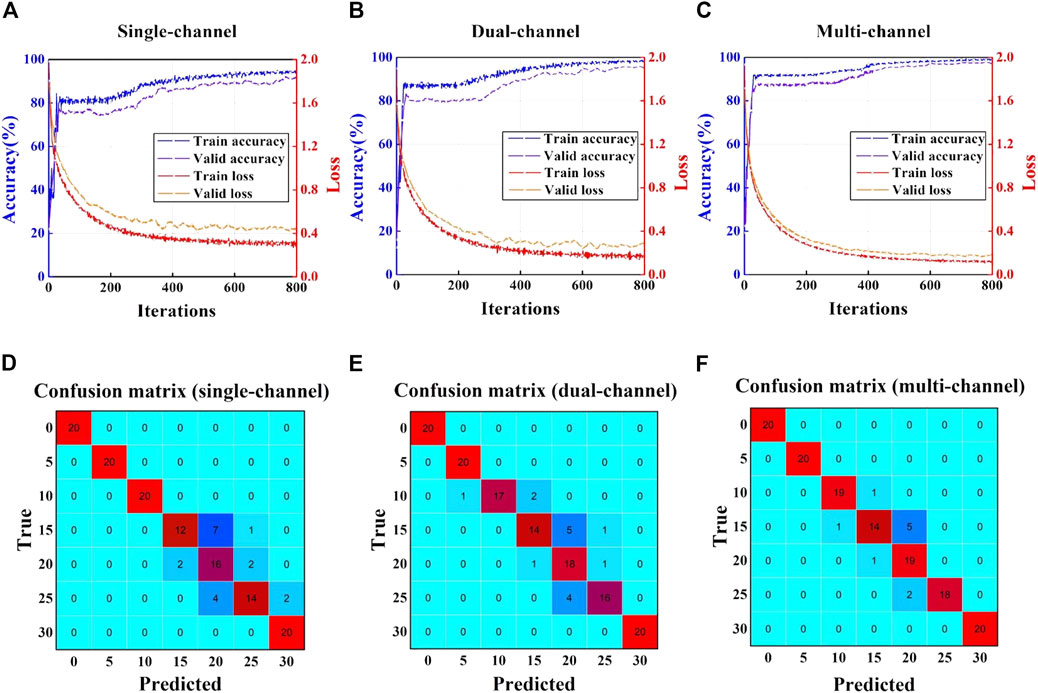
FIGURE 12. Training/validation process of the 1DCNN and the confusion matrix of the test dataset. (A) Accuracy and loss curves of the single-channel method (PZT2). (B) Accuracy and loss curves of the dual-channel method (PZTs 2 and 4). (C) Accuracy and loss curves of the multichannel method (PZTs 2–4). (D) Confusion matrix of the single-channel method (PZT2). (E) Confusion matrix of the dual-channel method (PZTs 2 and 4). (F) Confusion matrix of the multichannel method (PZTs 2–4).
Similarly, Figures 13A–C show the loss and accuracy curves for the CBAMCNN trained using data from PZT2 (single-channel), PZTs 3 and 4 (dual-channel), and PZTs 2–4 (multichannel). The CBAMCNN model surpassed the baseline model by reaching 95% validation accuracy when the training converged. In addition, compared with the 1DCNN model, the CBAMCNN model yielded fewer incorrect recognitions. The multichannel scenario had the least instances (i.e., only three misrecognitions out of 140 samples) of incorrect recognitions, followed by the dual-channel and the single-channel scenarios. The specific misrecognition is summarized by the confusion matrices in Figures 13D–F.
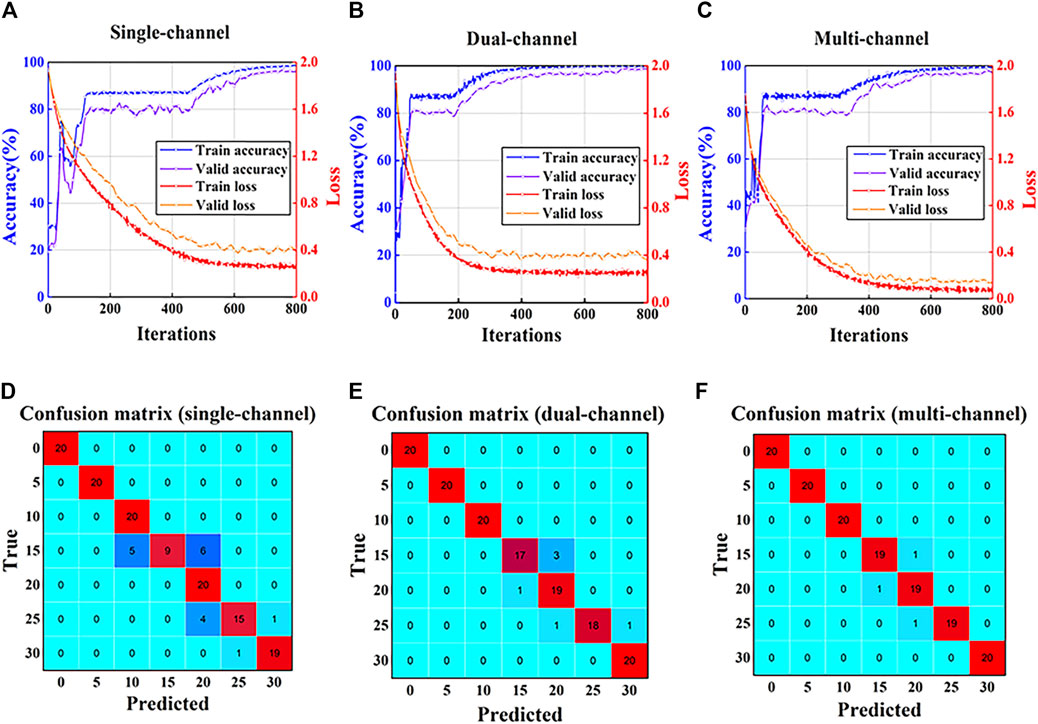
FIGURE 13. Training/validation process of the CBAMCNN and the confusion matrix of the test dataset. (A) Accuracy and loss curves of the single-channel method (PZT2). (B) Accuracy and loss curves of the dual-channel method (PZTs 3 and 4). (C) Accuracy and loss curves of the multichannel method (PZTs 2–4). (D) Confusion matrix of the single-channel method (PZT2). (E) Confusion matrix of the dual-channel method (PZTs 3 and 4). (F) Confusion matrix of the multichannel method (PZTs 2–4).
The Generality and Repeatability of the Method
In specimen A, the proposed method can monitor the bolt looseness with high accuracy. In order to verify the generality of the method, the process described in Experimental Setup, Results (i.e., data collection, feature extraction, model training, verification, and testing) was carried out and repeated 10 times for specimens B and C. The average recognition accuracy is summarized in Table 3. The results reveal that the proposed method has good classification performance, and the improved CBAMCNN model can reach a testing accuracy of over 95.78% in all three different specimens. However, the testing accuracy of the 1DCNN model is below 93.64%.
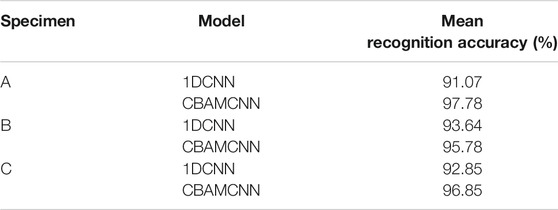
TABLE 3. Mean recognition accuracy for three different specimens.
Discussion
Since a single monitoring index used traditionally in active sensing cannot quantify the bolt looseness, a method that analyzes data from multichannel active sensing with a CNN improved with the CBAM (i.e., a channel and spatial attention mechanism) was proposed to quantitatively monitor bolt looseness. Experimental results obtained from the three different specimens demonstrated that the method can quantify bolt looseness with an accuracy of more than 95.78%.
Single monitoring indices, such as the peak value of a time reversal signal (Tao et al., 2016) and normalized coda wave energy (Hei et al., 2020), are unable to provide true quantitative monitoring due to the dispersion of the single indices. On the other hand, through powerful feature extraction and classification abilities, the trained 1DCNN model can quantitatively monitor the state of bolt looseness. However, because the stress wave signal obtained using the piezoelectric active sensing method is complicated and irregular, it is particularly difficult to obtain satisfactory results by directly training the original signal through a 1DCNN. Therefore, in order to improve monitoring performance, the method presented in this article still requires extraction of bolt looseness features in advance, which is relatively time-consuming.
In addition, the reason why the multichannel active sensing method performs better than the dual-channel and single-channel scenarios can be summarized as follows. Multichannel active sensing can monitor the bolt looseness in multiple different locations and gain comprehensive information about the condition of the bolted connection. Moreover, the CBAM is a lightweight and efficient attention mechanism. The CBAM consists of both channel attention and spatial attention mechanisms. The attention mechanism is mainly used to adjust the weights (i.e.,
Conclusion and Future Work
This study proposed a multichannel monitoring method that integrates piezoelectric active sensing with deep learning for the quantitative monitoring of the bolt looseness. Features extracted from the stress waves from each channel include signal energy (time domain), the maximum value of the average periodogram (frequency domain), and three-layer wavelet packet decomposition energy (time frequency). A baseline 1DCNN model and an improved model (i.e., the CBAMCNN) are employed to recognize bolt looseness states (i.e., torque levels). The experimental results show that the combination of the convolutional neural network and multichannel active sensing can achieve quantitative assessment of the bolt connection status and performs better than single-channel and dual-channel scenarios. Moreover, the baseline model recognition accuracy improved after employing the spatial channel attention mechanism. The main contributions of this article are as follows: 1) the method is the first attempt to combine piezoelectric active sensing and convolutional neural networks to monitor bolt looseness quantitatively; 2) multichannel monitoring, which utilizes three sensors, characterizes bolt looseness from different perspectives and performs better than the single-channel and the dual-channel scenarios; and 3) the CBAM improved the model, and its excellent performance is verified by a laboratory-scale experiment.
The method proposed in this article is powerful for monitoring single-bolt looseness. However, the mechanism for monitoring the looseness of multiple bolts is more complicated. In future research, the authors would like to adopt the multi-bolted steel plate to carry out corresponding research and look for better ways to improve recognition accuracy. In view of the problem that the training data are not easy to obtain in actual engineering, the method of transfer learning can be employed to improve this problem, which can make the model adapt to the actual situation after the model is trained on the data obtained in the laboratory. Of course, this is only a feasible research idea, and a large number of experimental studies are needed to promote practical engineering applications. Otherwise, numerical simulation of stress wave propagation and the influence of the boundary conditions on the accuracy of looseness recognition will be further explored in the future.
Data Availability Statement
The original contributions presented in the study are included in the article/Supplementary Material; further inquiries can be directed to the corresponding authors.
Author Contributions
YC and JJ developed the original idea. YC and JJ designed the experiments. YC, JJ, and QF. conducted the experiments. YC and XQ analyzed the data. YC and JJ wrote the original draft. QF and XQ made critical revision to the manuscript.
Funding
This research was financially supported by the Science for Earthquake Resilience of China Earthquake Administration (Grant no. XH19043Y and XH20040YSX).
Conflict of Interest
Authors JJ and QF were employed by the company Wuhan Institute of Earthquake Engineering Co., Ltd.
The remaining authors declare that the research was conducted in the absence of any commercial or financial relationships that could be construed as a potential conflict of interest.
References
Amerini, F., Barbieri, E., Meo, M., and Polimeno, U. (2010). Detecting Loosening/tightening of Clamped Structures Using Nonlinear Vibration Techniques. Smart Mater. Struct. 19, 085013. doi:10.1088/0964-1726/19/8/085013
Avci, O., Abdeljaber, O., Kiranyaz, S., and Inman, D. (2017). Structural Damage Detection in Real Time: Implementation of 1D Convolutional Neural Networks for SHM Applications. Struct. Health Monit. Damage Detect. 7, 49–54. doi:10.1007/978-3-319-54109-9_6
Ban, M.-Y., Tian, W.-D., and Zhao, Z.-Q. (2020). “Real-time Object Detection Based on Convolutional Block Attention Module,” in International Conference on Intelligent Computing, Springer, 41–50. doi:10.1007/978-3-030-60796-8_4
Bartlett, M. S. (1950). Periodogram Analysis and Continuous Spectra. Biometrika 37, 1–16. doi:10.2307/2332141
Fraser-Thomas, J., Côté, J., and Deakin, J. (2008). Understanding Dropout and Prolonged Engagement in Adolescent Competitive Sport. Psychol. Sport Exerc. 9, 645–662. doi:10.1016/j.psychsport.2007.08.003
Goodfellow, I., Bengio, Y., Courville, A., and Bengio, Y. (2016). Deep Learning. Cambridge: The MIT Press, 105–115.
Grus, J. (2019). Data Science from Scratch: First Principles with python. Sebastopol, CA: O'Reilly Media.
Guarino, J., and Hamilton, R. (2017). Detection of Structural Bolt Detorquing Using Direct Stethoscope Measurement. Proc. Meetings Acoust. 30, 065003. doi:10.1121/2.0000547
Hei, C., Luo, M., Gong, P., and Song, G. (2020). Quantitative Evaluation of Bolt Connection Using a Single Piezoceramic Transducer and Ultrasonic Coda Wave Energy with the Consideration of the Piezoceramic Aging Effect. Smart Mater. Struct. 29, 027001. doi:10.1088/1361-665x/ab6076
Hu, C., Yang, B., Yan, J., Xiang, Y., Zhou, S., and Xuan, F.-Z. (2020). Damage Localization in Pressure Vessel by Guided Waves Based on Convolution Neural Network Approach. J. Press. Vessel Technol. 142 (6), 061601. doi:10.1115/1.4047213
Hu, Y.-J., Guo, W.-G., Jiang, C., Zhou, Y.-L., and Zhu, W. (2018). Looseness Localization for Bolted Joints Using Bayesian Operational Modal Analysis and Modal Strain Energy. Adv. Mech. Eng. 10, 168781401880869. doi:10.1177/1687814018808698
Huang, Z., Xu, W., and Yu, K. (2015). Bidirectional LSTM-CRF Models for Sequence Tagging. Sebastopol, CA: arXiv preprint arXiv:1508.01991.
Huo, L., Chen, D., Kong, Q., Li, H., and Song, G. (2017). Smart Washer-A Piezoceramic-Based Transducer to Monitor Looseness of Bolted Connection. Smart Mater. Struct. 26, 025033. doi:10.1088/1361-665x/26/2/025033
Huo, L., Chen, D., Liang, Y., Li, H., Feng, X., and Song, G. (2017). Impedance Based Bolt Pre-load Monitoring Using Piezoceramic Smart Washer. Smart Mater. Struct. 26, 057004. doi:10.1088/1361-665x/aa6a8e
Lacayo, R. M., and Allen, M. S. (2019). Updating Structural Models Containing Nonlinear Iwan Joints Using Quasi-Static Modal Analysis. Mech. Syst. Signal Process. 118, 133–157. doi:10.1016/j.ymssp.2018.08.034
Lacayo, R., Pesaresi, L., Groß, J., Fochler, D., Armand, J., Salles, L., et al. (2019). Nonlinear Modeling of Structures with Bolted Joints: a Comparison of Two Approaches Based on a Time-Domain and Frequency-Domain Solver. Mech. Syst. Signal Process. 114, 413–438. doi:10.1016/j.ymssp.2018.05.033
Lei, X., Sun, L., and Xia, Y. (2020). Lost Data Reconstruction for Structural Health Monitoring Using Deep Convolutional Generative Adversarial Networks. Struct. Health Monit. 1475921720959226, 147592172095922. doi:10.1177/1475921720959226
Li, Q., and Jing, X. (2017). A Second-Order Output Spectrum Approach for Fault Detection of Bolt Loosening in a Satellite-like Structure with a Sensor Chain. Nonlinear Dyn. 89, 587–606. doi:10.1007/s11071-017-3473-6
Li, Q., and Jing, X. (2020). Fault Diagnosis of Bolt Loosening in Structures with a Novel Second-Order Output Spectrum-Based Method. Struct. Health Monit. 19, 123–141. doi:10.1177/1475921719836379
Li, Q., Jing, X., and Guo, Y. (2019). The Second-Order Output Spectrum-Based Method for Fault Localization in Ring Type Structures. Nonlinear Dyn. 98, 1935–1955. doi:10.1007/s11071-019-05299-6
Lim, H. J., and Sohn, H. (2020). Online Stress Monitoring Technique Based on Lamb-Wave Measurements and a Convolutional Neural Network under Static and Dynamic Loadings. Exp. Mech. 60, 171–179. doi:10.1007/s11340-019-00546-8
Liu, H., Mi, X., and Li, Y. (2018). Comparison of Two New Intelligent Wind Speed Forecasting Approaches Based on Wavelet Packet Decomposition, Complete Ensemble Empirical Mode Decomposition with Adaptive Noise and Artificial Neural Networks. Energ. Convers. Manag. 155, 188–200. doi:10.1016/j.enconman.2017.10.085
Liu, M., Huang, X., Yu, J., Wang, T., and Mallya, A. (2020). Generative Adversarial Networks for Image and Video Synthesis: Algorithms and Applications. Sebastopol, CA: arXiv preprint arXiv:2008.02793. doi:10.1145/3447450.3447484
Luo, H., Huang, M., and Zhou, Z. (2019). A Dual-Tree Complex Wavelet Enhanced Convolutional LSTM Neural Network for Structural Health Monitoring of Automotive Suspension. Measurement 137, 14–27. doi:10.1016/j.measurement.2019.0.1.038
Meyer, J. J., and Adams, D. E. (2015). Theoretical and Experimental Evidence for Using Impact Modulation to Assess Bolted Joints. Nonlinear Dyn. 81, 103–117. doi:10.1007/s11071-015-1976-6
Ritdumrongkul, S., Abe, M., Fujino, Y., and Miyashita, T. (2003). Quantitative Health Monitoring of Bolted Joints Using a Piezoceramic Actuator–Sensor. Smart Mater. structures 13, 20. doi:10.1088/0964-1726/13/1/003
Tao, W., Shaopeng, L., Junhua, S., and Yourong, L. (2016). Health Monitoring of Bolted Joints Using the Time Reversal Method and Piezoelectric Transducers. Smart Mater. Structures 25, 025010. doi:10.1088/0964-1726/25/2/025010
Teotrakool, K., Devaney, M. J., and Eren, L. (2009). Adjustable-speed Drive Bearing-Fault Detection via Wavelet Packet Decomposition. IEEE Trans. Instrumentation Meas. 58, 2747–2754. doi:10.1109/TIM.2009.2016292
Toliyat, H. A., Abbaszadeh, K., Rahimian, M. M., and Olson, L. E. (2003). Rail Defect Diagnosis Using Wavelet Packet Decomposition. IEEE Trans. Industry Appl. 39, 1454–1461. doi:10.1121/2.0000547
Wang, B., Huo, L., Chen, D., Li, W., and Song, G. (2017). Impedance-based Pre-stress Monitoring of Rock Bolts Using a Piezoceramic-Based Smart Washer—A Feasibility Study. Sensors 17, 250. doi:10.3390/s17020250
Wang, F., Chen, Z., and Song, G. (2020). Monitoring of Multi-Bolt Connection Looseness Using Entropy-Based Active Sensing and Genetic Algorithm-Based Least Square Support Vector Machine. Mech. Syst. Signal Process. 136, 106507. doi:10.1016/j.ymssp.2019.106507
Wang, F., Chen, Z., and Song, G. (2021). Smart Crawfish: A Concept of Underwater Multi-Bolt Looseness Identification Using Entropy-Enhanced Active Sensing and Ensemble Learning. Mech. Syst. Signal Process. 149, 107186. doi:10.1016/j.ymssp.2020.107186
Wang, F., Ho, S. C. M., and Song, G. (2019). Modeling and Analysis of an Impact- Acoustic Method for Bolt Looseness Identification. Mech. Syst. Signal Process. 133, 106249. doi:10.1016/j.ymssp.2019.106249
Wang, F., Mobiny, A., Van Nguyen, H., and Song, G. (2020). If Structure Can Exclaim: a Novel Robotic-Assisted Percussion Method for Spatial Bolt-ball Joint Looseness Detection. Struct. Health Monit. 1475921720923147. doi:10.1177/1475921720923147
Wang, F., and Song, G. (2020). Bolt-looseness Detection by a New Percussion-Based Method Using Multifractal Analysis and Gradient Boosting Decision Tree. Struct. Health Monit. 19, 2023–2032. doi:10.1177/1475921720912780
Xu, J., Dong, J., Li, H., Zhang, C., and Ho, S. C. (2019). Looseness Monitoring of Bolted Spherical Joint Connection Using Electro-Mechanical Impedance Technique and BP Neural Networks. Sensors 19, 1906. doi:10.3390/s19081906
Xu, J., Wang, C., Li, H., Zhang, C., Hao, J., and Fan, S. (2018). Health Monitoring of Bolted Spherical Joint Connection Based on Active Sensing Technique Using Piezoceramic Transducers. Sensors 18, 1727. doi:10.3390/s18061727
Xu, L., Yuan, S., Chen, J., and Ren, Y. (2019). Guided Wave-Convolutional Neural Network Based Fatigue Crack Diagnosis of Aircraft Structures. Sensors 19, 3567. doi:10.3390/s19163567
You, R., Ren, L., and Song, G. (2020). A Novel Comparative Study of European, Chinese and American Codes on Bolt Tightening Sequence Using Smart Bolts. Int. J. Steel Structures 20, 910–918. doi:10.1007/s13296-020-00331-7
Zhang, Y., Zhang, X., Chen, J., and Yang, J. (2017). Electro-mechanical Impedance Based Position Identification of Bolt Loosening Using LibSVM. Intell. Automation Soft Comput. 24 (1), 1–7. doi:10.1080/10798587.2016.1267245
Zhang, Z., Liu, M., Liao, Y., Su, Z., and Xiao, Y. (2018). Contact Acoustic Nonlinearity (CAN)-based Continuous Monitoring of Bolt Loosening: Hybrid Use of High-Order Harmonics and Spectral Sidebands. Mech. Syst. Signal Process. 103, 280–294. doi:10.1016/j.ymssp.2017.10.009
Zhang, Z., Liu, M., Su, Z., and Xiao, Y. (2016). Quantitative Evaluation of Residual Torque of a Loose Bolt Based on Wave Energy Dissipation and Vibro-Acoustic Modulation: A Comparative Study. J. Sound Vibration 383, 156–170. doi:10.1016/j.jsv.2016.07.001
Zhao, N., Huo, L., and Song, G. (2020). A Nonlinear Ultrasonic Method for Real-Time Bolt Looseness Monitoring Using PZT Transducer–Enabled Vibro-Acoustic Modulation. J. Intell. Mater. Syst. Structures 31, 364–376. doi:10.1177/1045389X19891534
Keywords: bolt looseness, quantitative monitoring, multichannel active sensing method, convolutional neural network, convolutional block attention module
Citation: Chen Y, Jiang J, Qin X and Feng Q (2021) Quantitative Monitoring of Bolt Looseness Using Multichannel Piezoelectric Active Sensing and CBAM-Based Convolutional Neural Network. Front. Mater. 8:677642. doi: 10.3389/fmats.2021.677642
Received: 08 March 2021; Accepted: 09 June 2021;
Published: 29 June 2021.
Edited by:
Liang Ren, Dalian University of Technology, ChinaCopyright © 2021 Chen, Jiang, Qin and Feng. This is an open-access article distributed under the terms of the Creative Commons Attribution License (CC BY). The use, distribution or reproduction in other forums is permitted, provided the original author(s) and the copyright owner(s) are credited and that the original publication in this journal is cited, in accordance with accepted academic practice. No use, distribution or reproduction is permitted which does not comply with these terms.
*Correspondence: Jian Jiang, bHRheGpqQGZveG1haWwuY29t; Qian Feng, cWZlbmd3aEBmb3htYWlsLmNvbQ==