 Hua-Ping Wang
 Si-Yuan Feng1
 Xiang-Shu Gong
 Ping Xiang
 Yu Fang
- 1School of Civil Engineering and Mechanics, Lanzhou University, Lanzhou, China
- 2Key Lab of Mechanics on Disaster and Environment in Western China (Lanzhou University), Ministry of Education, Lanzhou, China
- 3School of Civil Engineering, Central South University, Changsha, China
For the high strength, corrosion resistance, and good stability, carbon fiber–reinforced polymer (CFRP) composites have been made into pipes to transfer gasses and oils in subsea environment. Structural performance of CFRP composite pipes is particularly important to sustain the regular operation of the delivery system. To obtain the in-field behavior of the CFRP composite pipes, quasi-distributed optical fiber sensing techniques are developed based on the multiple configuration of fiber Bragg grating (FBG) sensing elements. Theoretical investigation on the dynamic response of the pipes is performed. Experiments on cantilever CFRP pipes with surface-attached FBGs in series and packaged FBG sensors have been conducted to check the feasibility and effectiveness of the proposed sensing technique. Results validate the good measurement performance of the proposed sensors and the accuracy of the vibration analysis. The study can be adopted to instruct the establishment of the structural health monitoring system of CFRP composite pipes and assess the safety operation state of the pipe systems.
Introduction
Pipe transportation has become the main channel for oil and gas, due to the advantages of high efficiency, low energy consumption, and reasonable cost. Submarine pipes with extremely high fabrication cost are prone to local buckling, cracking, perforation, and fatigue fracture damages induced by seawater corrosion, sea sand erosion, waves, and other multimedia cycle coupling action during the long-term operation process (Zhang et al., 2015; Ferras et al., 2017; Wu et al., 2020). The cumulative or sudden damage induced pipe defect or fracture can result in huge gas or oil leakage, which can inspire serious explosion and environmental pollution. Therefore, it is essential to develop effective, real-time, and long-term online monitoring technology to obtain the service status of submarine pipeline structures, conduct timely online damage diagnosis, and instruct the rapid rehabilitation and long-term safe operation and maintenance (Drumond et al., 2018; Psyrras and Sextos, 2018).
Submarine pipelines have always been under the action of waves and currents. When the fluid flows bypass both sides of the suspended pipe, the change of pressure difference makes the boundary layers separate, and then the wake vortex falls off, leading to vibration of the pipe with certain frequency. When the excitation frequency that makes the vortex fall off is equal to or approaches the inherent frequency of the submarine pipe, the vibration locking phenomenon (resonance) occurs, and the amplitude of the pipe increases dramatically, which can induce fatigue failure of the pipe. Therefore, it is particularly important to explore the dynamic characteristics, dynamic failure mode, and dynamic damage monitoring methods of submarine pipelines, so as to develop preventive control measures for preventing the fatigue fracture damage inspired by vortex-induced vibration (Datta and Sarkar, 2016).
Currently, considerable attempts have contributed to analyzing the dynamic characteristics of pipe structures. Kershenbaum et al. (Kershenbaum et al., 2000) explored the seismic performance of pipelines with snake shape and restrained sections. Choi (Choi, 2001) established the dynamic model of offshore pipelines to discuss the natural frequencies and sensitive parameters of the free spans, and provide improved design suggestions regarding the vortex-induced vibration and free span analysis. Kouretzis et al. (Kouretzis et al., 2007) theoretically studied the surface point-source blast-induced ground wave propagation with radial attenuation and spherical front in pipelines and the distribution of strain responses. Giannaros et al. (Giannaros et al., 2016) adopted finite element simulation for understanding the blast response of composite pipelines. Tian et al. (Tian et al., 2019) used the Euler–Bernoulli foundation beam model to analyze the dynamic response of pipelines under impact load based on Fourier series. Talemi et al. (Talemi et al., 2019) conducted the 3D dynamic ductile fracture of steel pipeline based on coupled interaction simulation. Deng et al. (Deng et al., 2019) explored the dynamic scaling mechanism of glass fiber–reinforced plastics pipelines by experimental and numerical studies. Manolis et al. (Manolis et al., 2020) conducted the dynamic response of buried pipelines undergoing both axial and flexural vibrations based on Newmark assumption. Wang et al. (Wang et al., 2020) performed the experimental testing and numerical investigation on the blast-induced ground vibration of gas pipelines.
The mentioned analysis on pipes under various vibration actions based on the simplified theoretical solutions, finite element simulation (Zhu et al., 2020; Qu et al., 2021), and experimental testing can declare some dynamic features of submarine pipes. However, it is generally based on the simplified models and has difference with the practical pipe structures. Therefore, it is important to develop the dynamic testing technique for obtaining the vibration response of submarine pipeline, which can provide compensative and feasible supports for the vibration design, damage identification, and performance rehabilitation of submarine pipe structures.
Some scholars used piezoceramic transducers to detect the defect of pipelines (Datta and Sarkar, 2016; Tian et al., 2019). However, it is based on electrical input, which may lead to the blast or fire of pipelines for oil and gas transportation. Due to the advantages of absolute measurement, anti-electromagnetic interference, high precision, multiplexing, and integration of sensing network over other sensors (Ansari, 2007; Wang et al., 2014; Wang et al., 2016; Wang et al., 2018a, Wang et al., 2018b; Wang et al., 2019a; Wang and Dai, 2019), optical fiber based sensors have thus been adopted to monitor the health condition and structural performance of pipe structures. For the excellent characteristics of low weight, corrosion resistance, and high strength (Dai et al., 2013; Gao et al., 2015; Wang et al., 2019b), carbon fiber–reinforced polymer (CFRP) composite pipes have been considered, and the exploration on the replacement of steel pipes still requires further investigation.
In view of this, the vibration characteristics of the CFRP composite pipe structures have been analyzed, and the displacements and strain responses of the pipe under bending vibration have been described from the perspective of continuum vibration differential equations. Experimental investigations on the vibration response characteristics of the CFRP composite pipes have been performed based on quasi-distributed optical fiber sensing technology. Furthermore, the effectiveness and applicability of the testing method have been demonstrated by the comparative analysis on calculated and measured dynamic strain responses.
Vibration Analysis on CFRP Composite Pipe
The aspect ratio of the CFRP pipe is larger than 50, which has the characteristics of the beam. Therefore, the infinite degree of freedom beam vibration model with uniform mass distribution is used to study the vibration of the CFRP pipe. The research objective is referred to submarine pipelines for transporting oil/gas, which belongs to slender beam and is dominated by low-order natural vibration. Therefore, the Bernoulli–Euler beam model can be used for analysis. The coordinates of the CFRP pipe follow Figure 1A, and an infinitesimal element is abstracted from the pipe, with force distribution displayed in Figure 1B. To simplify the theoretical derivation, the hollow-pipe cross section is equivalent to a “good” arbitrary cross section during the analysis (Dai et al., 2013; Wang et al., 2019b).
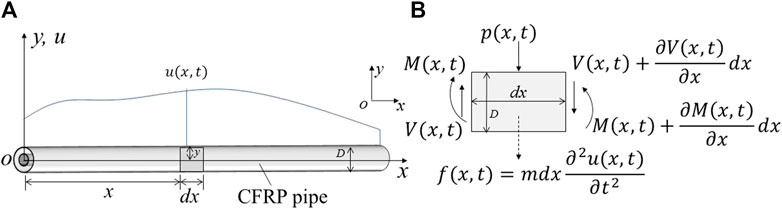
FIGURE 1. Bernoulli–Euler beam model: (A) coordinates of the CFRP pipe; (B) force state of the infinitesimal element.
The dynamic equilibrium condition in y direction gives
Ignoring the second-order small quantity, the balance condition of the rotation of the infinitesimal element around the centroid can be obtained.
According to the mechanics of materials,
Substituting Eqs 2, 3 into Eq. 1, the partial differential control equation is given by
For free vibration, the external excitation force
then
Substituting Eq. 6 into Eq. 4, it derives
The above formula can be rewritten as
The premise that Eq. 8 is effective for all the
and then Eq. 9b can be rewritten as
where
Considering the cantilever constraints, at the fixed end (
At the free end (
If both
To solve
and then the natural vibration mode of each order corresponding to
where
Using the mode superposition method to calculate the vibration of the beam, the vibration response of the beam can be expressed as
Substituting it into Eq. 4, and using the boundary conditions and the orthogonality of natural vibration modes, the principal coordinate differential equation can be obtained
where
and then Eq. 18 can be rewritten as
Introducing the boundary condition
Substituting
According to the bending theory of beams, the axial strain response caused by bending can be obtained
where
Given the theoretical analysis above, a related numerical calculation program has been compiled to calculate the displacement and strain response of the cantilever CFRP pipe under the action of a unit harmonic force with an excitation frequency of 10 Hz. Figures 2, 3 are corresponded to CFRP pipes with inner and outer diameters of 12–15 mm and 16–19 mm, respectively. It can be seen that the displacement of the CFRP pipe is largest at the free end (i.e., the loading point), and the displacement undergoes periodic vibration changes over time. The strain of the CFRP pipe reaches the maximum at the fixed end, which also undergoes periodic vibration changes over time. Under the same load, since the section modulus of pipe3 is larger than that of pipe2, the strain and displacement responses of pipe3 are smaller than those of pipe2. The above results are in accordance with the laws of mechanics, indicating the effectiveness of the above solution.
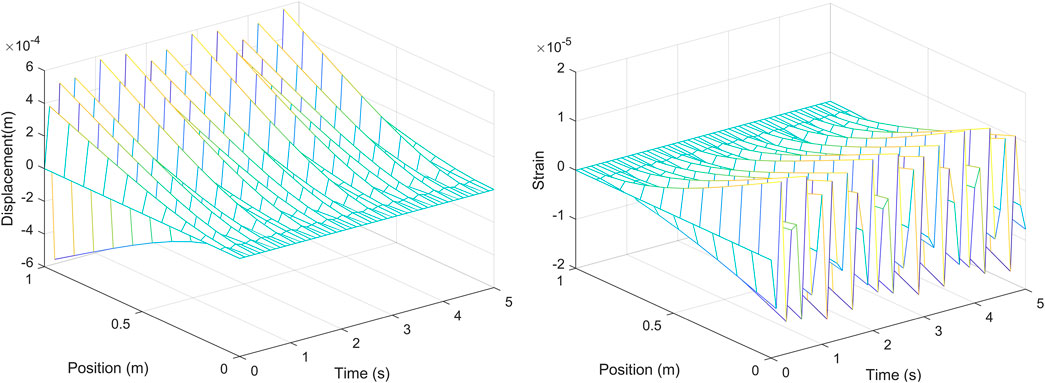
FIGURE 2. Space–time distribution of displacements and strains of pipe2.
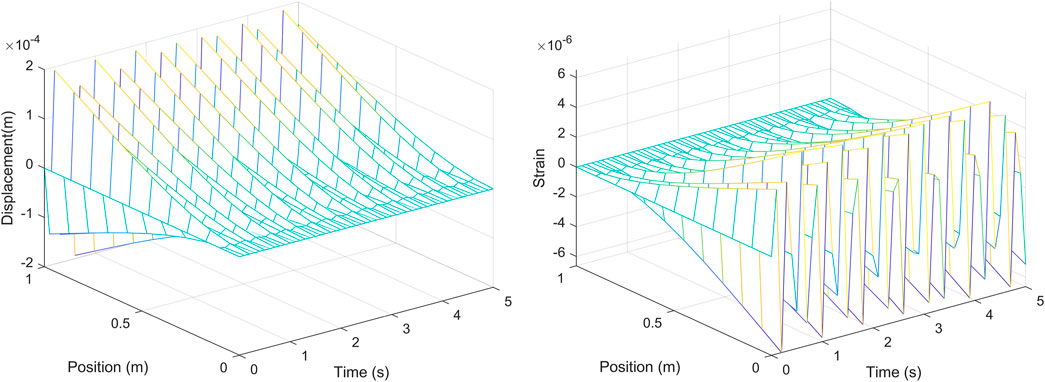
FIGURE 3. Space–time distribution of displacements and strains of pipe3.
Experimental Investigation
To verify the feasibility and effectiveness of the installed FBGs in series to measure the vibration response of the pipe structures, experiments on vibration testing of the CFRP tube have been carried out. Surface-attached FBGs in series have been designed to measure the distributed strains in the axial direction of the pipe. The Optical system 200 has been used to demodulate FBG signal information, and the sampling frequency is 100 Hz.
Testing Description
Two kinds of CFRP pipes have been used in the cantilever vibration experiments, as shown in Figures 4, 5. The relevant size information is as follows: the CFRP pipe with a length of 1 m, and with inner and outer diameters of 12 and 15 mm, respectively, is marked as pipe2; the CFRP pipe with a length of 1 m, and with inner and outer diameters of 16 and 19 mm, respectively, is marked as pipe3. Three FBGs in series have been arranged on pipe2: two series are composed of three FBGs, and the other one is composed of four FBGs. The related numbers are marked in Figure 4A. In addition, near the constraint end, an epoxy resin packaged FBG sensor has also been placed, marked as E-packaged FBG, which is mainly used to detect the influence of packaging measure on the vibration deformation measurement of FBGs. The similar information about the FBGs in series on pipe3 follows Figure 5A. Silicone rubber packaged FBG sensor has also been installed close to the vibration point.
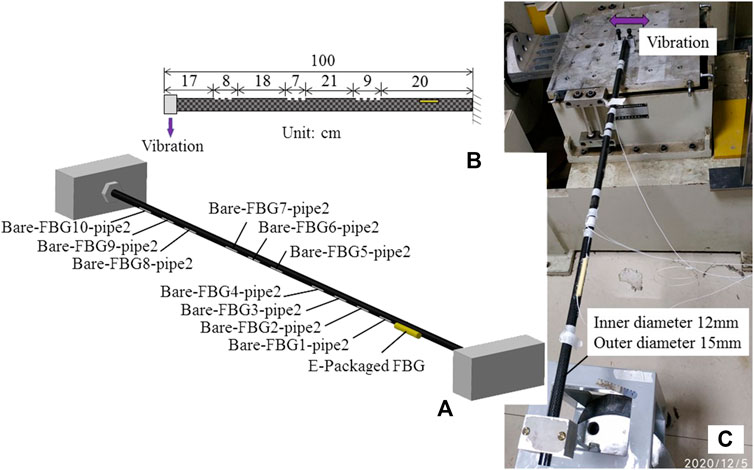
FIGURE 4. Setup of pipe2: (A) layout of surface-attached FBGs in series; (B) position of FBGs in series; (C) testing photo.
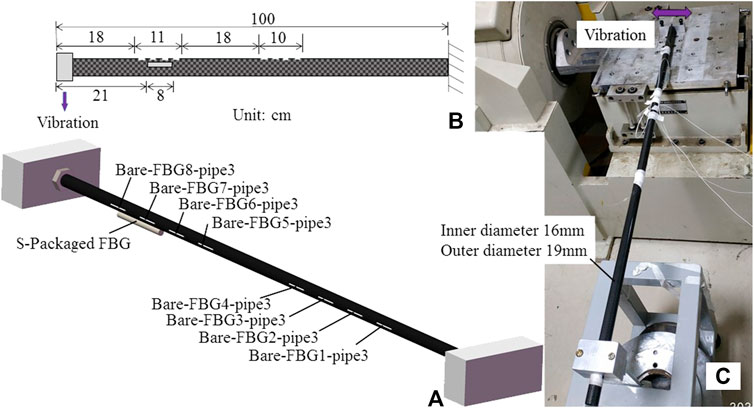
FIGURE 5. Setup of pipe3: (A) layout of surface-attached FBGs in series; (B) position of FBGs in series; (C) testing photo.
Discussion on the Results
In the vibration experiment, the effect of the frequency change on the response information of the CFRP pipes and the effectiveness of the FBG measurement has been checked by changing the excitation frequency. The excitation frequencies acting on pipe2 include 10, 20, 30, and 50 Hz. Three bare FBGs in series attached on pipe2 are separately connected to channel 4, channel 5, and channel 6 of the demodulation device, and the E-packaged FBG is connected to channel 8. A simple harmonic force with a frequency of 50 Hz has been applied to the end of pipe2, and the loading time lasts about 2,000 s. After the completion of the first load, the excitation frequency is adjusted to 30 Hz, and the loading time of pipe2 lasts about 4,000 s. After that, the third load has been carried out, and the excitation frequency is 20 Hz with the load time about 8,000 s. Finally, the fourth load with an excitation frequency of 10 Hz has been conducted, and the load time lasts about 2,000 s. An FBG from each channel has been taken out for analysis. The changes of FBG central wavelength increments with excitation frequencies are shown in Figures 6–9.
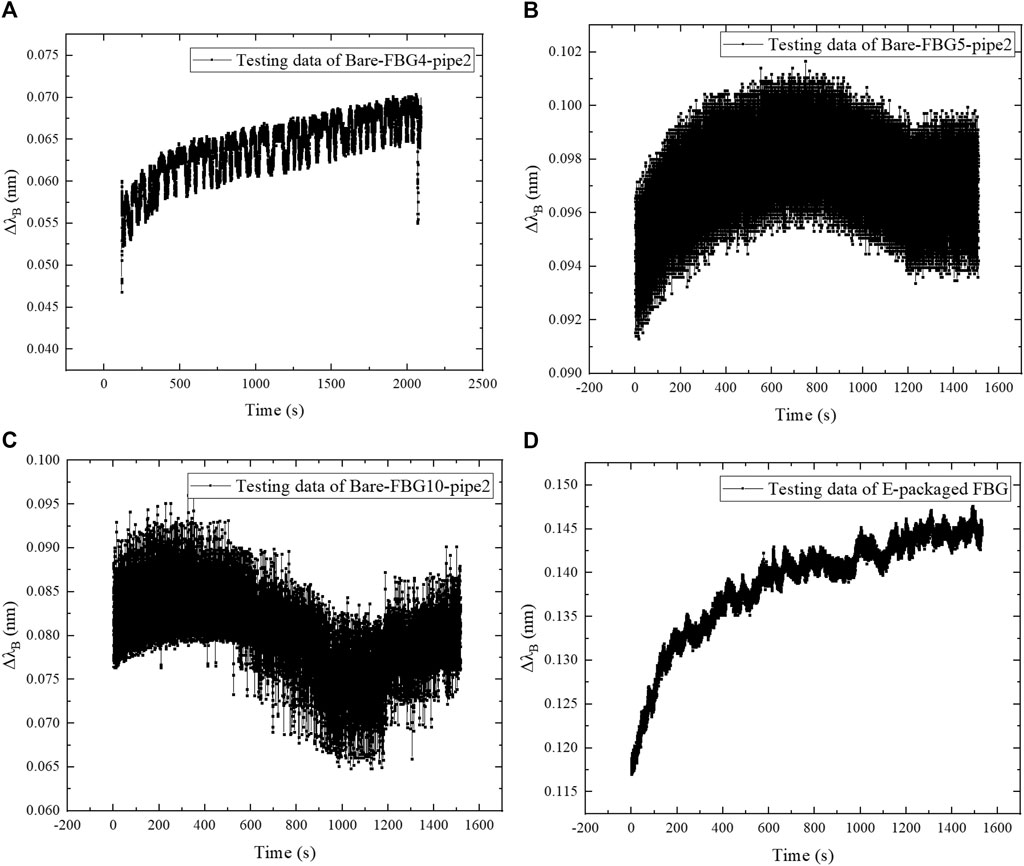
FIGURE 6. Relationship of central wavelength increment with loading time at 10 Hz: (A) Bare-FBG4-pipe2; (B) Bare-FBG5-pipe2; (C) Bare-FBG10-pipe2; (D) E-packaged FBG.
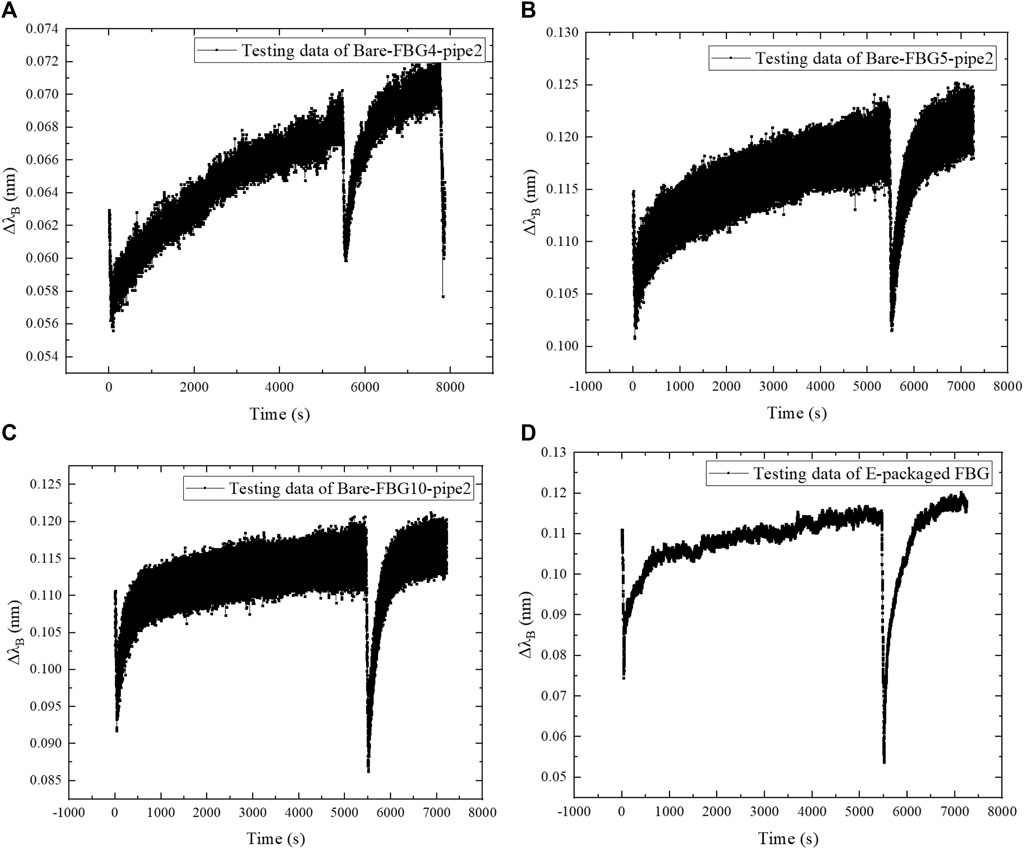
FIGURE 7. Relationship of central wavelength increment with loading time at 20 Hz: (A) Bare-FBG4-pipe2; (B) Bare-FBG5-pipe2; (C) Bare-FBG10-pipe2; (D) E-packaged FBG.
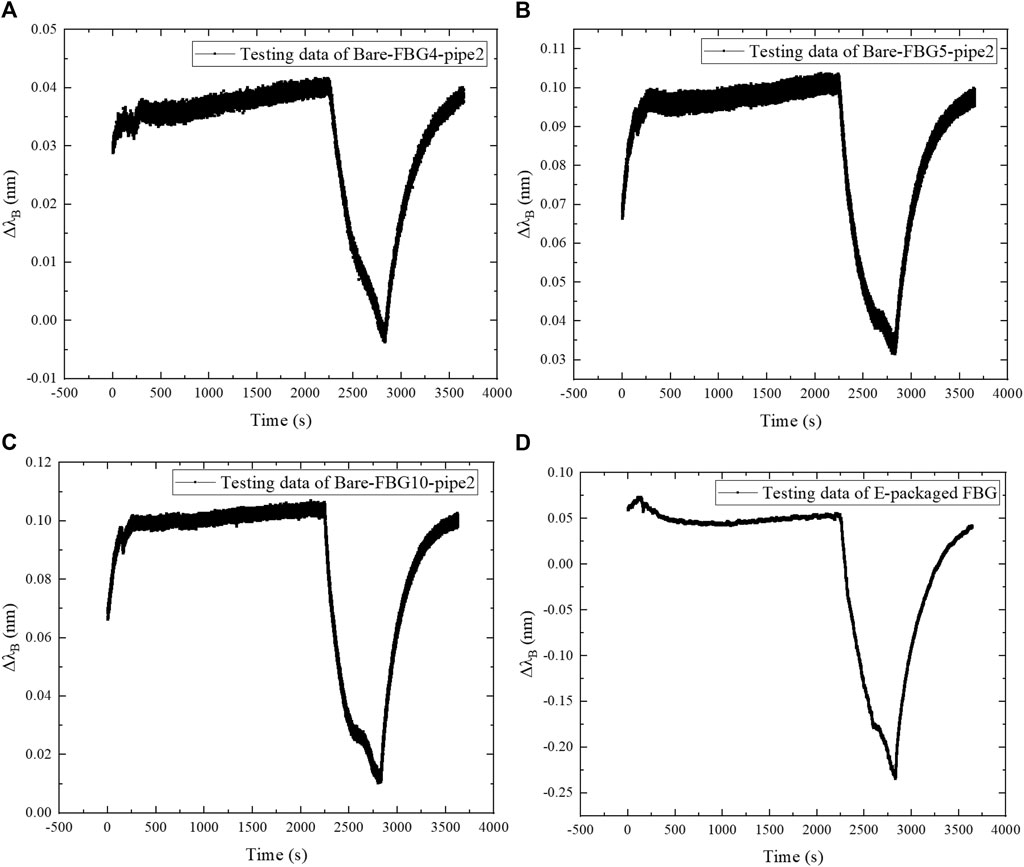
FIGURE 8. Relationship of central wavelength increment with loading time at 30 Hz: (A) Bare-FBG4-pipe2; (B) Bare-FBG5-pipe2; (C) Bare-FBG10-pipe2; (D) E-packaged FBG.
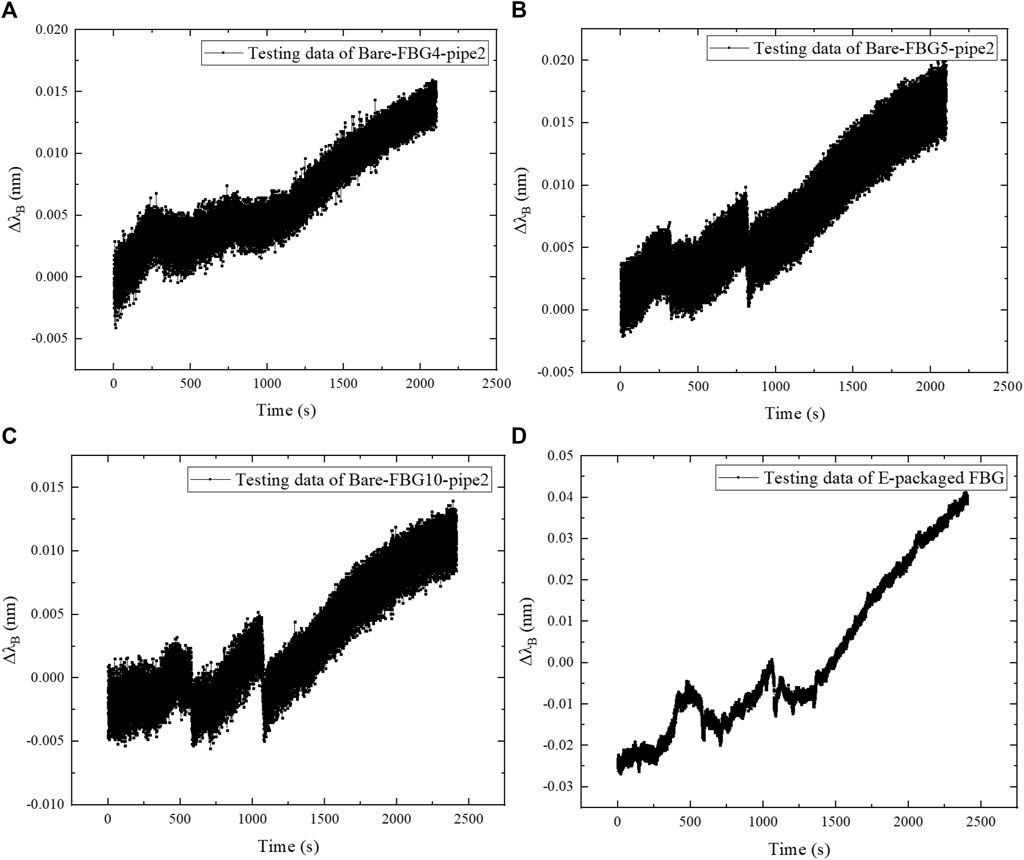
FIGURE 9. Relationship of central wavelength increment with loading time at 50 Hz: (A) Bare-FBG4-pipe2; (B) Bare-FBG5-pipe2; (C) Bare-FBG10-pipe2; (D) E-packaged FBG.
Figure 6 shows that the wavelength increment of the four FBG sensors has obvious consistency at the excitation frequency of 10 Hz, and they all increase with small fluctuations. That is, the internal deformation of the pipe accumulates after the action of applied simple harmonic excitation. Due to the disturbance in the loading process, the center wavelength of Bare-FBG5-pipe2 and Bare-FBG10-pipe2 has certain drop, but the overall trend is increasing. The change of FBG wavelength near the fixed end is significantly greater than that near the free end. It means that the vibration strain at the fixed end is larger than that at the free end, which validates the effective measurement. The strain fluctuation measured by E-packaged FBG near the fixed end is small, indicating that epoxy resin packaging measure improves the stability of FBG in measuring dynamic strain.
Figure 7 indicates that the variations of wavelength increments of the four FBG sensors at the excitation frequency of 20 Hz have high consistency. The wavelength of the FBG increases with fluctuation. That is, after harmonic excitation is applied, the pipe has a certain degree of deformation accumulation, and the degree is greater than that at 10 Hz. Due to the high sensitivity of FBG, the large “V” shape fluctuations in the figure can be attributed to the disturbance of the pipe. The overall deformation is relatively stable and has a certain rise. The vibration strain at the fixed end is greater than that at the free end, and the strain measured by the packaged FBG close to the fixed end has small fluctuation.
Figure 8 shows that the wavelength increments of the four FBG sensors under 30 Hz vibration have high consistency, and the wavelength of FBG fluctuates slightly (less than 0.005 nm). The small disturbance on the pipe produces the large “V” shape fluctuation, which has been detected by the installed FBG sensors. The overall deformation is relatively stable, and the strain at the fixed end is greater than that at the free end.
Figure 9 shows that the wavelength increments of the four FBG sensors under 50 Hz vibration have high consistency. The wavelengths of FBGs fluctuate and increase cumulatively with the loading time, and the increments are smaller than that at 30, 20, and 10 Hz. Compared with the bare FBGs, the strain fluctuation measured by E-packaged FBG is smaller, indicating that the treatment of epoxy resin package protection is beneficial to the dynamic measurement of FBG.
In the vibration test, the excitation frequencies of pipe3 were 20, 30, and 50 Hz. The two bare FBGs in series attached on pipe3 have been connected to channel 2 and channel 3 of the demodulation device, and the S-packaged FBG has been connected to channel 8. A simple harmonic force with frequency 50 Hz has first been applied to the end of pipe3, and the loading time lasts about 8,000 s. Second, adjusting the excitation frequency to 30 Hz, the load time on pipe3 lasts about 2,000 s. After that, the excitation frequency has changed to 20 Hz, and the loading time lasts about 1,000 s. An FBG from each channel was taken out for analysis. The FBG wavelength increment changes corresponding to the three excitation frequencies of 20, 30, and 50 Hz are shown in Figures 10–12.
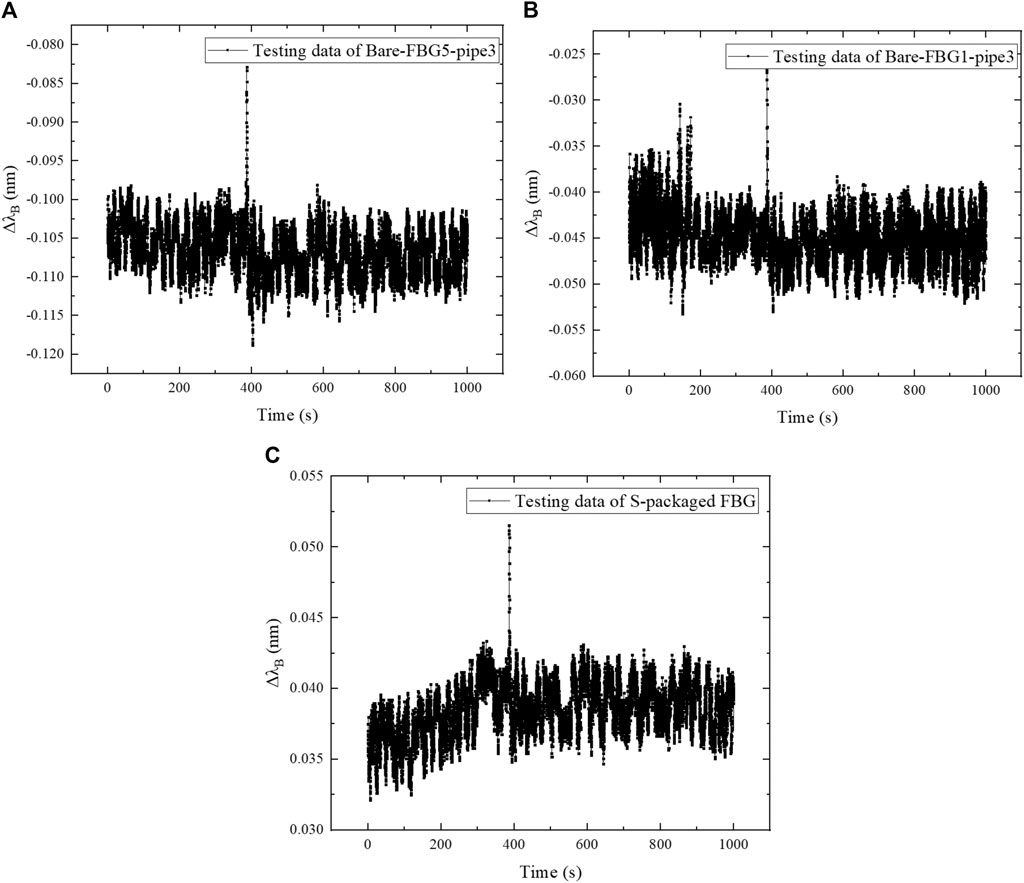
FIGURE 10. Relationship of central wavelength increment with loading time at 20 Hz: (A) Bare-FBG5-pipe3; (B) Bare-FBG1-pipe3; (C) S-packaged FBG.
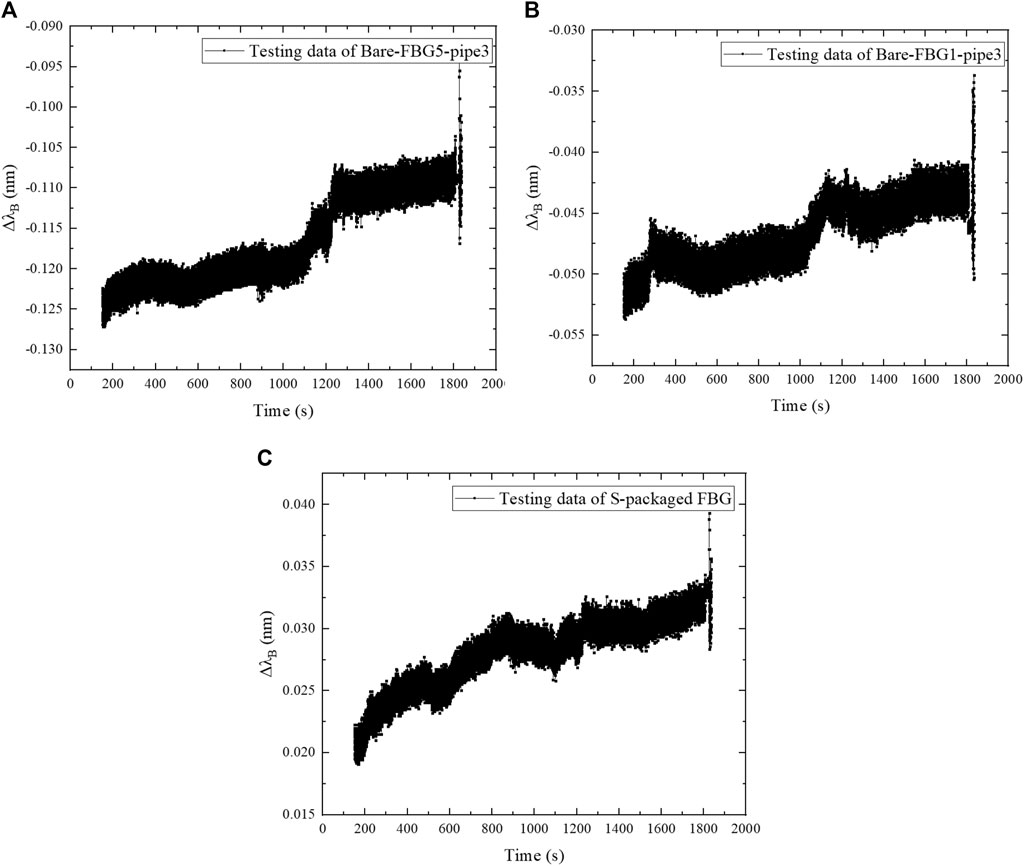
FIGURE 11. Relationship of central wavelength increment with loading time at 30 Hz: (A) Bare-FBG5-pipe3; (B) Bare-FBG1-pipe3; (C) S-packaged FBG.
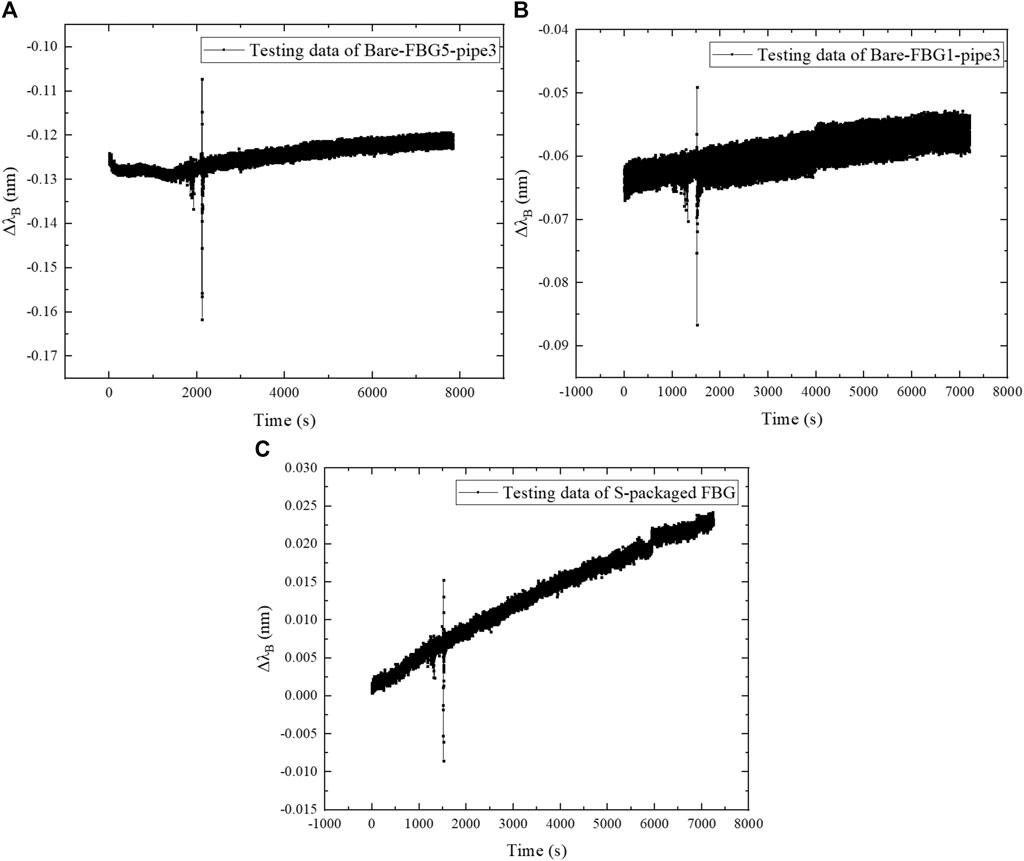
FIGURE 12. Relationship of central wavelength increment with loading time at 50 Hz: (A) Bare-FBG5-pipe3; (B) Bare-FBG1-pipe3; (C) S-packaged FBG.
Figure 10 shows that the wavelength increment of FBG sensors has very high consistency under the simple harmonic force with the excitation frequency 20 Hz, and the wavelength of FBG fluctuates steadily. The vibration strain at the fixed end is 0.15 μɛ greater than 0.1 μɛ at the free end. The measured strain of S-packaged FBG is smaller than that of bare FBG at the same position.
Figure 11 indicates that the wavelength increment of FBG sensors has very high consistency under the simple harmonic force with 30 Hz. The wavelength of the FBG fluctuates steadily, and the vibration strain at the fixed end is larger than that at the far end. The strain of FBG with silicone rubber encapsulation is smaller than that of the bare FBG in the same position, which declares the obvious desensitization effect induced by the flexible package protection.
Figure 12 shows that the wavelength increment of FBG sensors has very high consistency under the simple harmonic force with 50 Hz. The wavelength of FBG fluctuates smoothly and steadily. The vibration strain at the fixed end is greater than that at the far end. The strain measured by silicone rubber encapsulated FBG is smaller than that measured by bare FBG at the same position, with relatively large wavelength increase. It indicates that large deformation accumulation occurs in the flexible silicone rubber material during the energy transferring process at high vibration frequency.
Comparison and Discussions
According to the aforementioned analysis on forced vibration of the cantilever beam, when a simple harmonic excitation is applied at the end of the beam, the strain response of the beam section at any point
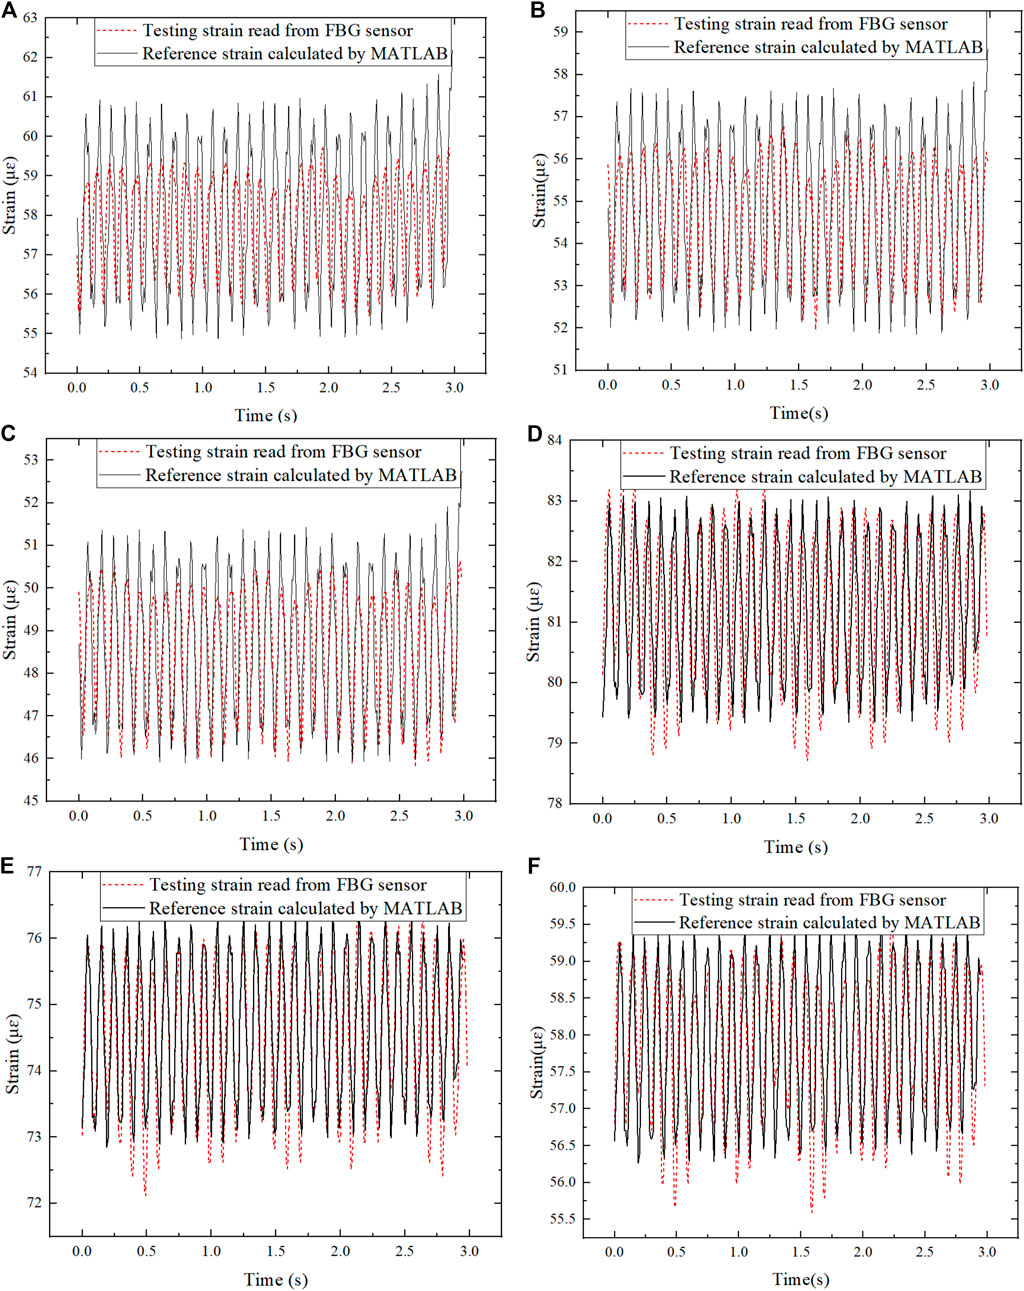
FIGURE 13. Comparison of calculated strain and measured strain in 10 Hz: (A) Bare-FBG2-pipe2; (B) Bare-FBG3-pipe2; (C) Bare-FBG4-pipe2; (D) Bare-FBG5-pipe2; (E) Bare-FBG6-pipe2; (F) Bare-FBG7-pipe2.
Figures 13A,B,C are separately corresponding to the strains measured by Bare-FBG2-pipe2, Bare-FBG3-pipe2, and Bare-FBG4-pipe2 attached on positions close to the fixed end of pipe2. It can be seen that the strain increases from the free end to the fixed end, and the average values of the amplitudes of the strains are 4.761, 4.15, and 3.907 μɛ in order, showing a very uniform strain variation. The vibration frequencies and amplitudes of the measured and calculated strain responses are very close, and the amplitude error is around 0.7 μɛ.
Figures 13D,E,F are separately corresponding to the strains measured by Bare-FBG5-pipe2, Bare-FBG6-pipe2, and Bare-FBG7-pipe2 attached on positions close to the middle of pipe2. As can be seen from the figures, the strain amplitude closer to the fixed end is greater, and the values with relatively uniform variation are 3.866, 4.374, and 4.683 μɛ.
Figures 14A,B,C are separately corresponding to the strains measured by Bare-FBG2-pipe3, Bare-FBG3-pipe3, and Bare-FBG4-pipe3 attached on positions close to the fixed end of pipe3. The vibration strains vary uniformly, with the average amplitudes separately equal to 10.475, 9.975, and 10.375 μɛ. It can be seen from the figure that the strains present uniform change, and the vibration frequency and amplitude are very close, with the amplitude error about 0.7 μɛ. The difference from the previous ones is that the experimentally measured vibration curve shows a fluctuating change, which has a certain deviation from the theoretical calculation value but with close strain amplitudes. This phenomenon may be caused by insufficient clamping of the fixed end and large vibration energy at the loading end.
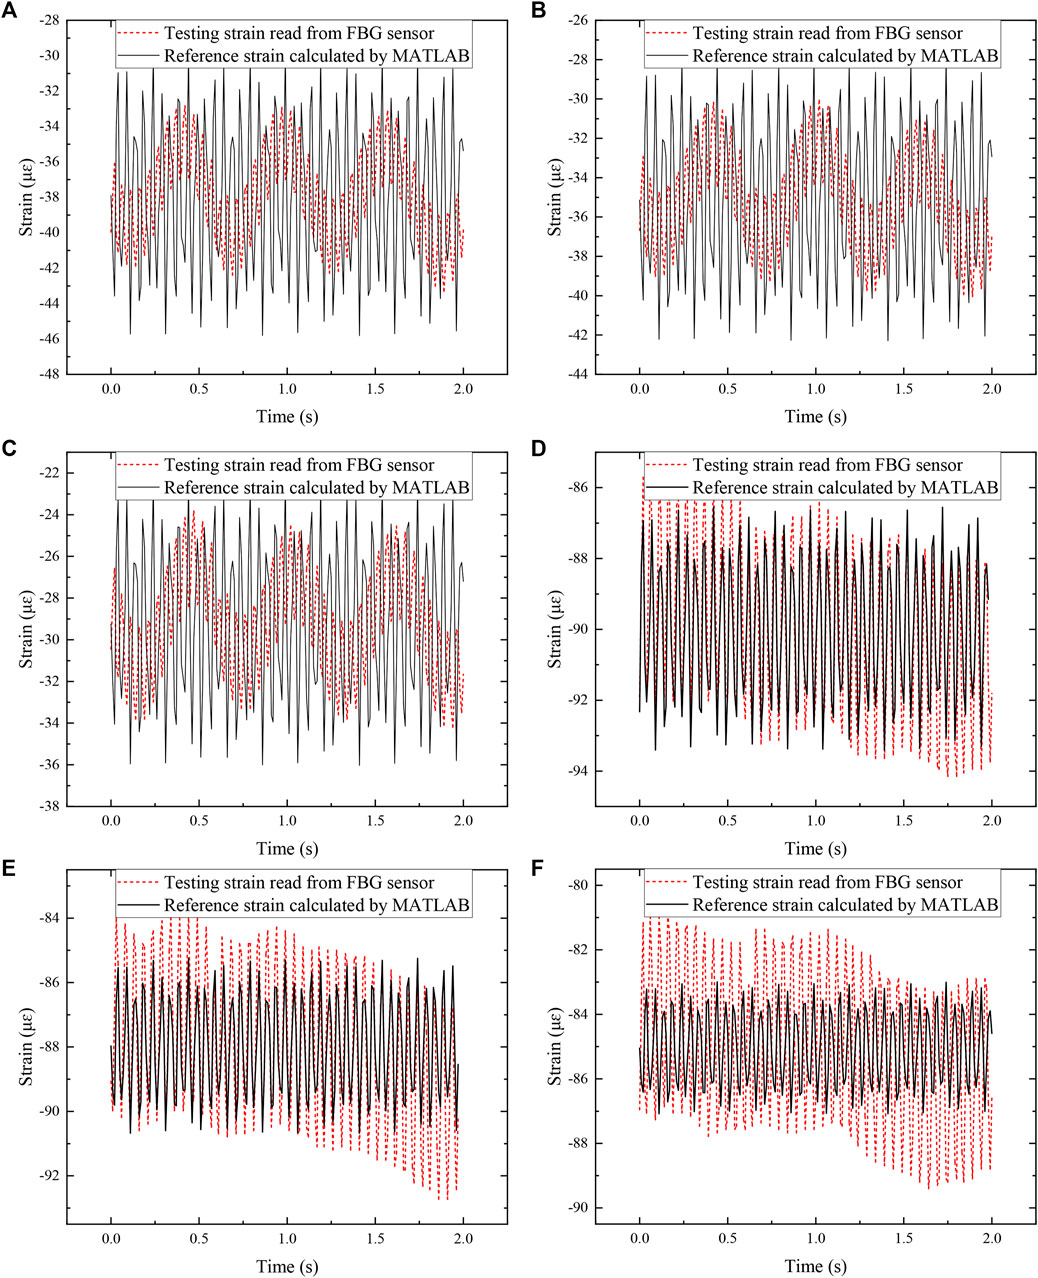
FIGURE 14. Comparison of theoretical strain and measured strain in 20 Hz: (A) Bare-FBG2-pipe3; (B) Bare-FBG3-pipe3; (C) Bare-FBG4-pipe3; (D) Bare-FBG5-pipe3; (E) Bare-FBG6-pipe3; (F) Bare-FBG7-pipe3.
Figures 14D,E,F are separately corresponding to the strains measured by Bare-FBG5-pipe3, Bare-FBG6-pipe3, and Bare-FBG7-pipe3 attached on positions close to the free end of pipe3. It can be seen from the figure that the strain amplitudes are relatively uniform, with respective values of 8.443, 9.05, and 8.542 μɛ, which may be due to the close distance between the FBG measuring points (the spacing is about 1 cm).
Statistical analysis on the data presented in Figures 13E, 14D has been displayed in Table 1. The output parameters indicate the high measurement accuracy and precision of the two sensing points. Similar analysis can also be extended to other points at different moments. It should be noted that for the degradation of the vibration device, the measurement accuracy and precision may be different. However, the good data indicate the effectiveness of the proposed technique.
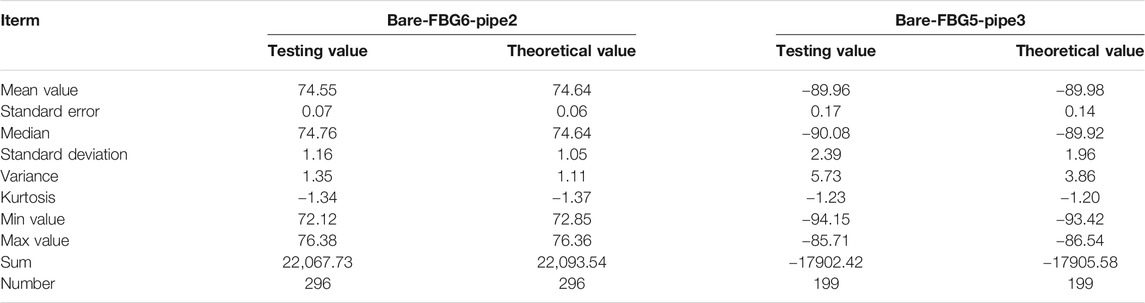
TABLE 1. Statistical analysis on the measured data.
Through comparison analysis, it can be seen that the error between the peak values of the theoretical vibration strain time–history curve and the FBG-measured curve is very small. That is, the peak value of the measured curve can much accurately reflect the vibration deformation response of the submarine pipes, and it is effective for adopting the proposed FBG sensors to measure the vibration strain. Based on the study, further work will be conducted to consider the random vibration-induced dynamic response of CFRP pipes based on the proposed FBGs in series and packaged FBG senosrs. Furthermore, it is feasible to describe the dynamic deformation state of submarine pipelines under complex working conditions according to the information measured by FBGs.
Based on the fundamental study, the proposed sensing techniques can be further used to characterize the dynamic response of CFRP pipes under unknown excitation. It can be a challenging issue to configure the load spectrum and assess the structural performance of the pipes based on the effective data measured by FBG sensors.
Conclusion
CFRP composite pipes have been considered as the replacement of steel pipes in the transportation of oil and gas under deep submarine environment. Thus, the vibration characteristics of the CFRP pipes have been investigated by theoretical analysis and experimental testing. Measurement on vibration responses of the CFRP pipes have been performed based on proposed quasi-distributed optical fiber sensing technology. The following conclusions can be drawn from the study:
1) The dynamic response of the pipe beam model is derived from the continuum vibration differential equations, and the comparison analysis validates the accuracy of this simplified theoretical model to describe the bending vibration-induced response.
2) The designed FBGs in series attached on the CFRP pipes have measured the dynamic strain responses with much high sensitivity and accuracy, which indicates the feasibility of the proposed monitoring technique for detecting the dynamic performance of composite pipes under arbitrary excitation.
3) The sensing performance of two packaged FBG sensors has also been checked, and the reasonable outputs indicate the effectiveness of the measurement. The results also indicate that the epoxy resin packaged FBG sensor installed on the CFRP composite pipes provides good measurement stability, which can be considered for the detection of submarine pipes under large dynamic deformation.
Data Availability Statement
The original contributions presented in the study are included in the article/Supplementary Material; further inquiries can be directed to the corresponding authors.
Author Contributions
H-PW and S-YF contributed to the main part of the manuscript. X-SG, Y-XG, and YF contributed to the experimental study. PX checked the manuscript.
Funding
This study was supported by the National Natural Science Foundation of China (Grant Nos. 51908263 and 11932008). The authors would also like to appreciate the funding support by the Fundamental Research Funds for the Central Universities (Grant No. lzujbky-2020-56), Provincial Projects (2020-0624-RCC-0013 and JK 2021-18), and Key Lab of Structures Dynamic Behavior and Control (Harbin Institute of Technology) of Ministry of Education (HITCE201901).
Conflict of Interest
The authors declare that the research was conducted in the absence of any commercial or financial relationships that could be construed as a potential conflict of interest.
Publisher’s Note
All claims expressed in this article are solely those of the authors and do not necessarily represent those of their affiliated organizations, or those of the publisher, the editors and the reviewers. Any product that may be evaluated in this article, or claim that may be made by its manufacturer, is not guaranteed or endorsed by the publisher.
Acknowledgments
Special thanks are due to Prof. Jinping Ou and Prof. Zhi Zhou of Dalian University of Technology, and Prof. Youhe Zhou and Prof. Ning Huang of Lanzhou University. The findings and opinions expressed in this article are only those of the authors and do not necessarily reflect the views of the sponsors.
References
Ansari, F. (2007). Practical Implementation of Optical Fiber Sensors in Civil Structural Health Monitoring. J. Intell. Mater. Syst. Structures 18 (8), 879–889. doi:10.1177/1045389x06075760
Choi, H. S. (2001). Free Spanning Analysis of Offshore Pipelines. Ocean Eng. 28 (10). doi:10.1016/s0029-8018(00)00071-8
Dai, J.-G., Gao, W. Y., and Teng, J. G. (2013). Bond-slip Model for Frp Laminates Externally Bonded to concrete at Elevated Temperature. J. Compos. Constr. 17 (2), 217–228. doi:10.1061/(asce)cc.1943-5614.0000337
Datta, S., and Sarkar, S. (2016). A Review on Different Pipeline Fault Detection Methods. J. Loss Prev. Process Industries 41, 97–106. doi:10.1016/j.jlp.2016.03.010
Deng, K. H., Lin, Y. H., Tang, W., and Liu, W. Y. (2019). Experimental and Numerical Study on Dynamic Scaling Mechanism of Glass Fiber Reinforced Plastics Pipeline. Compos. Structures 225, 111111.
Drumond, G. P., Pasqualino, I. P., Pinheiro, B. C., and Estefen, S. F. (2018). Pipelines, Risers and Umbilicals Failures: a Literature Review. Ocean Eng. 148, 412–425. doi:10.1016/j.oceaneng.2017.11.035
Ferras, D., Manso, P. A., Schleiss, A. J., and Covas, D. I. C. (2017). Fluid-structure Interaction in Straight Pipelines with Different Anchoring Conditions. J. Sound Vibration 394, 348–365. doi:10.1016/j.jsv.2017.01.047
Gao, W.-Y., Dai, J.-G., and Teng, J. G. (2015). Analysis of Mode II Debonding Behavior of Fiber-Reinforced Polymer-To-Substrate Bonded Joints Subjected to Combined thermal and Mechanical Loading. Eng. Fracture Mech. 136, 241–264. doi:10.1016/j.engfracmech.2015.02.002
Giannaros, E., Kotzakolios, T., and Kostopoulos, V. (2016). Blast Response of Composite Pipeline Structure Using Finite Element Techniques. J. Compos. Mater. 50 (25). doi:10.1177/0021998315618768
Kershenbaum, N. Y., Mebarkia, S. A., and Choi, H. S. (2000). Behavior of marine Pipelines under Seismic Faults. Ocean Eng. 27, 473–487. doi:10.1016/s0029-8018(98)00079-1
Kouretzis, G. P., Bouckovalas, G. D., and Gantes, C. J. (2007). Analytical Calculation of Blast-Induced Strains to Buried Pipelines. Int. J. Impact Eng. 34 (10), 1683–1704. doi:10.1016/j.ijimpeng.2006.08.008
Manolis, G. D., Stefanou, G., and Markou, A. A. (2020). Dynamic Response of Buried Pipelines in Randomly Structured Soil. Soil Dyn. Earthquake Eng. 128, 105873. doi:10.1016/j.soildyn.2019.105873
Psyrras, N. K., and Sextos, A. G. (2018). Safety of Buried Steel Natural Gas Pipelines under Earthquake-Induced Ground Shaking: a Review. Soil Dyn. Earthquake Eng. 106, 254–277. doi:10.1016/j.soildyn.2017.12.020
Qu, Y., Li, Z., Zhang, R., Qin, Y., and Zhang, D. (2021). Dynamic Performance Prediction and Influencing Factors Analysis of Buried Polyethylene Pipelines under Subsurface Localized Explosion. Int. J. Press. Vessels Piping 189, 104252. doi:10.1016/j.ijpvp.2020.104252
Talemi, R., Cooreman, S., Mahgerefteh, H., Martynov, S., and Brown, S. (2019). A Fully Coupled Fluid-Structure Interaction Simulation of Three-Dimensional Dynamic Ductile Fracture in a Steel Pipeline. Theor. Appl. Fracture Mech. 101, 224–235. doi:10.1016/j.tafmec.2019.02.005
Tian, J.-p., Zhang, J., Dong, F.-f., and Du, G.-f. (2019). Dynamic Response of Buried Pipeline Subject to Impact Loads Using Piezoceramic Transducers. Int. J. Press. Vessels Piping 177, 103984. doi:10.1016/j.ijpvp.2019.103984
Wang, H.-P., Ni, Y.-Q., Dai, J.-G., and Yuan, M.-D. (2019). Interfacial Debonding Detection of Strengthened Steel Structures by Using Smart CFRP-FBG Composites. Smart Mater. Struct. 28, 115001–115013. doi:10.1088/1361-665x/ab3add
Wang, H. P., and Dai, J.-G. (2019). Strain Transfer Analysis of Fiber Bragg Grating Sensor Assembled Composite Structures Subjected to thermal Loading. Composites B: Eng. 162, 303–313. doi:10.1016/j.compositesb.2018.11.013
Wang, H. P., Jiang, L. Z., and Xiang, P. (2018a). Improving the Durability of the Optical Fiber Sensor Based on Strain Transfer Analysis. Opt. Fiber Techn. 42, 97–104. doi:10.1016/j.yofte.2018.02.004
Wang, H. P., Jiang, L. Z., and Xiang, P. (2018b). Priority Design Parameters of Industrialized Optical Fiber Sensors in Civil Engineering. Opt. Laser Techn. 100, 119–128. doi:10.1016/j.optlastec.2017.09.035
Wang, H. P., Liu, W. Q., He, J. P., Xing, X., Cao, D., Gao, X., et al. (2014). Functionality Enhancement of Industrialized Optical Fiber Sensors and System Developed for Full-Scale Pavement Monitoring. Sensors 14 (5), 8829–8850. doi:10.3390/s140508829
Wang, H. P., Xiang, P., and Li, X. (2016). Theoretical Analysis on Strain Transfer Error of FBG Sensors Attached on Steel Structures Subjected to Fatigue Load. Strain 52 (6), 522–530. doi:10.1111/str.12195
Wang, H. P., Xiang, P., and Jiang, L. Z. (2019). Strain Transfer Theory of Industrialized Optical Fiber-Based Sensors in Civil Engineering: a Review on Measurement Accuracy, Design and Calibration. Sensors Actuators A: Phys. 285, 414–426. doi:10.1016/j.sna.2018.11.019
Wang, K., Liu, Z., Qian, X., and He, Y. (2020). Dynamic Characteristics and Damage Recognition of Blast-Induced Ground Vibration for Natural Gas Transmission Pipeline and its Integrated Systems. Mech. Syst. Signal Process. 136, 106472. doi:10.1016/j.ymssp.2019.106472
Wu, X., Niu, S. H., Li, C. J., and He, Y. F. (2020). Experimental Research of the Dynamic Behavior of the Natural Gas Suspension Pipeline Aerial Crossing during Pigging Process. J. Loss Prev. Process Industries 68, 104329. doi:10.1016/j.jlp.2020.104239
Zhang, H., Zhang, S., Liu, S., Zhu, X., and Tang, B. (2015). Chatter Vibration Phenomenon of Pipeline Inspection Gauges (PIGs) in Natural Gas Pipeline. J. Nat. Gas Sci. Eng. 27, 1129–1140. doi:10.1016/j.jngse.2015.09.054
Keywords: CFRP composite pipe, dynamic performance, vibration response, quasi-distributed optical fiber sensing technique, dynamic strain measurement
Citation: Wang H-P, Feng S-Y, Gong X-S, Guo Y-X, Xiang P, Fang Y and Li Q-M (2021) Dynamic Performance Detection of CFRP Composite Pipes based on Quasi-Distributed Optical Fiber Sensing Techniques. Front. Mater. 8:683374. doi: 10.3389/fmats.2021.683374
Received: 20 March 2021; Accepted: 08 July 2021;
Published: 17 August 2021.
Edited by:
Hui Yao, Beijing University of Technology, ChinaReviewed by:
Neven Ukrainczyk, Darmstadt University of Technology, GermanyJianbo Tian, Xi’an University of Technology, China
Copyright © 2021 Wang, Feng, Gong, Guo, Xiang, Fang and Li. This is an open-access article distributed under the terms of the Creative Commons Attribution License (CC BY). The use, distribution or reproduction in other forums is permitted, provided the original author(s) and the copyright owner(s) are credited and that the original publication in this journal is cited, in accordance with accepted academic practice. No use, distribution or reproduction is permitted which does not comply with these terms.
*Correspondence: Hua-Ping Wang, d2FuZ2h1YXBpbmcxMTI4QHNpbmEuY24=, aHB3YW5nQGx6dS5lZHUuY24=; Ping Xiang, cHhpYW5nMi1jQG15LmNpdHl1LmVkdS5oaw==