 Fang Wei
 Zhang Jingsheng2
- 1School of Traffic and Transportation Engineering of Changsha University of Science and Technology, Changsha, China
- 2International College of Changsha University of Science and Technology, Changsha, China
- 3Hunan Hongshang Testing Technology Co., Ltd, Changsha, China
In order to investigate the pullout resistance of the Horizontal-Vertical reinforcement, a “denti-geogrid” was assembled by bonding a “denti-strip” with the geogrid and the pullout tests were carried out. Subsequently, the analytical approaches were investigated to calculate the pullout resistance on the basis of the surface sliding model, Perterson and Anderson’s model, Jewell’s model, Chai’s model, and the proposed stress summation model. Moreover, a new index named “scale factor” was suggested to reflect the proportion of bearing resistance provided by transversal members. The research showed that: 1) under the same test conditions, the pullout resistance of denti-geogrid was much higher than that of a common geogrid. All common geogrids showed linear strain softening in the later stage of pullout tests. Given the same normal stresses, due to the expansion of effective areas suffering lateral earth pressure, more denti-strips meant more significant resistance; 2) Among five theoretical approaches, the solutions of the proposed stress summation model made the best agreement with lab test results, with an average relative error of 2.82%. On the other hand, the stress summation model also showed a simplicity in calculation; and 3) Due to higher gradient of the fitting curve of scale factors under lower load, the bearing resistance would be more and more dominant, which means that the lateral resistance of denti-strips could play a decisive role in cases of low stress level.
Introduction
Geosynthetic materials have proven to be effective in stabilizing and strengthening applications in infrastructure, such as stabilization of pavement layers, reinforcement of embankments, and improvement of soft foundations (Abdesssemed et al., 2015; Reyes et al., 2019; Daou et al., 2020; Behera and Nanda, 2021). The interfacial characteristics between geosynthetics and the filling directly determine the internal stability of reinforcement. Accordingly, it is necessary to provide design parameters of reinforced soil through interface friction tests in the stability or deformation analysis—usually by means of a pullout test (Abdi and Mirzaeifar, 2017; Hussein and Meguid, 2020; Kumar et al., 2020). Geotechnical reinforcement develops rapidly and its application scope has been broadened extensively in past decades. However, the design theories and construction methods of horizontal-planar reinforcement occupy a dominant position. In recent years, research on new reinforcement types has been performed (Lajevardi et al., 2013; Li and Tang, 2014; Mao and Zhang, 2014; Sayeed and Janaki, 2014; Zhu et al., 2014; Zhang and Xian, 2015; Andrew et al., 2016). In particular, since the spatial reinforcement forms provide additional conflnement along with the advantages of conventional forms, some steric reinforcing materials were developed to enhance the strengthening effect. Khedkar and Mandal (2009), Hegde and Sitharam (2017) studied the use of cellular reinforcement in retaining wall or soft foundation through experimental pullout tests, numerical simulation, and theoretical analysis. Harikumar et al., 2016 conducted laboratory plate load tests on a model footing resting on sand bed reinforced with plastic multi-directional reinforcements, and the multi-directional elements proved to be a viable alternative to the conventional planar geosynthetics. Makkar et al., 2019 also adopted laboratory-scaled plate load tests to investigate the performance of a sand bed reinforced with 3D geogrids of the rectangular pattern, and the results showed that a single layer of 3D geogrid could provide a threefold increment in bearing capacity compared to unreinforced soil. By attaching cubic dices to ordinary geogrids via elastic strips, Mosallanezhad et al., 2016 presented a new reinforcement system named “Grid-Anchor” and the interaction parameters between soil and the reinforcement were evaluated by measuring pull-out resistance; the tests proved that the Grid-Anchor system is able to increase the pull-out interaction coefficient by 100%, in comparison with the typical geogrid system. For the above-mentioned steric reinforcing elements, the common idea is to provide an additional vertical confinement and bearing resistance besides the horizontal friction of conventional geosynthetics. It is also significant to take the fabrication simplicity, working efficiency, and installation conveniency into account in the applications of steric reinforcement. Therefore, there is still a need for exploring the probable usage of more steric reinforcing materials, while the working performances should be carefully tested and evaluated via different approaches.
In 2006, Zhang and Min (2006) suggested a new type of Horizontal-Vertical (H-V) reinforcement material named “Denti-geogrid,” which combined the vertical denti-strips with a horizontal geogrid. Based on non-full H-V reinforced clay, a series of consolidated undrained triaxial tests were carried out to investigate the strength and deformation properties of the clay reinforced with H-V inclusions, in which the galvanized iron sheet and plexiglass were used as reinforcing materials (Zhang and Javadi, 2006). The behavior of clay reinforced with different vertical reinforcements was studied in terms of stress-strain relationship, strength property, and failure mode. The influences of vertical reinforcement, confining pressure, and reinforcing materials on the strength of reinforced clay were discussed (Zhang and Zhang, 2009). In addition, more than 100 sets of compression tests were carried out on sand reinforced with H-V inclusions. Effects of the horizontal component type and the vertical element height on sample strength were investigated (Wei and Zhang, 2011). By combining with model tests of reinforced sand cushion with denti-inclusions on soft ground under embankment, the reinforcing effects of biaxial grid reinforcement with variant denti-inclusion forms were compared (Sun and Zhang, 2012). In terms of numerical simulation, the foundation of non-reinforced ground, horizontal reinforced foundation, and H-V reinforced foundation were analyzed with the assistance of ABAQUS, and the effect of H-V reinforcement on foundation bearing capacity was evaluated with safety factors (Zhang and Zhang, 2011). The finite element method was also adopted in research on the interaction mechanism between the soil mass and the reinforcement of H-V retaining structure, and the linear-elastic beam element was used to simulate the behaviors of the reinforcement (Peng and Huang, 2009). The facing displacements and lateral earth pressures acting on the vertical elements obtained by particle flow code (PFC) were compared with the results of laboratory model tests on H-V reinforcement (Zhou and Zhang, 2012). Conclusively, small-scale specimens were employed in this research, while the horizontal and vertical elements were materialized by iron sheet and plexiglass which are not suitable for reinforced earth structures.
As an emerging pattern of the reinforcement with good engineering application potential, the soil strength would be significantly improved by combining the friction of the horizontal element and the resistance of vertical members. Consequently, laboratory pullout test of the denti-geogrid, which adopted a commercialized engineering geogrid in the fabrication of H-V reinforcement, was carried out to make a comparison with ordinary planar geogrid. Furthermore, a new method derived from Rankine’s passive earth pressure theory, which was called “stress summation method,” was suggested to calculate the ultimate resistance of single and double denti-strip(s) reinforcement since it showed superiority in contrast with other theoretical methods.
Laboratory Pullout Test of the Denti-Geogrid Reinforcement
Test Introduction
As shown in Figure 1, the H-V reinforcement was horizontally laid in sand mass with a length of L and a depth of H, bearing a full vertical uniform load p0 on the top surface. Subsequently, the drawing force (P) was applied to pull the reinforcement out of the sand at a specified velocity until it yielded or moved out. The drawing force and the displacement were measured during the pullout process.
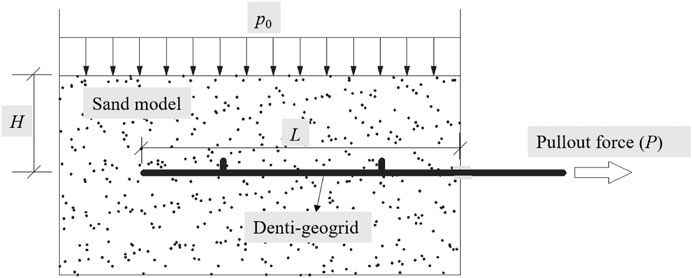
FIGURE 1. A schematic view of the pullout test.
Accordingly, the pullout test apparatus was developed as shown in Figure 2. The test chamber was 28 cm long in pullout direction and 25 cm in width. A clamp and a tensiometer were employed to connect the denti-geogrid and the actuator. Carved by a pair of steel plates, the clamp could be firmly fixed onto the denti-geogrid by bolts and fastened with the tensiometer (Figure 3). It ensured a uniformly distributed pullout stress on the edge of the denti-geogrid. The maximum range of the digital tensiometer was 3000 N, with an accuracy of 2 N. The pullout velocity and maximum travel of the actuator were 0.4 mm/s and 30 cm, respectively.
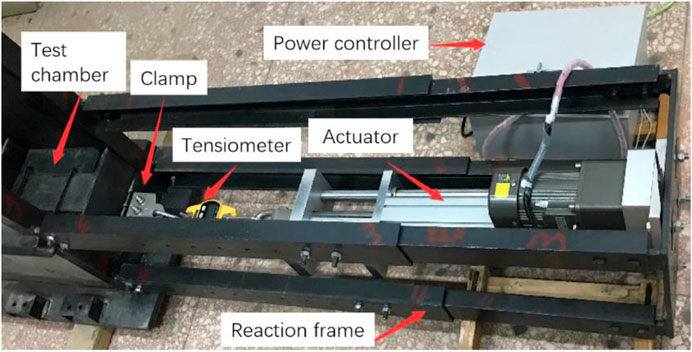
FIGURE 2. The pullout system.
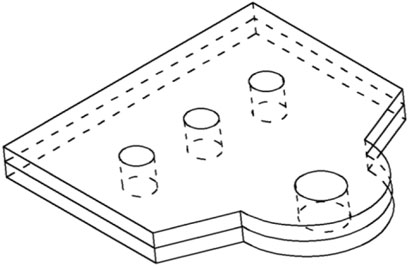
FIGURE 3. The clamp.
The denti-geogrid was composed by two parts: the horizontal geogrid layer and the transverse denti-strips (Figure 4). The material of vertical denti-strip, with a height of 2 cm and a width of 9 cm, was made of rigid angle aluminum with holes on the base. Strong nylon ties were used to bind and fix the angle aluminum with the transverse member of the geogrid. The attributes of biaxial stretching plastic geogrid adopted in the pullout test were given in Table 1.
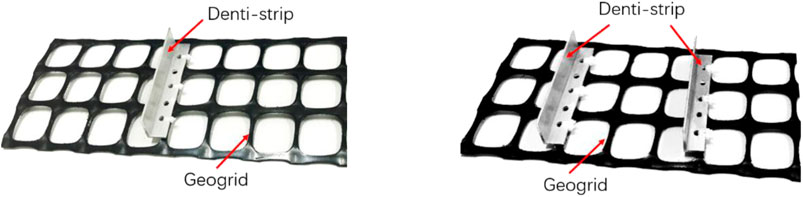
FIGURE 4. Denti-geogrid specimens.
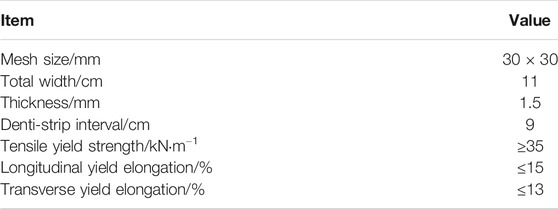
TABLE 1. Technical indicators of the biaxial stretching plastic geogrid.
The properties of filling sand, which could be classified as medium-coarse sand, were listed in Table 2. The parameters d10, d30, and d60 represented the mass percentages of particles smaller than the threshold size, which were 10, 30, and 60%, respectively. ρdmax and ρdmin denoted the maximum and minimum dry densities obtained by funnel method and vibration hammering method. c and φ were the cohesion and friction angle. By calculation, 25.2 kg sand was weighed as required in lab tests.

TABLE 2. Basic properties of the test sand.
In order to achieve the above research goals, the test procedure could be presented by Figure 5. 1) The sand model was filled into the test chamber in four layers. The sand amount and the height of each layer were measured to ensure the homogeneity of the sand model. The total height of the lower base was 10 cm. 2) The denti-geogrid specimen was fabricated with strong connections of the angle aluminum and the geogrid, and then it was emplaced on the flat lower base of the sand model with symmetrical margins on both sides. The initial length of the denti-geogrid embedded in the test chamber was set to be: L = 18 cm, and enough length of geogrid was left outside of the chamber for later installation. 3) The upper part of the sand model, with a height of 8 cm, was also constructed by layered filling. 4) An iron bearing board (28 cm × 25 cm) was laid horizontally on the top surface of the sand model. The vertical load p0 was applied by stacking mass weights and the iron board. 5) The external geogrid was fastened firmly with the clamp and then connected to the actuator via a tensiometer. The actuator was adjusted to achieve a tight connecting status of the components and the horizontal drawing on the geogrid was guaranteed by a bubble level. 6) The reading of the tensiometer was cleared and the actuator was then activated. The whole pullout process was recorded with a camera. By reviewing the video file, the geogrid displacement and the corresponding drawing force at any time could be obtained conveniently.
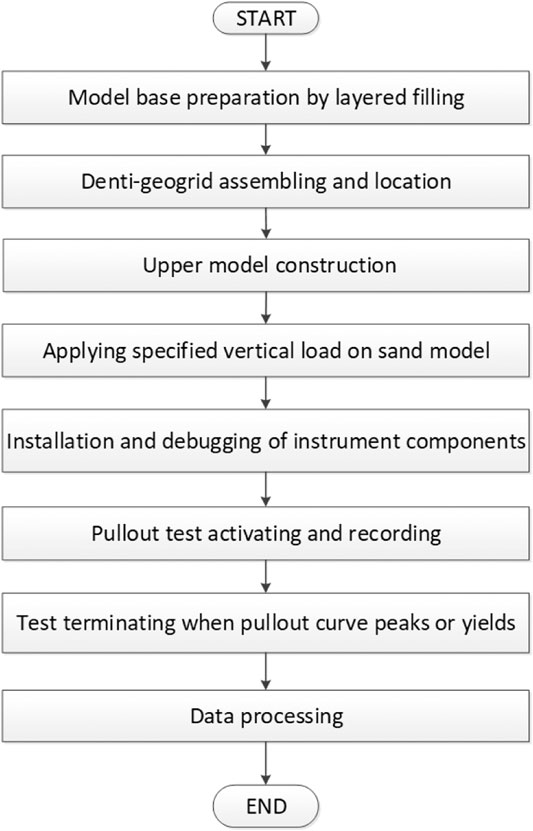
FIGURE 5. Test procedures.
Test Result and Analysis
Twelve comparative pullout tests were performed to investigate the ultimate resistance of three different kinds of reinforcing materials (common geogrid, single denti-strip geogrid, and double denti-strips geogrid) with four levels of vertical pressure acting on the geogrid (σn = 2.5, 5, 7.5, and 10 kPa). The pullout curves of the above reinforcements were shown in Figure 6.
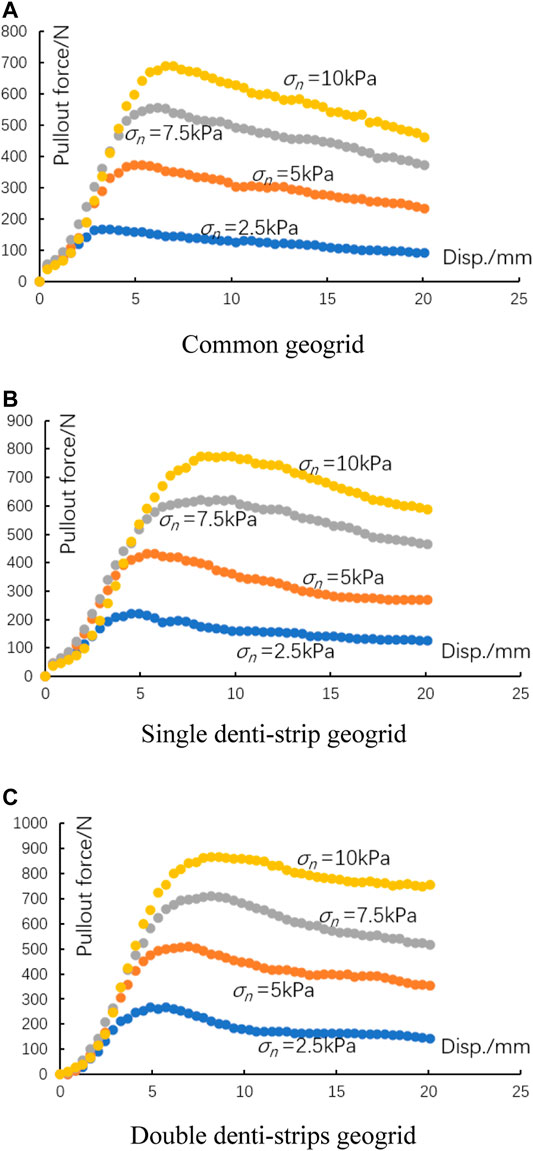
FIGURE 6. Relationship between pullout force and displacement. (A) Common geogrid; (B) Single denti-strip geogrid; (C) Double denti-strips geogrid.
It could be seen that: 1) all the pullout curves of three types of reinforcements peaked within 20 mm’s drawing displacement. The common geogrid showed linear strain softening in the later stage of the pullout tests. However, the decreasing rates of drawing force of single denti-strip geogrid and double denti-strips geogrid both slowed down and gradually stabilized; 2) The ultimate pullout force of all geogrids enhanced significantly with the increase of normal stress. Meanwhile, it also affected the displacement scale corresponding to the maximal resistance. The greater the normal stress applied, the larger the displacement corresponding to the curve vertex appeared, in other words, the later the peak resistance formed; and 3) Under the same normal stresses, due to the expansion of effective area suffering lateral earth pressure, more denti-strips meant more significant transversal resistance. Conclusively, a double denti-strips geogrid had a better drawing resistance than a single denti-strip geogrid, which was also superior to a common geogrid.
Moreover, the resistance provided by the denti-strip could be approximately estimated by the increment of the drawing forces between the denti-geogrid and the common geogrid. The results in Figure 7 indicated that the bearing resistance provided by denti-strips (Pv) was roughly in positive proportion to the strip quantity under the test conditions, proving that the failure mechanism of bearing reinforcement was composed of several individual failure fields without mutual interference. By realizing full development of the resistance of each denti-strip, the individual failure mechanism would thus yield the maximum resistance in the pullout test.
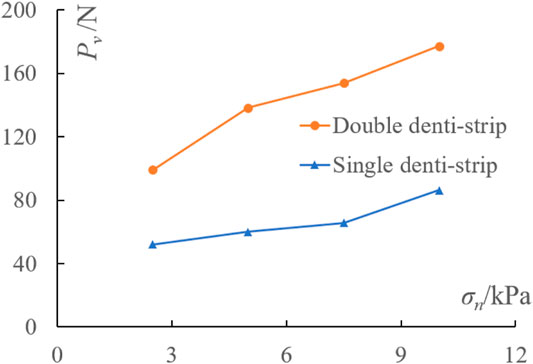
FIGURE 7. Bearing resistance acting on the denti-strip.
Theoretical Models for the Resistance of Denti-Geogrid
Since the denti-geogrid was in the state of force balance, the drawing resistance P could be denoted as the sum of the surficial friction of horizontal sheet (Ph) and the bearing resistance contributed by denti-strips (Pv), namely:
The frictional resistance Ph could be given by:
in which A represented the effective contact area between upper and lower surfaces of reinforcement and soil mass where sliding occurred and c′ and δ denoted interfacial cohesion and interfacial friction angle, respectively.
In order to evaluate the resistance caused by vertical bars, variant analysis models were put forward by researchers, resulting in various solutions with different expression forms. Ignoring the fact that adjacent denti-strips might interfere with each other in the pullout process, only a single denti-strip was taken into consideration in this section. Moreover, a unit width was considered in following models.
Pullout Models for Resistance Calculation of the Denti-Geogrid
Surface Sliding Model
The generalized model of the denti-geogrid under plane strain condition was simplified by Fang et al., 2017. As shown in Figure 8A length of rigid denti-geogrid was being pulled out leftward. f1 and f2 represented the frictions suffered by horizontal sheet and the wedge mass, while p1 and p2 were normal stresses acting on those sliding surfaces. Since the location depth (H) was supposed to be much larger than the height of the denti-strip (h), the normal stress f2 showed a uniform distribution over the surface of wedge block. According to Mohr stress circle, the angle between the slip surface and the major principal stress plane (i.e., the apex angle of the wedge block) was specified to be: α = π/4+φ/2.
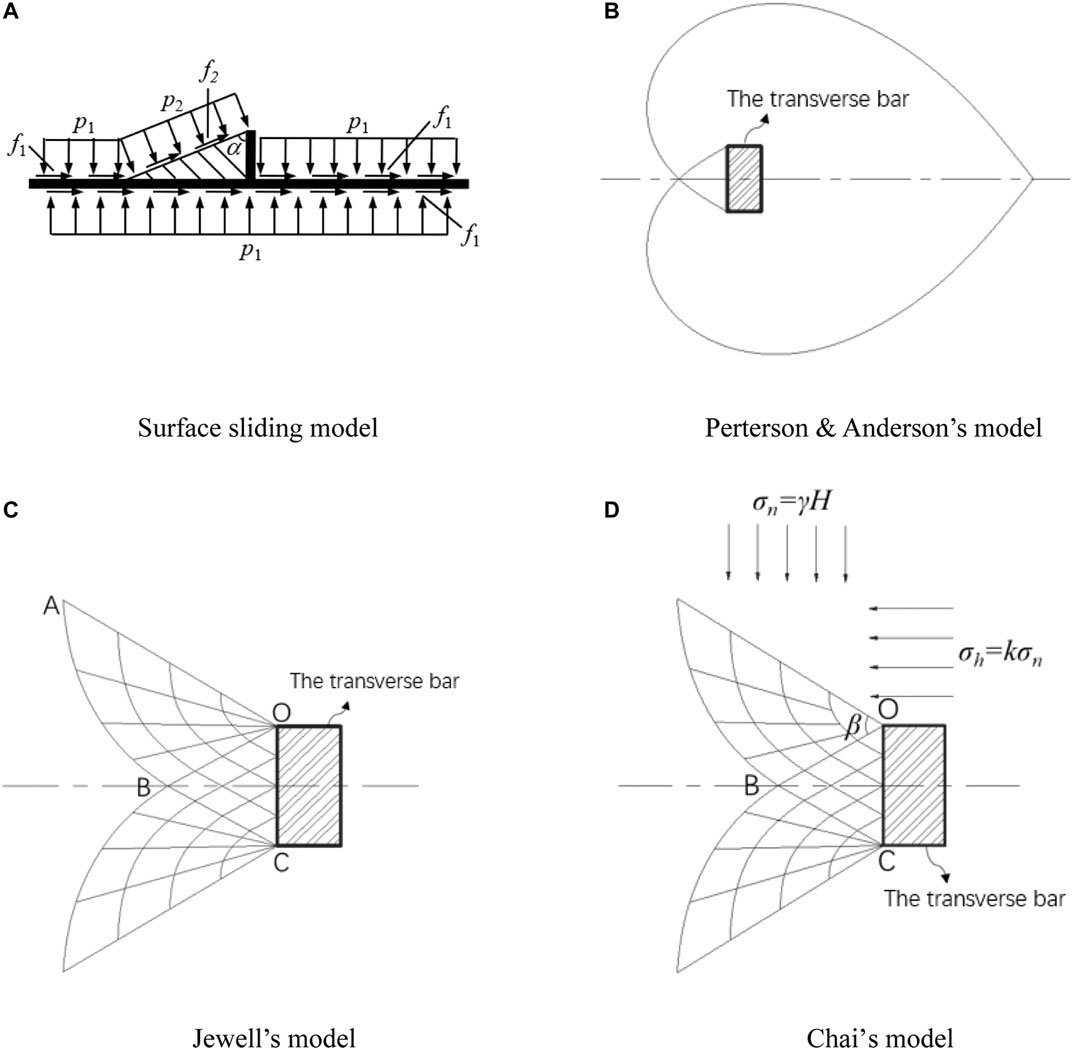
FIGURE 8. Different pullout resistance models. (A) Surface sliding model. (B) Perterson & Anderson’s model. (C) Jewell’s model. (D) Chai’s model.
Perterson and Anderson’s Model
Concerning the similarity between the resistance of transverse rib and the bearing capacity of strip footing, the latter’s analytical model could be applied in the calculation of the resistance of denti-strips by rotating 90°. Using the general shear failure model, Perterson and Anderson calculated the resistance of transverse ribs. The failure mechanism was shown in Figure 8B (Peterson and Anderson, 1980). Neglecting the weight of fillings, the resistance provided by the transverse rib could be stated as follows:
where Ab was the bearing area of the transverse rib and Nc and Nq were resistance coefficients which could be expressed by the friction angle of the filling.
Jewell’s Model
The punching failure model of transverse rib shown in Figure 8C was proposed by Jewell (Jewell et al., 1984), in which <AOB = <BOC. It had the same calculation expression of the resistance of transverse bars as Eq. 3, whereas Nc and Nq were different. With the increase of effective normal stress, the failure mechanism of the soil mass around the transverse rib gradually transformed from punching to general shear.
Chai’s Model
Based on the actual stress distribution characteristics of the soil mass around the transverse ribs during the pullout test, the punching model was modified by Chai, 1992. As shown in Figure 8D, σh was the horizontal stress, k represented the earth pressure coefficient, and <BOC = π/4+φ/2, β was a variable angle. It was commonly recommended that β = π/2 and k = 1 (Bergado and Macatol, 1993; Bergado et al., 1996).
Stress Summation Model
A new model for the calculation of transversal resistance, which is called “the stress summation model,” has been put forward on the basis of Rankine’s earth pressure theory. Rankine’s theory is one of the most classical theories for lateral pressure analysis in soil mechanics. Due to its clear concept and simple form, it has been widely used for earth pressure calculation in retaining wall and foundation pit engineering. Rankine’s theory was based on the half-spatial stress state and the limit equilibrium conditions; however, it is always quite difficult to meet such assumptions in practical engineering. In order to solve this problem, the soil layer above the top of the denti-strip was regarded as a uniformly distributed load in the calculation of lateral soil pressure acting on the denti-strip, and then the horizontal resistance of the denti-strip could be acquired according to the Rankine’s passive earth pressure model (Figure 9).
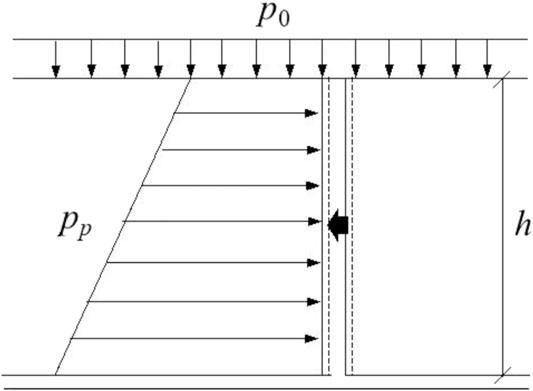
FIGURE 9. The stress summation model.
In the above analysis models, the main differences concentrated on the calculation means of passive-bearing resistance on transverse bar, whereas the acquisition approaches of frictional resistance provided by horizontal sheet were quite similar. As a clear contrast of calculation methods based on these models, more details were listed in Table 3. Note that A = Le•W1 and Ab= W2•h, in which Le was the effective length of horizontal-interfacial friction and W1 and W2 were the widths of horizontal reinforcement and the denti-geogrid.
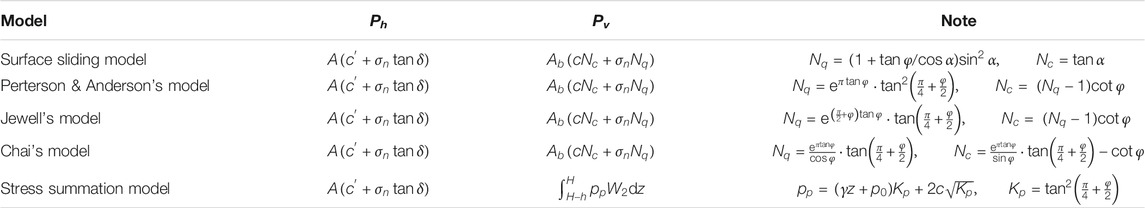
TABLE 3. Comparison of five models for the denti-geogrid resistance.
Case Study
According to the pullout model test of denti-geogrid reinforcement as elaborated above, the following parameters were adopted in theoretical calculation. The denti-strip: L = 18 cm, W1 = 0.11 m, W2 = 0.09 m, H = 0.1 m, h = 0.02 m; sand mass and sand-geogrid interface: ρ = 2.03 g/cm3, c = 0 kPa, φ = 35.2°, c′ = 0.12 kPa, δ = 61.54°; load levels: σn = 2.5, 5, 7.5, 10 kPa. Note that the interfacial cohesion c′ and interfacial friction angle δ could be easily obtained by linearly fitting the pullout test data of the common horizontal geogrid as aforementioned. Moreover, due to the semi-sliding field of the denti-geogrid, the resistance of the transverse member should be multiplied by a factor of 0.5 while applying Perterson and Anderson’s model, Jewell’s model, and Chai’s model.
The results of calculations and lab tests were shown in Figure 10 and Table 4. It could be concluded that: 1) All curves showed positive relationships between the total resistance and the normal stress, whether on a single or double denti-strip(s) geogrid. The resistance calculation results of the five models presented approximately linear growth as the normal stress increased. On the other hand, test results showed a moderate nonlinearity; 2) In the variation range of normal stress, the drawing forces calculated by the surface sliding model were generally smaller than test results. Since the horizontal friction composed a dominant part in the surface sliding model, the deficiency gradually increased with the denti-strip quantity. P&A’s model and Jewell’s model formed the upper and lower bounds of the resistance (Chen et al., 2013), while
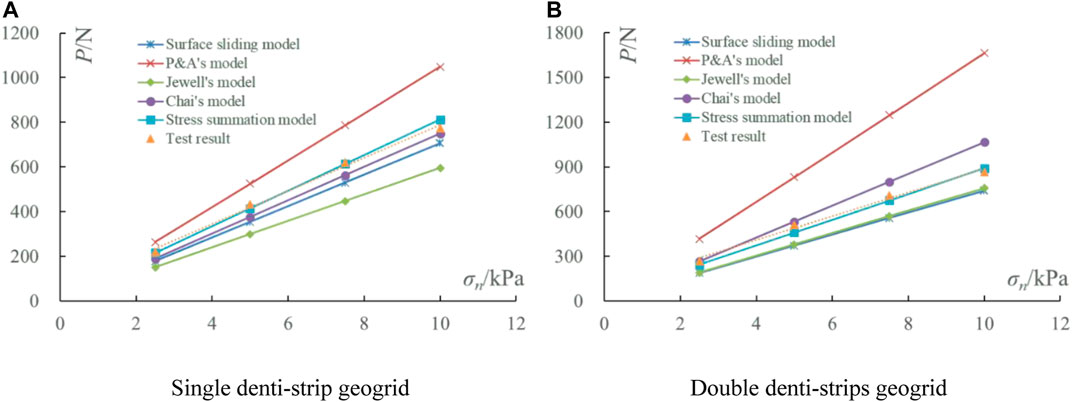
FIGURE 10. Resistance comparison of different theoretical models. (A) Single denti-strip geogrid. (B) Double denti-strips geogrid.
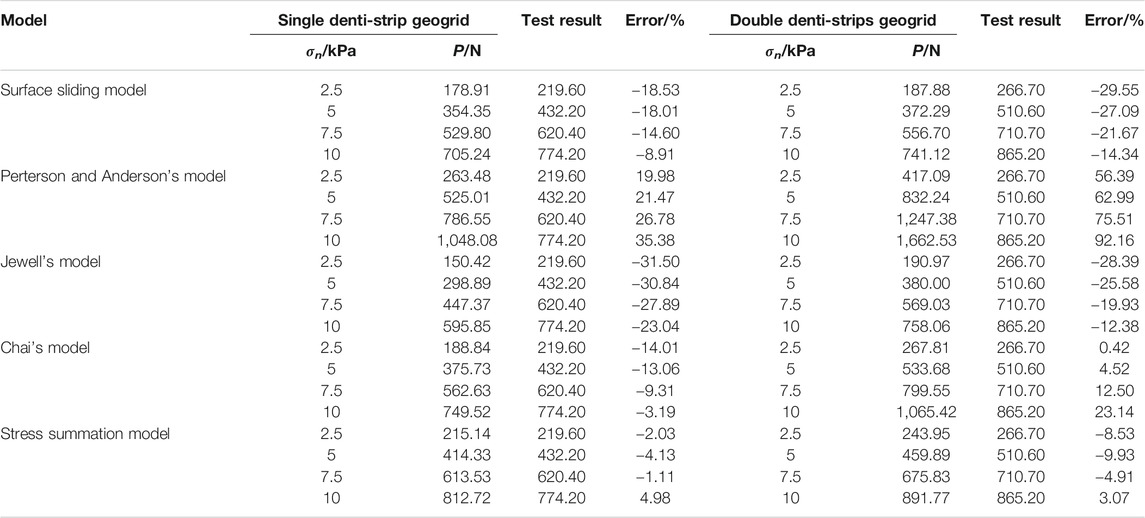
TABLE 4. Results of models for single and double denti-strip(s) reinforcement.
Chai’s model presented a more accurate solution; and 3) Among all these models, the stress summation model made the best agreement with test data, with an average relative error of 2.82%. Though the stress summation model was rarely used in the calculation of drawing force of reinforcements, it was proven that the model could present a convenient and precise solution in some cases. Consequently, by adopting reasonable assumptions, the applicability of the stress summation model is worthy of further research on the resistance evaluation of reinforcements.
In order to reflect the proportion of bearing resistance provided by the transversal bars, a scale factor could be defined as:
in which Pn and P1 denote the pullout resistance of a specified length of horizontal geogrid with n denti-strips and a single denti-strip. For individual failure mechanism of denti-strips, the Eq. 4 could be rewritten as follows:
It is obvious that the scale factor would be always greater than 1.00 according to the variable definition, and it is totally determined by the denti-strip quantity, as well as the ratio of frictional resistance along the horizontal surface of the geogrid (Ph) to bearing resistance in the front of each transversal member (P1v).
On the basis of aforementioned stress summation model, the pullout forces and scale factors corresponding to variant upper loads were presented in Table 5. Generally, the scale factors with constant denti-strips became larger and larger as the upper load decreased. In addition, Figure 11 shows the variation trend of the scale factor of denti-geogrid reinforcement. It is indicated that the scale factor enhances linearly with an increasing denti-strip amount. Since the scale factor is negatively correlated to Ph/P1v, less and lower denti-strips would lead to smaller scale factors. Meanwhile, as the scale factors appeared to be higher under lower load, the bearing resistance would have contributed a larger proportion in the total pullout force. Thus, bearing resistance acting on denti-strips could play a more dominant role in certain cases such as low-backfill reinforcement.
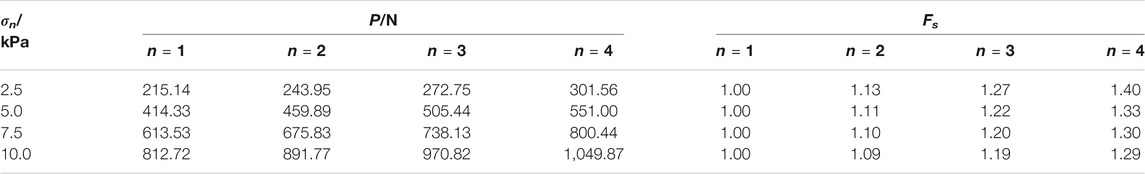
TABLE 5. The pullout force and scale factor under different load.
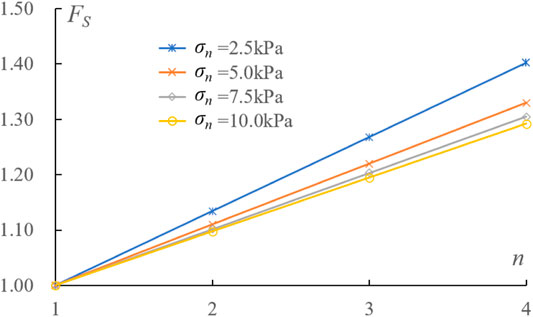
FIGURE 11. Variation curves of scale factor.
Conclusion
In order to investigate the pullout resistance of the denti-geogrid reinforcement, a laboratory pullout test was carried out, and then the analytical approaches were taken to evaluate the resistance. The following conclusions could be drawn:
The resistance of different kinds of geogrid layers enhanced significantly with the increase of normal stress. The common geogrid showed linear strain softening in the later stage of the pullout test. However, the decreasing rates of drawing force of single denti-strip geogrid and double denti-strips geogrids both slowed down and gradually stabilized. The greater the normal stress applied, the later the peak resistance formed. Under the same normal stresses, more denti-strips meant more significant resistance, and the denti-strip resistance was roughly in positive proportion to the strip amount under the test conditions.
For the five theoretical models of denti-geogrid resistance, all of the calculation results showed approximately linear growths as the normal stress increases. Chai’s model was more accurate than the surface sliding model, Perterson and Anderson’s model, and Jewell’s model. In the given case study, the stress summation model made the best agreement with lab test results, with an average relative error of 2.82%.
The scale factor could reflect the proportion of bearing resistance provided by the transversal bars. The factor, always larger than 1.00, grows linearly as denti-strip quantity increases. According to steeper inclination of the scale factor curve, it could be concluded that the bearing resistance contributed by denti-strips would be more dominant in some cases, such as low-backfill reinforcement.
Data Availability Statement
The original contributions presented in the study are included in the article/supplementary material, further inquiries can be directed to the corresponding author.
Author Contributions
FW and ZX: conceptualization and methodology. FW: conducting tests and writing the original draft. ZJ: editing the draft. SL: providing part of the test devices. All authors contributed to the article and approved the submitted version.
Funding
This work was funded by “slope stability risk assessment and prevention technology of expressway in mountainous area of Anhui Province (Grant No. 201839)”.
Conflict of Interest
Author SL was employed by Hunan Hongshang Testing Technology Co., Ltd.
The remaining authors declare that the research was conducted in the absence of any commercial or financial relationships that could be construed as a potential conflict of interest.
References
Abdesssemed, M., Kenai, S., and Bali, A. (2015). Experimental and Numerical Analysis of the Behavior of an Airport Pavement Reinforced by Geogrids. Construction Building Mater. 94, 547–554. doi:10.1016/j.conbuildmat.2015.07.037
Abdi, M. R., and Mirzaeifar, H. (2017). Experimental and PIV Evaluation of Grain Size and Distribution on Soil-Geogrid Interactions in Pullout Test. Soils and Foundations 57 (6), 1045–1058. doi:10.1016/j.sandf.2017.08.030
Andrew, W., Walters, S. J. J., and Armin, W. S. (2016). Frictional Resistance of Closely Spaced Steel Reinforcement Strips Used in MSE walls. J. Geotechnical Geoenvironmental Eng. 142, 04016030. doi:10.1061/(ASCE)GT.1943-5606.0001492
Behera, B., and Nanda, R. P. (2021). In-plane Shear Strengthening of brick Masonry Panel with Geogrid Reinforcement Embedded in Bed and Bed-Head Joints Mortar. Eng. Structures 227, 111411. doi:10.1016/j.engstruct.2020.111411
Bergado, D. T., Chai, J.-C., and Miura, N. (1996). Prediction of Pullout Resistance and Pullout Force-Displacement Relationship for Inextensible Grid Reinforcements. Soils and Foundations 36, 11–22. doi:10.3208/sandf.36.4_11
Bergado, D. T., Macatol, K. C., Amin, N. U., Chai, J. C., Alfaro, M. C., and Anderson, L. R. (1993). Interaction of Lateritic Soil and Steel Grid Reinforcement. Can. Geotech. J. 30, 376–384. doi:10.1139/t93-032
Chai, J. C. (1992). Interaction between Grid Reinforcement and Cohesive-Frictional Soil and Performance of Reinforced wall/embankment on Soft Ground. Bangkok, Thailand: Eng. dissertation. Asian Institute of Technology.
Chen, Q., Li, L., and Yuan, W. (2013). Wave Equation Relating to the Pre-laguerre System. Appl. Math. Lett. 26, 544–548. doi:10.3969/j.issn.1007-9629.2013.03.03110.1016/j.aml.2012.11.014
Daou, A., Chehab, G., Saad, G., and Hamad, B. (2020). Experimental and Numerical Investigations of Reinforced concrete Columns Confined Internally with Biaxial Geogrids. Construction Building Mater. 263, 120115–120213. doi:10.1016/j.conbuildmat.2020.120115
Fang, W., Chen, X.-y., and Yang, G.-l. (2017). Numerical Simulation of the Working Mechanism of Denti-Geogrid Reinforcement. J. Highw. Transp. Res. Dev. (English Ed.) 12, 7–13. doi:10.1061/JHTRCQ.0000619
Harikumar, M., Sankar, N., and Chandrakaran, S. (2016). Behaviour of Model Footing Resting on Sand Bed Reinforced with Multi-Directional Reinforcing Elements. Geotextiles and Geomembranes 44, 568–578. doi:10.1016/j.geotexmem.2016.03.008
Hegde, A., and Sitharam, T. G. (2017). Experiment and 3D-Numerical Studies on Soft clay Bed Reinforced with Different Types of Cellular Confinement Systems. Transportation Geotechnics 10, 73–84. doi:10.1016/j.trgeo.2017.01.001
Hussein, M. G., and Meguid, M. A. (2020). Improved Understanding of Geogrid Response to Pullout Loading: Insights from Three-Dimensional Finite-Element Analysis. Can. Geotech. J. 57 (2), 277–293. doi:10.1139/cgj-2018-0384
Jewell, R. A., Milligan, G. W. E., and Sarsby, R. W. (1984). Interaction between Soil and Geogrids in Proceedings Symposium on Polymer Grid Reinforcement in Civil Engineering, 22–23 March 1984. London: Thomas Telford Limited, 18–30.
Khedkar, M. S., and Mandal, J. N. (2009). Pullout Behaviour of Cellular Reinforcements. Geotextiles and Geomembranes 27, 262–271. doi:10.1016/j.geotexmem.2008.12.003
Kumar, B., Prabhakara, K., and Balunaini, U. (2020). Development of a Unique Test Apparatus to Conduct Axial and Transverse Pullout Testing on Geogrid Reinforcements. J. Mater. Civil Eng. 33 (1), 04020406. doi:10.1061/(ASCE)MT.1943-5533.0003497
Lajevardi, S. H., Dias, D., and Racinais, J. (2013). Analysis of Soil-Welded Steel Mesh Reinforcement Interface Interaction by Pull-Out Tests. Geotextiles and Geomembranes 40, 48–57. doi:10.1016/j.geotexmem.2013.08.002
Li, J., and Tang, C. S. (2014). Single Fiber Pullout Tests on Interfacial Shear Strength of Wave-Shape Fiber-Reinforced Soils. Chin. J. Geotechnical Eng. 36, 1696–1704. doi:10.11779/CJGE201409017
Makkar, F. M., Chandrakaran, S., and Sankar, N. (2019). “Bearing Capacity Improvement of Sand Bed Reinforced with 3D Geogrids of Rectangular Pattern,” in Sustainable Engineering. Lecture Notes In Civil Engineering. 30. Editors A. Agnihotri, K. Reddy, and A. Bansal (Singapore: Springer), 19–26. doi:10.1007/978-981-13-6717-5_3
Mao, Y. C., and Zhang, D. W. (2014). Study on Plant Fiber protection on Expressway Cutting Slope in Loess Area. J. Disaster Prev. Mitigation Eng. 34, 601–605.
Mosallanezhad, M., Taghavi, S. H. S., Hataf, N., and Alfaro, M. C. (2016). Experimental and Numerical Studies of the Performance of the New Reinforcement System under Pull-Out Conditions. Geotextiles and Geomembranes 44, 70–80. doi:10.1016/j.geotexmem.2015.07.006
Peng, M. Y., and Huang, C. (2009). Interaction Between Soil and Inclusions in Retaining wall Reinforced with Horizontal and Vertical Inclusions. J. Shanghai Univ. (natural science) 15, 199–204. doi:10.1360/972009-1650
Peterson, L. M., and Anderson, L. R. (1980). Pullout Resistance of Welded Wire Mats Embedded in Soil. Logan: Civil and Environmental Engineering Department, Utah State University.
Reyes, J. C., Smith-Pardo, J. P., Yamin, L. E., Galvis, F. A., Angel, C. C., Sandoval, J. D., et al. (2019). Seismic Experimental Assessment of Steel and Synthetic Meshes for Retrofitting Heritage Earthen Structures. Eng. Structures 198, 109477. doi:10.1016/j.engstruct.2019.109477
Sayeed, M. M. A., Ramaiah, B. J., and Rawal, A. (2014). Interface Shear Characteristics of Jute/polypropylene Hybrid Nonwoven Geotextiles and Sand Using Large Size Direct Shear Test. Geotextiles and Geomembranes 42, 63–68. doi:10.1016/j.geotexmem.2013.12.001
Sun, L. F., and Zhang, M. X. (2012). Comparative Experiments on Reinforcement Effects of Denti-Inclusion Forms. J. Shanghai Univ. (natural science) 18, 640–644. doi:10.3969/j.issn.1007-2861.2012.06.017
Wei, W., and Zhang, M. X. (2011). Influence of Horizontal Reinforcement Forms on Strength of Sand Reinforced With Horizontal-Vertical Inclusions. J. Shanghai Univ. (natural science) 17, 196–202. doi:10.1631/jzus.B1000185
Zhang, J. L., and Xian, J. J. (2015). Monitoring Study on Stress and Deformation of Reinforcement Retaining Wall. Geotechnical Invest. Surv. 8, 21–25.
Zhang, M., Javadi, A., and Min, X. (2006). Triaxial Tests of Sand Reinforced with 3D Inclusions. Geotextiles and Geomembranes 24, 201–209. doi:10.1016/j.geotexmem.2006.03.004
Zhang, M. X., and Min, X. (2006). Triaxial Tests on Sand Reinforced with One-Layer 3D Reinforcement. Chin. J. Geotechnical Eng. 28, 931–936. doi:10.1016/S1872-1508(06)60035-1
Zhang, M. X., and Zhang, X. B. (2009). Strength and Deformation Properties of H-V Reinforced clay. Rock Soil Mech. 30, 1563–1568. doi:10.1016/S1874-8651(10)60073-710.1016/j.matdes.2009.05.005
Zhang, T. T., and Zhang, M. X. (2011). Bearing Capacity Behavior and Failure Modes of H-V Reinforcement Foundation Based on Strength Reduction Finite Element Method. J. Shanghai Jiaotong Univ. 45, 757–761. doi:10.1631/jzus.B1000185
Zhou, H., and Zhang, M. X. (2012). Numerical Simulation on Mechanism of Soil Retaining Wall Reinforced With H-V Inclusions by DEM, Journal of Shanghai Jiaotong University 46, 1548–1552.
Keywords: denti-geogrid, pullout resistance, lab test, scale factor, theoretical model
Citation: Wei F, Jingsheng Z, Lijun S and Xudong Z (2021) The Resistance of Denti-Geogrid Reinforcement in a Sand Model Based on the Pullout Test. Front. Mater. 8:701812. doi: 10.3389/fmats.2021.701812
Received: 28 April 2021; Accepted: 31 May 2021;
Published: 13 July 2021.
Edited by:
Hui Yao, Beijing University of Technology, ChinaReviewed by:
Liangliang Wang, China University of Mining and Technology, ChinaPing Hu, Hunan University of Finance and Economics, China
Copyright © 2021 Wei, Jingsheng, Lijun and Xudong. This is an open-access article distributed under the terms of the Creative Commons Attribution License (CC BY). The use, distribution or reproduction in other forums is permitted, provided the original author(s) and the copyright owner(s) are credited and that the original publication in this journal is cited, in accordance with accepted academic practice. No use, distribution or reproduction is permitted which does not comply with these terms.
*Correspondence: Fang Wei, ZmFuZ3dlaTU2NDIzNjZAMTYzLmNvbQ==