 Yuanchao Yin
 Peng Yu1
 Ziguang Jia
- 1Department of Engineering Mechanics, Dalian University of Technology, Dalian, China
- 2School of Ocean Science and Technology, Dalian University of Technology, Panjin, China
Prototype fatigue tests simulate in-place working conditions of dynamic umbilicals that are usually conducted to verify fatigue life. The fatigue failure hot spot locates on the top segment of the umbilical. The umbilical reaches a maximum curvature at the hot spot. The hot spot position of the umbilical is always inside or near the bend stiffener. The radial gap between the umbilical and the bend stiffener is very small, making it difficult to put traditional sensors in the gap. In this work, a prototype umbilical tension-bending test is conducted, and the optic frequency domain reflectometer (OFDR) technology is utilized to measure the distributed strain of the umbilical inside the bend stiffener. The curvature of the umbilical is obtained to locate the fatigue hot spot in order to verify the feasibility of this approach. The test results show that the umbilical curvature can be measured well with the use of OFDR technology. The influence of tension and swing angle on the position of the maximum curvature is studied. The method proposed in this article provides a valuable approach for curvature monitoring in the application of dynamic umbilical fatigue tests.
Introduction
Dynamic umbilicals play an important role in offshore oil and gas development. They are used to connect the upper floater and the subsea Christmas tree system supplying necessary control, energy, and chemicals. The fatigue life of the umbilicals should be predicted to ensure dynamic application. Prototype fatigue test of umbilicals is the most reliable and acceptable method to verify the predicted fatigue life, which must be conducted before the in-field application. The key of the prototype fatigue test is to simulate the behavior of the umbilical during its in-place working condition accurately. Proper measurement methods should be applied to monitor the umbilical behavior and performance during the fatigue test.
The in-place working condition of the umbilical is shown in Figure 1. The top segment of the umbilical is believed to be a critical area in fatigue analysis and test, which is simulated in the prototype fatigue test. The fatigue failure hot spot is in this area as the structure in this area sustains the highest tension load and the maximum alternating curvature (He et al., 2020a).
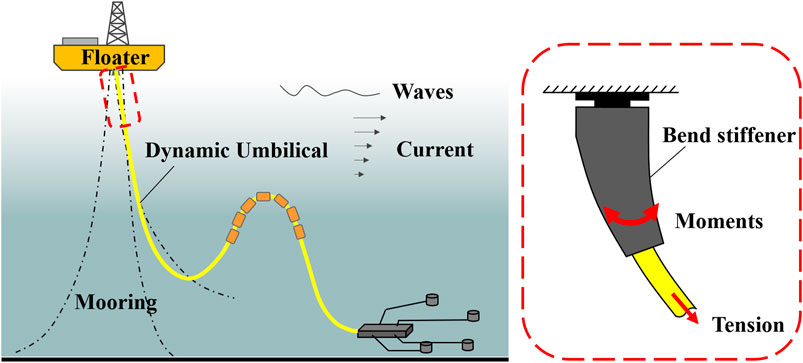
FIGURE 1. In-place working condition of dynamic umbilical.
The umbilical behavior of this area is difficult to predict due to the complex contact and interaction with the bend stiffener. The bend stiffener is a polymeric conical shape structure with nonlinear mechanical characteristics. The polyurethane material of the bend stiffener is viscoelastic. The shape of the bend stiffener and the cross-section of the umbilical are shown in Figure 2. The radial gap between the bend stiffener and the umbilical is illustrated in Figure 2A. The size of the gap is normally 5–15 mm. The gap leads to different deformation and curvature of the bend stiffener and the umbilical. Figure 2B shows the cross-section of an umbilical; the components are unboned and free to slip in the umbilical, which leads to its nonlinear bending stiffness. Several studies have been conducted to obtain the curvature and bending behavior of umbilicals in this area. Tang et al. (2015) have developed an analytical model considering the material and geometrical nonlinearity of the bend stiffener to calculate the curvature of the top segment of the flexible riser. Vaz et al. (2007) and Caire (Caire et al., 2016; Caire and Vaz, 2017) have proposed analytical formulation for bend stiffeners considering nonlinear viscoelasticity. Ruanet et al. (2017) have conducted a dynamic analysis of a flexible riser with bend stiffener. However, the above researches were mainly focused on obtaining the behavior of bend stiffener instead of the umbilical. Determining the location of the maximum curvature is challenging using analytical methods.
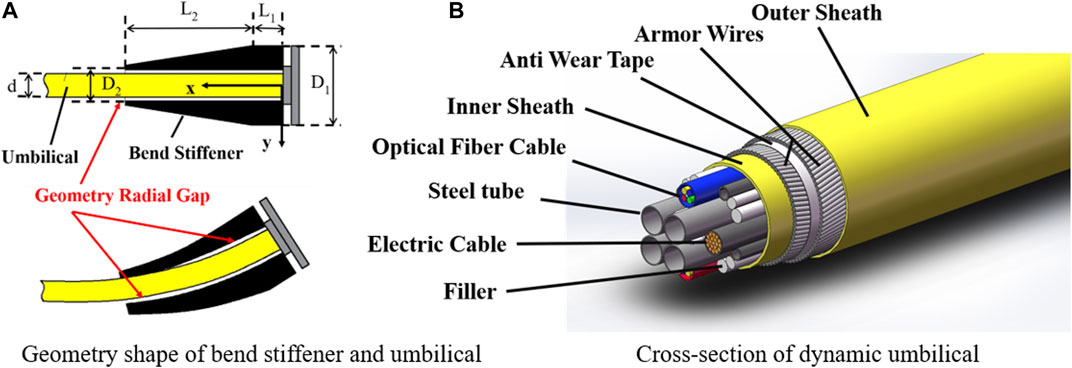
FIGURE 2. Shape of bend stiffener and Cross-section of the umbilical.
Different measure methods were utilized to obtain the curvature of the umbilical by fatigue tests. He et al. (2020b) have applied an image-based technique using the optical target tracking method to measure and monitor the curvature distribution of a bend stiffener in full-scale bending-tension tests. Leroy and Estrier (2001) have used parallel strain gauges to obtain axial and transverse strain variations in tension armors and calculate the bending behavior of a flexible riser. However, the curvature of the umbilical is different from the bend stiffener. The location of the maximum curvature is different in the two structures, which leads to different analysis results for fatigue. The curvature of the umbilical inside the bend stiffener cannot be measured directly by traditional measure methods. The radial gap between the bend stiffener and the umbilical is small, making it difficult to place the sensor. It is necessary to develop a method to obtain the curvature of the umbilical and locate the hot spot in the fatigue test for a more accurate fatigue life analysis.
Optic fiber sensing technology has been applied in many domains for its advantages in parameters measurement in field and laboratory tests. Fiber-optic sensors are used to transmit and sense signals such as strain, temperature, and pressure. Compared with other sensors, the fiber-optic sensor has a small size, which makes strain measure or monitor in small spaces possible. The sensor can be multiplexed along the length of a fiber for more measurement points. The optic fiber sensing technology also has advantages of high accuracy, low loss, and immunity to electromagnetic interference (Li et al., 2014). Different kinds of sensing technology using fiber-optic sensors were developed, such as fiber Bragg grating (FBG) sensors (Li et al., 2011; Gautam et al., 2016; Matveenko et al., 2018) distributed and dominated by Brillouin optical time domain reflectometer (BOTDR) (Moffat et al., 2015; Wu et al., 2015) and by Brillouin optical time domain analysis (BOTDA) (Inaudi and Glisic, 2010). Ren et al. (2014) and Jia et al. (2019) have proposed methods to detect pipeline leakage and its localization by FBG sensors. Feng et al. (2019) have applied BOTDA technology to measure the strain of the geotechnical structure with less than 4% accumulated errors. Gao et al. (2018) have applied the OFDR technology to measure the strain of the cast-in-place concrete pile (PCC) by installing the optical fiber onto the surface of the PCC pile. Ren et al. (2018) have applied the OFDR technique to monitor pipeline corrosion and leakage. With the advantage of the small size and continuous characteristics of OFDR technology, a direct measurement of umbilical curvature may be achieved.
This article presents a curvature distribution measurement of dynamic umbilicals using high-accuracy OFDR-based strain sensing technology. A prototype fatigue test of umbilical was conducted with the fiber-optic sensors installed on the outer sheath. The strain distribution on the tested umbilical inside the bend stiffener was measured. The maximum bending curvature spot of the umbilical was found and located. The influence of tensile load and swing angle on the position of the maximum curvature is studied.
Prototype Fatigue Test Description
A summary of the test method, test rig, test specimen, and test setup are described in this section.
Test Method and Test Rig
The goal of the fatigue test is to simulate the true behavior of the umbilical and bend stiffener system on the top segment of the layout. The curvature of the umbilical is a critical parameter to evaluate the accuracy of the simulation. The real working condition behavior of the umbilical is simplified as a combination of tension and in-plain bending. Constant tensile load and alternating bending moments should be applied to the umbilical in the fatigue test. The principle of the fatigue test is to guarantee the similarity of strain where the maximum curvature is reached, which leads to two critical control parameters of the test: the location and value of the maximum curvature.
The maximum curvature always locates in the area where the umbilical is inside of or near the bend stiffener. The curvature of the inside umbilical is difficult to be calculated using the theoretical analysis model due to the complex contact behavior and the nonlinear characteristics of the bend stiffener and the umbilical. It is necessary to obtain the curvature of the umbilical for an accurate fatigue test. As the curvature is the response of the umbilical, trail tests should be conducted to obtain the loading parameters.
To guarantee the accuracy of the prototype fatigue tests, the following items should be taken into consideration and met. The curvature at the end of the tension actuator should reach zero by designing the length of the test specimen. The length of the swinging head from the installation end to the rotation center should be designed. Under the condition that the fatigue response of the umbilical remains unchanged, the test frequency should be increased properly to shorten the test duration.
A prototype tension-bending fatigue test of a system involving umbilical and bend stiffener was conducted by the fatigue test rig from Dalian University of Technology (DUT). The schematic picture of the test rig is shown in Figure 3. The test rig simulates real in-place working conditions of the umbilical by applying constant tensile load by hydraulic actuators. The reciprocating bending moment is applied by a swing head linked to a rotation center. The test rig is adjustable with a test length of umbilicals or flexible risers up to 20 m. The swing head of the test rig is also adjustable from 1 to 3.5 m. The test rig can meet most of the testing requirements for dynamic umbilicals, cables, and flexible risers. The maximum tension capacity of the test rig is 500 kN. The maximum bending capacity is 150 kNm with a swing angle within ±15°. The tension and bending actuators are free to rotate in the bending plane with a hinge joint, which leads to a more accurate simulation. The test frequency of the test rig can reach up to 0.1 Hz.
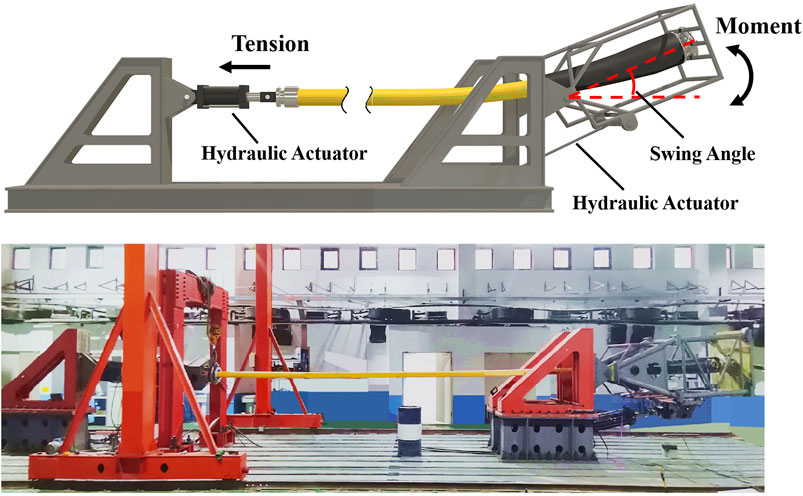
FIGURE 3. Schematic and picture of the test rig.
Test Specimen and Test Setup
A dynamic umbilical was applied in this test. The key parameters of the umbilical are listed in Table 1. A bend stiffener was assembled on the umbilical. The geometry shape of the bend stiffener is illustrated in Figure 2A. The geometry parameters of the bend stiffener are listed in Table 2.
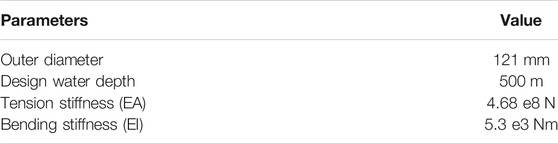
TABLE 1. Key parameters of the umbilical.

TABLE 2. Geometry parameters of the bend stiffener.
A global Cartesian coordinate system (X, Y) is adopted to describe the measurement location of the umbilical, as shown in Figure 2A. The origin point (0, 0) is at the top of the bend stiffener. The distance from the origin point to the swing center of the swing head is 2.5 m. The length of the test sample is 16 m. The length of the bend stiffener is 2.92 m.
The constant tensile load applied in the test is 100 kNN. The swing angle applied in the test is from 0° to 8°, which is measured by a tilt angle sensor placed on the swing head. Each test was repeated three times to verify the accuracy of the results. The average environment temperature and humidity during the test are 23°C and 70%, respectively.
Fatigue failure of the umbilical typically occurs instantaneously. The behavior of the umbilical should be measured during the fatigue test to infer and analyze the failure. Load cells and tilt sensors are applied to monitor the loads applied to the umbilical. Curvature distribution, change of the tension stiffness, temperature, pressure of tubes, and continuity of photoelectric signal should be monitored during the test. Four groups of tests were conducted as listed in Table 3.
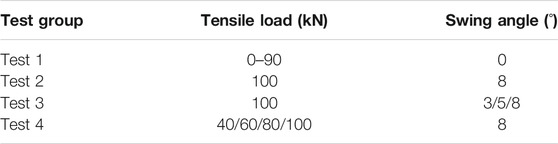
TABLE 3. Test conditions.
Distributed Optical Fiber Sensing Technology
Methods of Curvature Measurement
Different measure methods were attempted to obtain the curvature distribution and the location of the maximum curvature.
The measurement of the direct shape and deformation of the structure is believed to be the best method to measure the curvature due to its accuracy. Linear Variable Displacement Transformers (LVDT) or potentiometers are standard sensors for distance measurement. A large number of sensors are needed to draw the distribution of the curvature. Advanced sensors such as laser displacement sensors and optical target tracking technology can be employed for curvature sensing. However, this method can only obtain the external shape of the bend stiffener whose curvature is different from that of the umbilical, as stated before.
Considering the contact between the umbilical and the bend stiffener, a matrix piezoelectric sensor can be applied to measure the pressure distribution of their interface. The curvature can be obtained by analyzing the relationship between pressure and curvature through the numerical model. Moreover, the contact behavior can be different with the use of the sensor. The accuracy of this method needs to be verified.
The strain of the outer sheath can reflect the curvature of the umbilical when a simple load is applied. The traditional way of strain sensing is by the strain gauge. The strain gauge can only be pasted on the interface of the umbilical with single point measurement. The curvature distribution measurement requires a large number of sensors. Moreover, the space between the umbilical and the bend stiffener is limited, which leads to the difficulty of the lead-out conducting wires. The fiber-optic sensor has a small shape and can sense multiplexed points along the fiber. This sensing technology requires no conducting wires. The advantages of the fiber-optic sensor make it a potential method for curvature measurement.
The comparison of different methods of curvature measurement for umbilical is listed in Table 4.
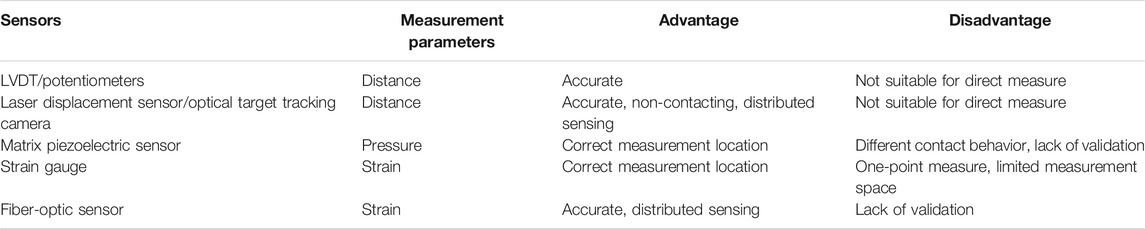
TABLE 4. Comparation of different methods of curvature measurement.
Principle of Distributed OFDR Technology
Distributed OFDR technology was developed by Eickhoff in 1981 (Eickhoff and Ulrich, 1981). The principle of ODFR is shown in Figure 4. The laser source emits continuous and tunable lights. The lights go through an optic fiber coupler and are divided into two parts. One part of the emitted lights is sent to the fiber-optic sensor. The Rayleigh backscattering light is produced as signal lights. Light frequency and spectrum change when strain or temperature changes on the sensor. The other part of the emitted lights is reflected back and passes through polarization controllers, used as the reference beam. The reflected signal lights and the reference beam are coupled by the optic fiber coupler and sent to the detector.
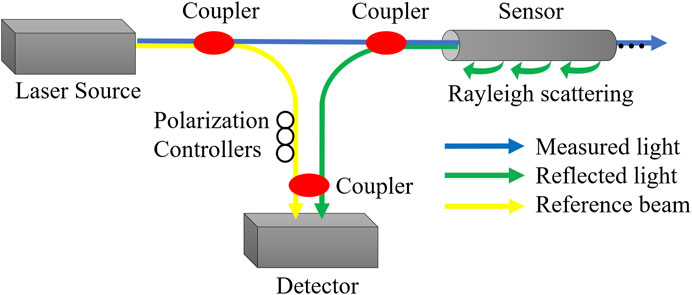
FIGURE 4. Principle of ODFR.
The light spectrum changes with the strain or temperature change. The light spectrum between the reflected Rayleigh backscattering light and the reference beam can be measured, compared, and analyzed in the detector. Meanwhile, the optical frequency of the Rayleigh backscattering light at different positions is different due to the tunable laser source. The light frequency can be detected and analyzed by the detector. The following relationship between spectrum, strain, and temperature can be given:
where ε and ΔT are the variations of strain and temperature, Kε and KT are the sensitivity coefficient of strain and temperature, Δλ is the change of the resonance wavelength, Δν is the spectrum shift, and λ and ν are the mean wavelength and frequency. Based on the above principles, the strain and temperature at different positions of the fiber-optic sensor can be obtained.
Layout of Fiber-Optic Sensor
The layout and protection of the fiber-optic sensor are very important. The umbilical and the bend stiffener may have a large contact force and friction force during the fatigue test. The fiber-optic sensor is fragile and has a low capability of resistance to shear stress. The fiber-optic sensor may break off if it was glued on the surface of the umbilical. Several attempts were made to find a method to protect the fiber-optic sensor. The layout of the fiber-optic sensor and system is shown in Figure 5. The main steps are introduced as follows.
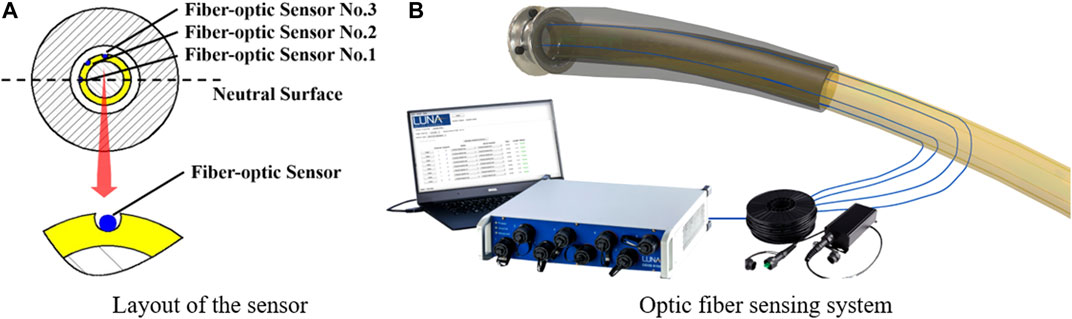
FIGURE 5. Layout of the Fiber-optic sensor and system.
Take off the bend stiffener and reserve enough measurement length for the fiber-optic sensor. The reserved length should be longer than the length of the bend stiffener, so the end of the fiber-optic sensor can be out of the bend stiffener. Then, draw a line along the outer sheath of the umbilical, which is the location of the sensor. Cut a U-shape notch along the line with a depth of 2–3 mm. The whole fiber-optic sensor should be placed inside the notch, as shown in Figure 5A. Clean the notch and lay the fiber-optic sensor inside it. The fiber-optic sensor should have enough reserved length on both ends for the follow-up connection with the measure instrument. Fix the fiber-optic sensor at one end of the notch with glue 502 or similar glue with a short coagulation time. After the sensor is fixed at one end, gently stretch the fiber-optic sensor on the other side of the notch with a small weight. Fix several points along the sensor using glue 502. Pour the epoxy resin into the notch and cover the fiber-optic sensor. The fiber-optic sensor will be well prepared after the coagulation of the epoxy resin for 24 h. Put back the bend stiffener after all the sensors are prepared.
The advantage of this method is that the fiber-optic sensor can be protected. The sensor is sensitive to measure the strain change of the umbilical. Moreover, both ends of the fiber-optic sensor can be connected to the measurement instrument if one end of the sensor is broken.
The sensing fiber used in the test is a standard single-mode optical fiber coated by Hytrel® 6,356 material. The diameter of the optical fiber is 0.9 mm. LUNA ODiSI 6000 was applied as the measurement instrument in this test. The schematic of the curvature measurement system using fiber-optic sensors in the fatigue test is shown in Figure 5B. Three fiber-optic sensors were installed on the umbilical. The angles between the fiber-optic sensor and the neutral surface are 0°, 45°, and 90°. The length of each fiber-optic sensor is approximately 6 m. Each point on the fiber-optic sensor can be seen as a sensing point. The gage pitch on the fiber-optic sensor was set to 2.6 mm with a 25 Hz sampling frequency. The position of the start point of the measure segment can be set by pressing the gauge pitch before the test.
Curvature Algorithm
The strain on the outer sheath of the umbilical can be measured through the fiber-optic sensor. As the umbilical sustains the combination of tension and bending, the measured strain can be written as follows:
The curvature of the umbilical is caused by the bending stress and can be written as follows:
where y is the distance from the fiber-optic sensor to the neutral surface, θ is the angle between the fiber-optic sensor and the neutral surface, d is the outer diameter of the umbilical.
Fiber-optic sensor No. 1 lays on the neutral surface. When the umbilical is under the combined load of tension and bending, the longitudinal stress and strain caused by bending are zero. The strain measured by sensor No. 1 represents the pure tension strain.
The average curvature is calculated in this test and can be written as follows:
where ε1, ε2, ε3 is the measured strain of fiber-optic sensors No. 1, No. 2, and No. 3.
Test Results and Analysis
Pure Tensile Test and Static Trial Test
To observe the performance of the applied fiber-optic sensor on the umbilical, a trail pure tension test was conducted. In this test, the swing head of the test rig is in the horizontal position. There is no contact between the umbilical and the bend stiffener in this trial test. A pure tensile load of 0–90 kN was applied to the umbilical. The test results are shown in Figure 6. The strain of the three sensors was recorded to verify if the sensor is fixed well onto the umbilical. The tension strain on the umbilical should be stable along the umbilical. Figure 6A shows the strain along the umbilical on different pure tensile loads of the No. 3 fiber-optic sensor.
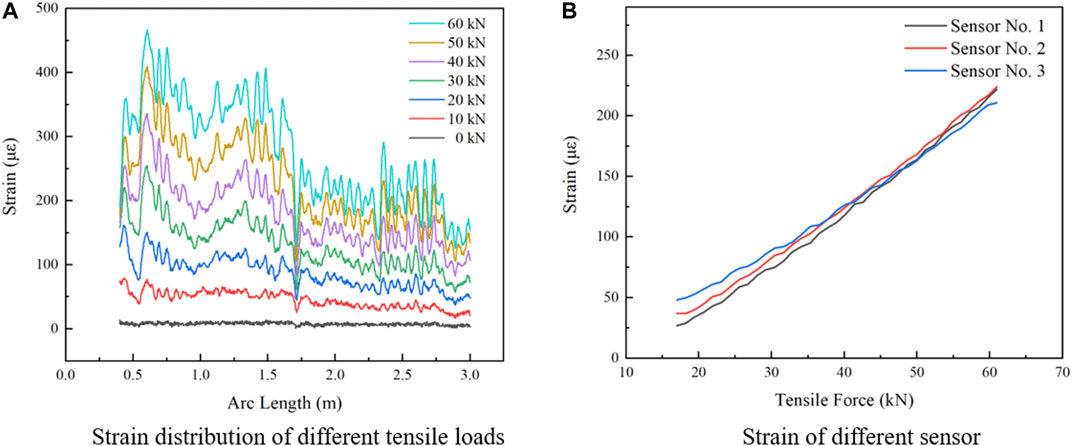
FIGURE 6. Strain results of tension test.
As shown in Figure 6A, the strain along the arc length of the umbilical tends to be stable and changes in a small amplitude. The strain increases linearly on each point with the increasing tensile load. There is a loss of strain at the location of 1.7 m along the arc length. The decrease of strain is caused by the loose bond of the sensor at this point. However, as the tension stress will be subtracted during the test, the fluctuation of the tension strain will not affect the test results. The results of the trial test prove that the fiber-optic sensors are well fixed on the umbilical and the measured strain meets the theoretical tendency. Figure 6B shows the tension strain of the three different sensors at the same arc length of 2 m. The error between the sensors decreases with the increasing tensile force. The maximum error is 6.1% at the load of 90 kN.
A follow-up static trial test 2 was conducted to compare the measured curvature through two different measurement methods. A tensile load of 100 kN with an 8° swing angle was applied in this test. The deformed shape of the bend stiffener was measured by using a laser displacement sensor as stated in Methods of Curvature Measurement section. The curvature of the umbilical is calculated by the tested shape information of the bend stiffener. The maximum curvature and its location in the two measurement methods are compared, which is shown in Table 5. The maximum curvature obtained by the two methods is almost the same. However, there is still a difference between the location of the maximum curvature by the two methods. The pitch of different measuring points by the laser displacement sensor is smaller than the fiber-optic sensor. The maximum curvature and its location will be measured more accurately by applying a more densely measuring point by OFDR. As the fiber-optic sensor is placed on the umbilical, it is believed that the data of the OFDR method are more reliable.
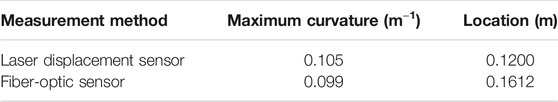
TABLE 5. Maximum curvature and its location measured by OFDR.
The Influence of the Swing Angle on the Curvature
Test 3 was conducted with a constant tensile load of 100 kN and swing angle up to 8°. The test results are shown in Figure 7. Figure 7A shows the curvature of the umbilical on different swing angles. The curvature shows an increasing trend at the starting area of the umbilical. The curvature reaches the maximum point at the area between 0.16 and 0.27 m along the arc length. Then, the curvature shows a decreasing trend. If the bend stiffener is not applied with the umbilical, the maximum curvature happens on the umbilical end. The location of the maximum curvature moves towards the middle segment along the umbilical by the influence of the bend stiffener. The decrease rate of the umbilical increases after 0.45 m, which is the length of the root of the bend stiffener. The outer diameter of the bend stiffener decreases at the location of 0.45 m along the arc length.
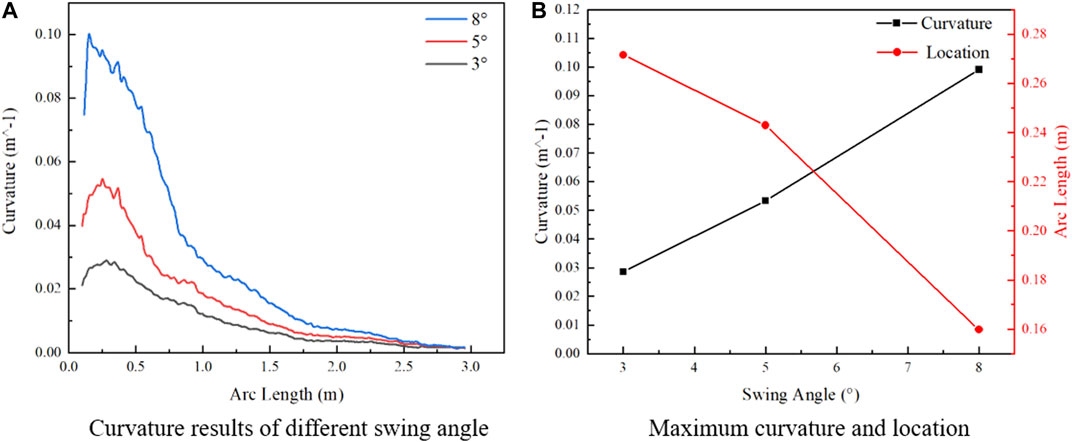
FIGURE 7. Curvature results with different swing angle.
The value and location of the maximum curvature are shown in Figure 7B. The maximum curvature increases linearly with increasing swing angle. The location of the maximum curvature moves to the end side with increasing swing angle. The test results show that the location of the maximum curvature of the umbilical is not at the same place with the change of swing angle, the area in which the maximum curvature lays is determined. Rigorous monitoring of the umbilical should be conducted in this area, such as more dense distribution of sampling points and damage monitoring of the umbilical.
The Influence of the Tensile Load on the Curvature
Test 4 was conducted with a constant swing angle of 8° and the tensile load changes. The test results are shown in Figure 8. Figure 8A shows the curvature of the umbilical with different tensile loads and the same swing angle of 8°. The maximum curvature and its location are shown in Figure 8B. The result shows that the curvature increases linearly with increasing tensile load. The location where the maximum curvature happens differs with the different tensile loads. The maximum curvature location decreases with the increasing tensile load. With the increase of the tensile load from 40 to 80 kN, the location of the maximum curvature moves from 0.27 to 0.15 m along the arc length. When the tensile load is larger than 80 kN, the location stays stable with the increasing tensile load.
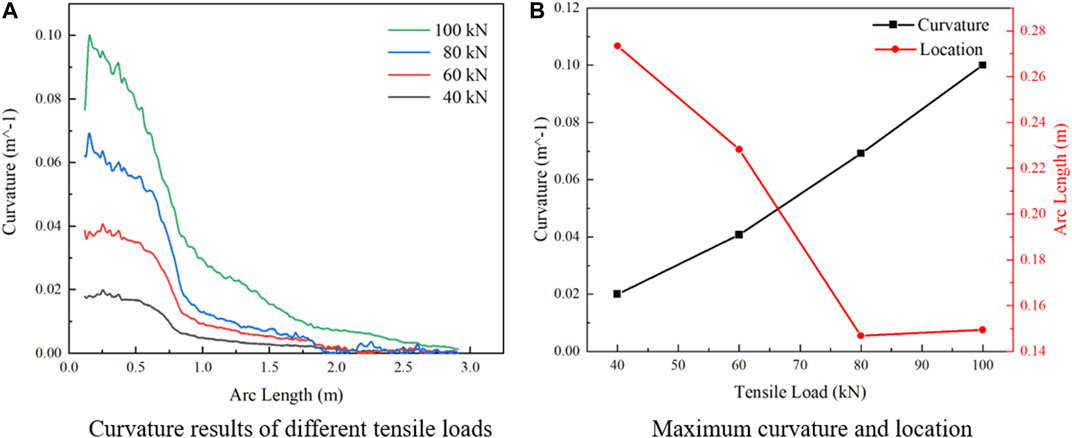
FIGURE 8. Curvature results with different tensile loads.
Conclusion
In conclusion, a new measurement method based on OFDR technology was developed for monitoring the maximum curvature in the dynamic umbilical fatigue test. A tension-bending test was conducted to verify the feasibility of this method. The experimental results of this study lead to the following conclusions:
(i) The distributed OFDR technology was proved to be feasible to measure the curvature of the umbilical inside a bend stiffener in a prototype fatigue test. The maximum curvature and its location can be measured successfully by utilizing this method.
(ii) The curvature of the umbilical measured by the fiber-optic sensor is different from the direct displacement measure outside the bend stiffener.
(iii) The maximum curvature of the umbilical increases linearly with increasing tensile load and swing angle.
(iv) The location of the maximum curvature is in a specific area instead of a fixed point with the change of tensile load and swing angle. The location of the maximum curvature moves to the end side of the umbilical with increasing tensile load and swing angle.
Data Availability Statement
The original contributions presented in the study are included in the article/supplementary material; further inquiries can be directed to the corresponding author.
Author Contributions
YY was responsible for experiment test and writing; PY conducted the experiment test; ZJ contributed to the meethodology; SW reviewed the work; QL and JY were responsible for funding acquisition; QY supervised the study. All authors have read and agreed to the published version of the manuscript.
Funding
This research was financially supported by the National Natural Science Foundation of China (No. U1906233 and No. 52001088), Major Scientific and Technological Innovation Projects in Shandong Province (No. 2019JZZY010801), Research and Development Projects in Key Areas of Guangdong Province (No. 2020B1111040002), and Fundamental Research Funds for the Central Universities (DUT21JC21, DUT19ZD204, and 3072020CF0703).
Conflict of Interest
The authors declare that the research was conducted in the absence of any commercial or financial relationships that could be construed as a potential conflict of interest.
Publisher’s Note
All claims expressed in this article are solely those of the authors and do not necessarily represent those of their affiliated organizations, or those of the publisher, the editors and the reviewers. Any product that may be evaluated in this article, or claim that may be made by its manufacturer, is not guaranteed or endorsed by the publisher.
References
Caire, M., and Vaz, M. A. (2017). A Nonlinear Viscoelastic bend Stiffener Steady-State Formulation. Appl. Ocean Res. 66, 32–45. doi:10.1016/j.apor.2017.05.008
Caire, M., Vaz, M. A., and Ferreira da Costa, M. (2016). Bend Stiffener Nonlinear Viscoelastic Time Domain Formulation. Mar. Structures 49, 206–223. doi:10.1016/j.marstruc.2016.08.001
Eickhoff, W., and Ulrich, R. (1981). Optical Frequency Domain Reflectometry in Single‐mode Fiber. Appl. Phys. Lett. 39, 693–695. doi:10.1063/1.92872
Feng, W.-Q., Yin, J.-H., Borana, L., Qin, J.-Q., Wu, P.-C., and Yang, J.-L. (2019). A Network Theory for BOTDA Measurement of Deformations of Geotechnical Structures and Error Analysis. Measurement 146, 618–627. doi:10.1016/j.measurement.2019.07.010
Gao, L., Gong, Y., Liu, H., Ji, B., Xuan, Y., and Ma, Y. (2018). Experiment and Numerical Study on Deformation Measurement of Cast-In-Place Concrete Large-Diameter Pipe Pile Using Optical Frequency Domain Reflectometer Technology. Appl. Sci. 8, 1450. doi:10.3390/app8091450
Gautam, A., Kumar, A., Singh, R. R., and Priye, V. (2016). Optical Sensing and Monitoring Architecture for Pipelines Using Optical Heterodyning and FBG Filter. Optik 127 (20), 9161–9166. doi:10.1016/j.ijleo.2016.06.133
He, Y., Hernández, I. D., Vaz, M. A., and Caire, M. (2020a). Estimation of Flexible Riser Curvature Distribution and bend Stiffener Polyurethane Behavior Using the Levenberg-Marquardt Algorithm in Full Scale Bending-Tension Tests. Ocean Eng. 216, 108018. doi:10.1016/j.oceaneng.2020.108018
He, Y., Vaz, M. A., and Caire, M. (2020b). Flexible Riser-bend Stiffener Top Connection Analytical Model with I-Tube, Mar. Structures 71, 102707. doi:10.1016/j.marstruc.2020.102707
Inaudi, D., and Glisic, B. (2010). Long-range Pipeline Monitoring by Distributed Fiber Optic Sensing. J. Press. Vessel Technol.-Trans. ASME 132 (0117011). doi:10.1115/1.3062942
Jia, Z., Wang, Z., Sun, W., and Li, Z. (2019). Pipeline Leakage Localization Based on Distributed FBG Hoop Strain Measurements and Support Vector Machine. Optik 176, 1–13. doi:10.1016/j.ijleo.2018.09.048
Leroy, J.-M., and Estrier, P. (2001). Calculation of Stresses and Slips in Helical Layers of Dynamically Bent Flexible Pipes. Oil Gas Sci. Tech. - Rev. IFP 56 (6), 545–554. doi:10.2516/ogst:2001044
Li, B., Wang, H., Shen, X., Yang, D., Jiang, S., and Xu, L. (2011). Research on Strain Measurement of Abyssal Riser with FBG Sensors[M]. Berlin, Heidelberg: Springer, 505–512. doi:10.1007/978-3-642-25553-3_62
Li, H.-N., Yi, T.-H., Ren, L., Li, D.-S., and Huo, L.-S. (2014). Reviews on Innovations and Applications in Structural Health Monitoring for Infrastructures. Struct. Monit. Maintenance 1 (1), 1–45. doi:10.12989/smm.2014.1.1.001
Matveenko, V. P., Kosheleva, N. A., Shardakov, I. N., and Voronkov, A. A. (2018). Temperature and Strain Registration by Fibre-Optic Strain Sensor in the Polymer Composite Materials Manufacturing[J]. Int. J. Smart Nano Mater. 9 (2), 99–110. doi:10.1080/19475411.2018.1450791
Moffat, R., Sotomayor, J., and Beltrán, J. F. (2015). Estimating Tunnel wall Displacements Using a Simple Sensor Based on a Brillouin Optical Time Domain Reflectometer Apparatus. Int. J. Rock Mech. Mining Sci. 75, 233–243. doi:10.1016/j.ijrmms.2014.10.013
Ren, L., Jia, Z.-g., Li, H.-n., and Song, G. (2014). Design and Experimental Study on FBG Hoop-Strain Sensor in Pipeline Monitoring. Opt. Fiber Tech. 20 (1), 15–23. doi:10.1016/j.yofte.2013.11.004
Ren, L., Jiang, T., Jia, Z.-g., Li, D.-s., Yuan, C.-l., and Li, H.-n. (2018). Pipeline Corrosion and Leakage Monitoring Based on the Distributed Optical Fiber Sensing Technology. MEASUREMENT 122, 57–65. doi:10.1016/j.measurement.2018.03.018
Ruan, W., Bai, Y., and Yuan, S. (2017). Dynamic Analysis of Unbonded Flexible Pipe with bend Stiffener Constraint and Bending Hysteretic Behavior. Ocean Eng. 130, 583–596. doi:10.1016/j.oceaneng.2016.12.019
Tang, M., Yan, J., Chen, J., Yang, Z., and Yue, Q. (2015). Nonlinear Analysis and Multi-Objective Optimization for bend Stiffeners of Flexible Riser. J. Mar. Sci. Technol. 20 (4), 591–603. doi:10.1007/s00773-015-0314-5
Vaz, M. A., de Lemos, C. A. D., and Caire, M. (2007). A Nonlinear Analysis Formulation for Bend Stiffeners. J. Ship Res. 51 (3), 250–258. doi:10.5957/jsr.2007.51.3.250
Keywords: optic fiber sensor, curvature, dynamic umbilicals, bend stiffener, prototype fatigue test
Citation: Yin Y, Yu P, Jia Z, Wu S, Lu Q, Yan J and Yue Q (2021) An Approach of the Maximum Curvature Measurement of Dynamic Umbilicals Using OFDR Technology in Fatigue Tests. Front. Mater. 8:717190. doi: 10.3389/fmats.2021.717190
Received: 30 May 2021; Accepted: 01 July 2021;
Published: 30 July 2021.
Edited by:
Yunlai Zhou, Universidade Lusófona, PortugalReviewed by:
Nicholas Fantuzzi, University of Bologna, ItalyWei Chai, Wuhan University of Technology, China
Copyright © 2021 Yin, Yu, Jia, Wu, Lu, Yan and Yue. This is an open-access article distributed under the terms of the Creative Commons Attribution License (CC BY). The use, distribution or reproduction in other forums is permitted, provided the original author(s) and the copyright owner(s) are credited and that the original publication in this journal is cited, in accordance with accepted academic practice. No use, distribution or reproduction is permitted which does not comply with these terms.
*Correspondence: Qingzhen Lu, bHVxaW5nemhlbkBkbHV0LmVkdS5jbg==