 Mauro E. Ferreira
 Petrus Christiaan Pistorius
 Richard J. Fruehan
- Center for Iron and Steelmaking Research, Department of Materials Science and Engineering, Carnegie Mellon University, Pittsburgh, PA, United States
This work addresses conflicting results in the literature regarding liquid inclusion agglomeration. To assess whether liquid calcium aluminates do agglomerate in liquid steel, laboratory experiments were performed: melting electrolytic iron, deoxidizing the melt with aluminum and subsequently calcium treating the deoxidation products (alumina and magnesia-alumina spinel inclusions). Under laboratory conditions, solid spinels and alumina inclusions were successfully modified, producing a new population of much smaller calcium aluminate inclusions. The new population of inclusions forms because the presence of calcium in the liquid steel destabilizes alumina and MgO-alumina inclusions, which then dissolve into the melt. The liquid inclusions exhibited a weak but statistically significant tendency to agglomerate. Laboratory results were assessed in the light of different collision mechanisms. Agglomeration mainly occurs by Stokes and laminar fluid flow collision when no external stirring is imposed. Monte Carlo simulations of collisions agree reasonably well with experimental results. For industrial conditions, where the liquid steel is agitated by argon bubbling and/or electromagnetic stirring, turbulent collisions dominate.
Introduction
Calcium treatment of aluminum-killed steels is a common steelmaking practice, modifying solid non-metallic oxide inclusions (alumina and magnesia-alumina spinels) into liquid calcium aluminates. Modifying solid alumina and spinel into liquid calcium aluminate has the benefits of improved castability, fewer surface defects and minimized susceptibility of high strength low-alloy pipe steels to hydrogen-induced cracking (HIC) (Turkdogan, 1996).
Verma et al. (2011) studied the early stages of calcium modification and found that initially CaS is the main reaction product (if the steel contains more than approximately 10 ppm S). The CaS was found to be attached to alumina/spinel inclusions; subsequently sulfur diffuses out into the steel and liquid/partially liquid CaO.xAl2O3 is formed.
When studying and controlling nonmetallic inclusions (NMIs) in steel, the size distribution of inclusions is an important aspect of steel cleanliness. Although small (<1 μm), well-distributed inclusions throughout the solid steel can be useful in tailoring microstructure, NMIs are generally harmful to the quality of the final product, in addition to causing problems during processing (like caster nozzle clogging). Large inclusions (>20 μm) can lead to catastrophic failures due to their influence on toughness (Anderson et al., 2000).
Yin et al. (1997b) first reported agglomeration of inclusions on the surface of liquid steel, as observed in a confocal scanning laser microscope (CSLM). Alumina and alumina-rich solid inclusion particles agglomerate, driven by the capillarity effect around solid oxides on the molten steel surface (Yin et al., 1997b). In industrial steel processing, capillarity-driven agglomeration would only occur where interfaces are available, e.g., steel/slag, steel/gas, and slag/gas.
The same researchers found that such capillarity attraction does not occur between liquid CaO-Al2O3-SiO2 inclusions on the surface of liquid steel (Yin et al., 1997a). Another study carried out by Coletti et al. with similar setup observed the same lack of attraction (Coletti et al., 2003). Ohta and Suito (2006) studied the effect of dissolved oxygen and particle size distribution on particle coarsening for a series of deoxidation products. The authors’ findings agreed with what was observed in the confocal microscope, i.e., liquid CaO-Al2O3 particles did not change their average size with time (Ohta and Suito, 2006). This contrasts with the results of Verma et al. (2012), who found a shift of the liquid calcium aluminate distribution to larger sizes in fully modified (tundish) steel samples, compared with unmodified or partially modified (solid) inclusions in preceding ladle samples.
Even though reactions involving calcium treatment of steels have been widely studied, it appears that no work has been done so far to explain how the size of liquid or partially liquid calcium aluminates changes within liquid steel after calcium modification. As noted above, inconsistent conclusions on whether these inclusions agglomerate within liquid steel have been reported in the literature. The aim of this work is to address whether liquid calcium aluminates agglomerate and the main mechanisms by which liquid inclusions collide and agglomerate.
Materials and Methods
Two experiments (A and B) were conducted to assess whether liquid calcium aluminates agglomerate in liquid steel. The experiments were conducted using a 10 kW induction furnace (Figure 1), in an atmosphere of purified argon. The experiments involved heating and melting 600 g of electrolytic iron (containing less than 10 ppm sulfur by mass), in an alumina or magnesia crucible. When the temperature reached 1,600 °C, approximately 0.6 g of pure aluminum shot (99.9% purity) was added into the melt. The aimed total aluminum concentration after deoxidation and flotation of most of the deoxidation products was 0.04%wt. Formation of Al2O3 is highly exothermic and a temperature rise (of approximately 10°C) was an indication that deoxidation had taken place. Once the temperature returned to 1,600°C, a fused-quartz tube (4 mm ID, 6 mm OD) was inserted into the melt to take a sample (using a pipette pump).
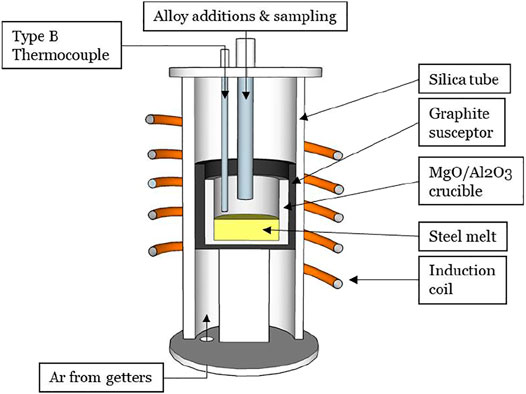
FIGURE 1. Simplified diagram of the induction furnace used for experiments.
After sampling the steel, approximately 1.0 g CaSi2 (previously wrapped in iron foil), was rapidly added (in less than 2 s) by pushing it into the melt with an alumina rod. Such rapid addition was important to minimize vaporization losses of calcium, to improve calcium yield. The typical calcium yield was approximately 1%. The difference between experiments A and B is that A was conducted in an alumina crucible whereas B used an MgO crucible. The difference in crucible material yielded two different inclusion types before calcium treatment: Experiment A was expected to contain alumina inclusions only, since no magnesium source existed in this experiment, whereas spinel inclusions were expected in Experiment B.
To analyze inclusion composition and size, two scanning electron microscopes (SEM) were used in this work. The SEMs were used to perform manual imaging and analysis, as well automated feature analysis (AFA). The majority of the analyses were conducted using an FEI ASPEX Explorer, which uses a tungsten filament source, and has a spatial resolution of approximately 0.3 µm for backscattered electron imaging. Samples taken shortly after calcium treatment were also analyzed using an FEI Quanta 600 with a field-emission gun source (and hence better resolution). INCA Feature software was used with the Quanta 600 for automated inclusion analysis. Detailed explanation of SEM conditions for automated inclusion analysis can be found elsewhere (Tang et al., 2017). The main settings are summarized in Table 1.
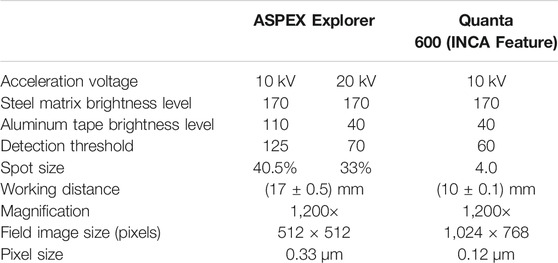
TABLE 1. SEM settings for automated inclusion analysis (AFA).
The ASPEX Explorer software did not include calibrations for analyses at 10kV. Instead, all analyses performed at 10 kV were converted to composition by using the Merlet phi-rho-z algorithm (Merlet, 1993; Merlet, 1994).
Since each set of analyses generated thousands of measurements, representing the distribution of compositions can be challenging. Useful information can be hidden since overplotting of analyses on a composition diagram is inevitable. Abdulsalam et al. (2018) illustrated how one can be misled by overplotting individual inclusion compositions on a ternary composition diagram instead of grouping and representing an inclusion population proportional to its number or area fraction. This work followed this method to represent the distribution of inclusion compositions in ternary diagrams, unless otherwise noted.
The size distribution of the inclusion population after deoxidation is the result of a combination of processes of nucleation, growth and removal (van Ende et al., 2013). The size distribution of inclusions in steels is often found to have a lognormal form (Anderson et al., 2000) and the inclusion sizes in different steels can be distinguished by comparing the mean and standard deviation of the log-normal distribution (Navidi, 2008).
Results and Discussion
Inclusion Compositions and Size Distributions
Figure 2 shows the inclusion composition in samples taken prior to calcium treatment in experiments A (left) and B (right). Compositions are plotted as mole fractions, with the size of the triangle proportional to the area fraction of inclusions with that composition. The thin grey line indicates the boundary of CaO-MgO-Al2O3 mixtures that would be 50% liquid at 1,550°C. As expected, experiment A formed only alumina inclusions whereas the MgO crucible of experiment B served as a source of magnesium, modifying the alumina deoxidation products to spinels.
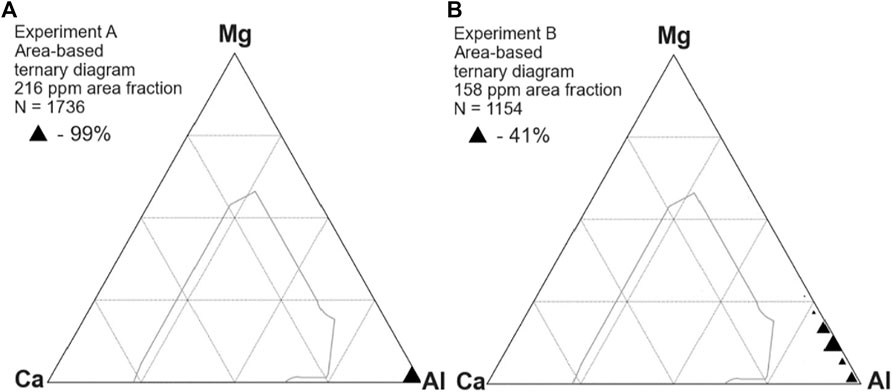
FIGURE 2. Composition of inclusions before Ca treatment, showing alumina in experiment A (A) and alumina-spinel inclusions in experiment B (B).
Calcium treatment fully modified the inclusions, changing the composition to lie within the 50% liquid boundary (Figure 3). For brevity, only one ternary diagram is shown here for samples taken after calcium treatment, and Figure 4 presents a boxplot of the Ca/Al ratio of inclusions in all samples taken after calcium treatment. Each dashed line represents the stoichiometric ratio of a stable calcium aluminate in the CaO-Al2O3 phase diagram, including
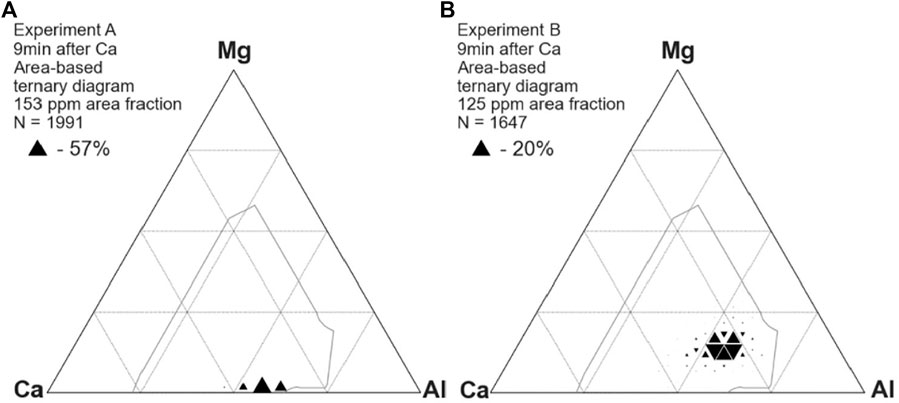
FIGURE 3. Compositions of inclusions from experiments A (A) and B (B) after calcium treatment, showing fully modified calcium aluminates.
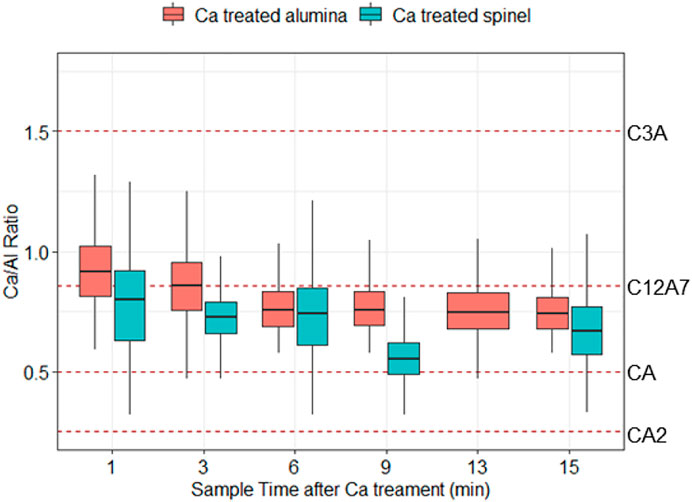
FIGURE 4. Molar ratios of calcium to aluminum in inclusions after calcium treatment for experiments A (“Ca treated alumina”) and B (“Ca treated spinel”). The dashed lines indicate the stoichiometric ratios of CaO-Al2O3 compounds found in the CaO-Al2O3 phase diagram.
In both experiments, apparent inclusion diameters (as observed on the two-dimensional sample surface) roughly followed lognormal distributions (Figure 5). (The ridgeline plots in Figure 5 are partially overlapping histograms that create the impression of a mountain range; this type of visualization is useful to observe changes in size distributions over time.)
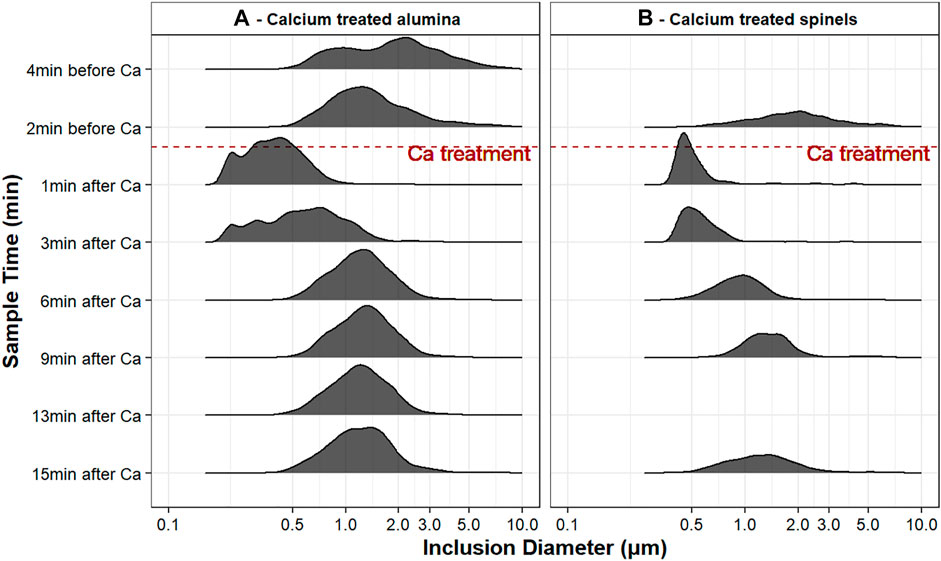
FIGURE 5. Ridgeline plot of inclusion size distributions for both experiments, in samples taken at different times; note that the inclusion diameter is on a logarithmic scale.
Figure 5A shows the inclusion size distributions of experiment A. Both samples taken before calcium treatment contained only solid alumina. However, the sample taken 2 minutes before calcium treatment (sample A2) showed almost twice the inclusion concentration (and had generally smaller inclusions) than that taken 4 minutes before calcium treatment (sample A1). The increase in inclusion concentration appears to have been caused by reoxidation of sample A2. Population density function (PDF) plots are useful for testing whether the difference in average inclusion size in samples A1 and A2 could have been caused by reoxidation of sample A2 (van Ende et al., 2013). The PDF plots in Figure 6 are a straight line for sample A1 (indicating size-independent inclusion growth), and more parabolic for sample A2, consistent with formation of a new population of alumina inclusion by reoxidation of sample A2 (van Ende et al., 2011).
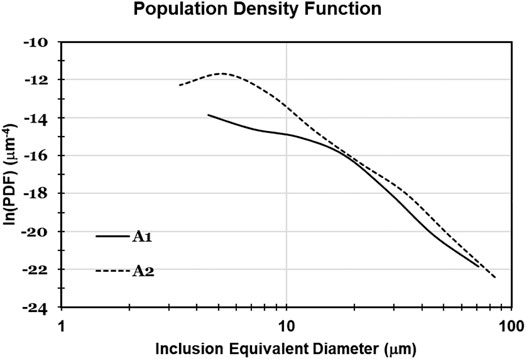
FIGURE 6. Population density function of inclusions in samples taken 4 minutes before calcium treatment (A1) and 2 minutes before calcium treatment (A2), in experiment A.
Table 2 shows the chemical analysis (by optical emission spectrometry) of the steel puck that remained in the crucible after each experiment. The analyses are similar for the two experiments and indicate approximately 100% yield of Si (from calcium disilicide) and approximately 1% Ca yield.
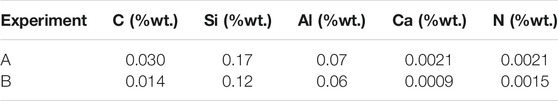
TABLE 2. Concentration of elements of interest in the steel puck after each experiment.
For calcium-treated samples, the size distributions in Figure 5 are those of all inclusions that fell within the 50% liquid boundary shown in Figure 3: mainly solid inclusions are excluded from the plot, to be able to test whether liquid inclusions agglomerate. Although the lognormal fit was not good for some samples, the shapes of the distributions are all roughly lognormal, and all samples were considered to follow this distribution for comparison of average inclusion sizes.
For both experiments, a sharp decrease in inclusion size was observed upon calcium treatment, compared with inclusions in the samples taken before calcium treatment. This is difference is better visualized in Figure 7, which shows an interval plot of the change in average inclusion size over time. The average inclusion size was approximately
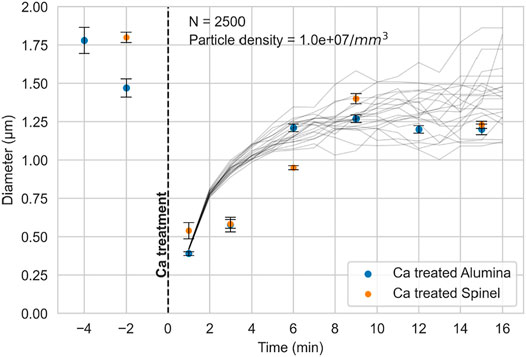
FIGURE 7. Interval plot of inclusion size for both experiments. The black lines represent the Monte Carlo simulations of inclusion growth by collision, for conditions as indicated in the plot.
Inclusion Collision and Flotation
To identify the main mechanism by which the liquid calcium aluminates collide and grow, the mechanisms described by Lei and He (2012) and Söder et al. (2004) were evaluated. Figure 8 shows the collision volumes for inclusions with diameters of 1, 5 or 10 μm.
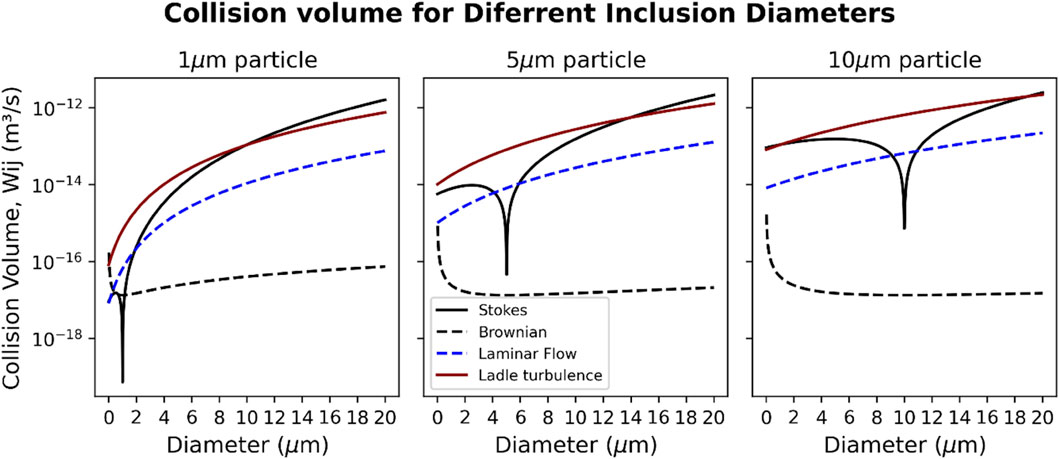
FIGURE 8. Collision volumes for spherical inclusions (diameters 1, 5 and 10 µm), for different collision mechanisms.
The collision volume gives the rate at which an inclusion with a given diameter collides with inclusions of other sizes, depending on the concentration of the inclusions. If the efficiency of collisions is assumed to be 100% (all collisions lead to agglomeration) the resulting change in the concentration of particles
The first term in this equation gives the rate at which inclusions consisting of
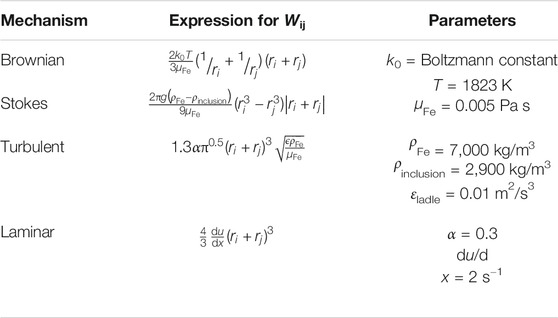
TABLE 3. Expressions for collision volumes (Söder et al. (2004). The sources of specific parameters are as follows: εladle and α (Taniguchi and Kikuchi (1992); du/dx (Piva, 2018).
For a gas-stirred industrial ladle, turbulence is the main inclusion collision mechanism (shown in red in Figure 8). In the case of the induction furnace, the red curve is not applicable, since no external agitation is present. Rather, Stokes collision and laminar-flow collisions (indicated by the line labeled “Laminar Flow”) are the main mechanisms. For 5–10 µm inclusions, the rates of Brownian collision are generally much lower than the other mechanisms. For a smaller (1 µm) inclusion, the collision volume with other small inclusions
Using the literature expressions for the collision volumes (Lei and He, 2012; Söder et al., 2004), the change in average inclusion volume was calculated for induction-furnace conditions, using Monte Carlo simulations. The input parameters to the simulation are the parameters of the lognormal size distribution, the initial number of inclusions per unit volume of steel (concentration), and the time constant for inclusion flotation. The time constant for flotation is taken to be equal to the depth of steel (in the crucible), divided by the mass transfer coefficient in the steel.
An initial number of inclusions is chosen, with sizes randomly following the lognormal distribution. The simulated sub-volume of steel is calculated based on the initial number of inclusions, and the initial inclusion concentration. In each time step, the following are evaluated:
For each inclusion, its collision rate with every other inclusion (by the Stokes, Brownian and turbulent mechanisms) is calculated. Each pair of inclusions is allowed to agglomerate randomly with a probability that is proportional to the length of the time step and the calculated collision rate for that pair, taking the collision efficiency to be unity. If a pair of inclusions collides and hence agglomerates, the new inclusion size is calculated based on the assumption of spherical shape. In addition, each inclusion is also allowed to float out randomly, with a probability of flotation equal to the length of the time step divided by the time constant for flotation.
The simulation is very sensitive to the initial inclusion size distribution and the inclusion concentration (number of inclusions per unit volume). Ten simulations were performed, considering an initial number of 2,500 inclusions, with a lognormal size distribution based on the measured sizes in the sample taken 1 minute after calcium treatment. The parameters of the lognormal distribution were as follows: location (
It was assumed that inclusions remained spherical throughout. Following each time step, the sizes of all inclusions were recalculated, to serve as input to the calculated collision rate in the next time step. Piva et al. (2019) used a similar approach and concluded that Monte Carlo simulations for inclusion growth by collision validated their experimental work. Results of simulated inclusions sizes are shown in Figure 7. Each black line in Figure 7 is the result of an individual simulation based on Smoluchowski’s approach; the trends can be seen to similar to those of the experimental data.
Inclusion Size Decrease After Calcium Treatment and Calcium Transfer Mechanism
As shown in Figure 7, the measured diameter of calcium-treated inclusions was 3.5 times smaller than prior to calcium treatment. Moreover, the reaction with calcium was rapid and even shortly after calcium addition, almost no solid inclusions could be observed. The sharp decrease in inclusion size is consistent with the formation of a new population of calcium aluminate inclusions upon addition of calcium, and dissolution of the pre-existing alumina or spinel inclusions (Piva and Pistorius, 2021). The activity of dissolved oxygen in the vicinity of the calcium aluminates would be much lower than adjacent to alumina or spinel inclusions (because of the much lower activity of alumina in calcium aluminates). The decrease in oxygen activity following calcium treatment destabilizes alumina and spinel inclusions, causing their dissolution. This mechanism implies that calcium treatment of alumina or spinel inclusions involves dissolution of alumina and spinel, following formation of a new population of calcium aluminates.
The decrease in inclusion size was even larger than indicated by Figure 7, because many inclusions (in the samples taken immediate after calcium treatment) were too small to be detected by backscattered electron imaging. This is indicated by the observation that in the samples taken immediately following calcium treatment, the measured area fraction of inclusions was much lower than expected; see Figure 9. This figure shows the measured area fractions of inclusions, with expected trends in inclusions concentration based on first-order kinetics of inclusion flotation. When using an instrument with improved spatial resolution (Quanta 600) the measured area fraction was larger (and within the expected range for samples taken 3 minutes or more after calcium addition). However, the low measured area fractions in the samples taken immediately after calcium addition indicate that many inclusions were too small to be detected.
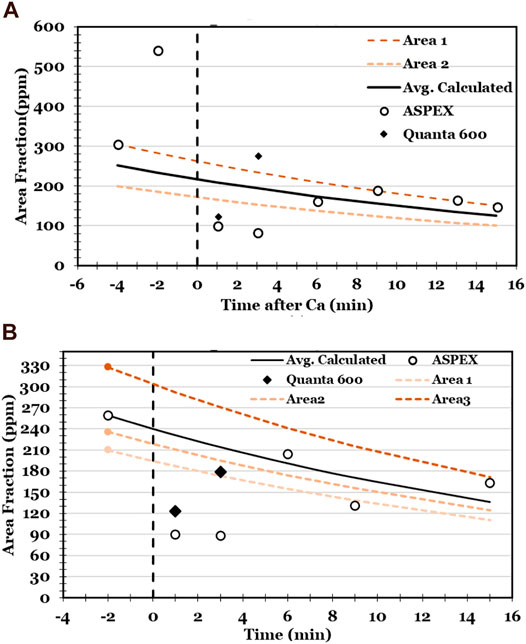
FIGURE 9. Measured inclusion area fractions in experiments A and B. “ASPEX” and “Quanta 600” indicate the SEM used in each analysis. The lines give expected inclusion flotation trends.
The lines in Figure 9 were calculated based on the assumption of first-order kinetics of inclusion flotation (Schwerdtfeger, 1983), with the rate-limiting step being mass transfer of steel to the steel-argon interface. The lines were calculated based on a mass transfer coefficient of
Figure 9 shows that the measured decrease in inclusion area fraction broadly agrees with the expected area fraction. A notable exception is the much smaller than expected area fraction following calcium treatment (as already mentioned). Another is that the sample taken 2 min before calcium treatment in Experiment A had a much larger inclusion area fraction than expected, supporting the conclusion that this sample suffered reoxidation.
To test the idea that shortly after calcium treatment, a large number of small inclusions—below the instrument detection limit—are created, the sample taken 1 minute after Ca in experiment B was deep-etched. Electrolytic etching used a solution of acetylacetone (10%) and tetramethylammonium chloride (1%) in anhydrous methanol.
A representative SEM image in Figure 10 illustrates the profusion of small inclusions in the sample taken immediately after calcium treatment. Point analyses of the inclusions confirmed that these are calcium aluminates. Since the smaller inclusions are below the resolution limit of backscattered electron (BSE) images of polished cross-sections, these would not have been detected during automated inclusion analysis. Figure 10 includes (at right) simulated BSE images of inclusion cross-sections, based on the measured spatial resolution of the two SEMs (Tang et al., 2017). The simulated images are consistent with the suggestion that many smaller inclusions would not be detected during automated inclusion analyses.
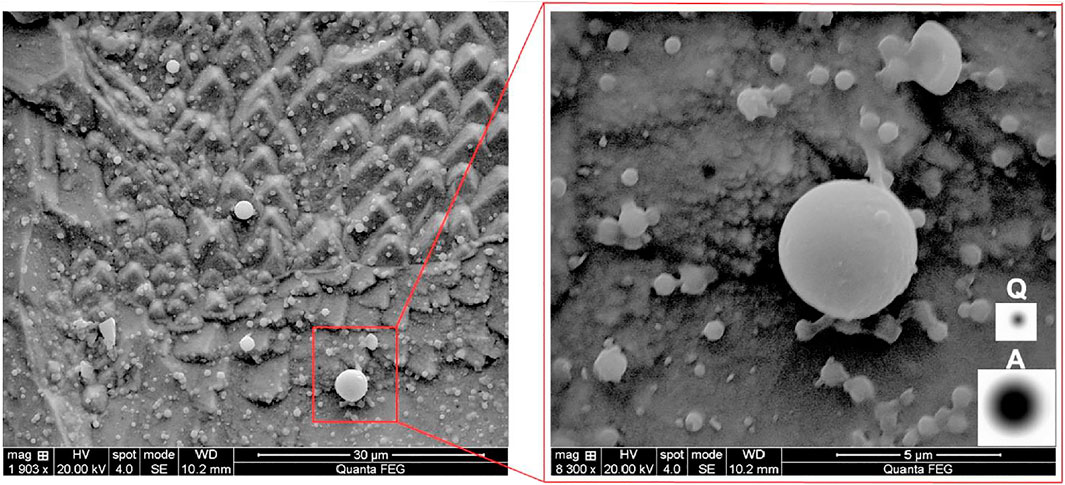
FIGURE 10. Secondary electron micrograph of sample taken 1 minute after calcium treatment in Experiment B, deep-etched to show small inclusions. The circles below the symbols “A” and “Q” are simulated backscattered electron micrographs of inclusions at the surface of polished samples, representing the spatial resolution in the ASPEX SEM (“A”) and Quanta 600 (“Q”).
In contrast, a sample taken 13 min after calcium treatment (Figure 11) did not contain sub-micron calcium aluminates, and the area fraction of inclusions fitted the expected trend (Figure 9). Agreement of the measured inclusion fraction with the fitted trend indicates that the calcium aluminates in this sample had grown sufficiently large to detected during automated inclusion analysis. The sub-micron inclusions were no longer present because the inclusions had agglomerated by collision, in line with the simulations shown in Figure 7.
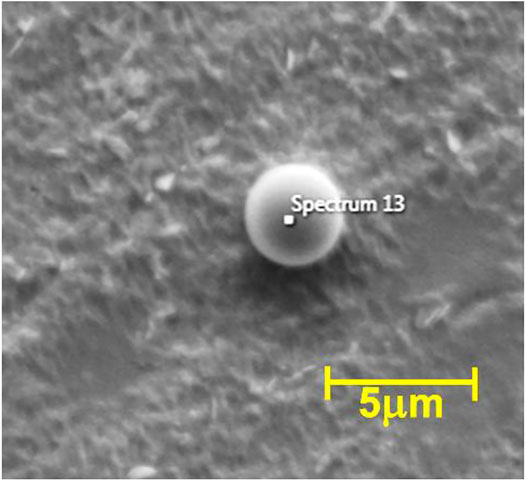
FIGURE 11. Micrograph of deep-etched sample taken 13 minutes after Ca treatment in experiment A, showing the absence of small inclusions.
Conclusion
The experimental results show clearly that liquid calcium aluminates do agglomerate and grow. Growth is fast immediately following calcium treatment, and then slows down. This slower growth would be difficult to observe in samples taken under industrial conditions (with a short period of ladle contact following calcium treatment), accounting for the previous conclusions that calcium aluminates do not agglomerate. Monte Carlo simulations broadly agree with the experimental data, indicating that the main mechanism by which liquid inclusions agglomerate under laboratory conditions is laminar collision and Stokes motion.
The observed decrease in inclusion size following calcium treatment is consistent with the proposed mechanism of calcium treatment: A new population of calcium aluminates forms upon calcium treatment, while the pre-existing alumina or spinel inclusions are destabilized and dissolve into the liquid steel.
Data Availability Statement
The datasets presented in this article are not readily available because experimental results are limited to members of the Center for Iron and Steelmaking Research. Requests to access the datasets should be directed to cGlzdG9yaXVzQGNtdS5lZHU=.
Author Contributions
The authors contributed equally to planning the experiment. MEF performed the experiments and inclusion analysis. PCP and RJF contributed to analyzing and interpreting the data. MEF drafted the manuscript, with editing input by PCP. PCP coded the initial version of the Monte Carlo simulation; simulations were performed by MJF.
Funding
Funding was provided by members of the Center for Iron and Steelmaking Research. The authors acknowledge the use of the Materials Characterization Facility at CMU supported by grant MCF-677785.
Conflict of Interest
The authors declare that the research was conducted in the absence of any commercial or financial relationships that could be construed as a potential conflict of interest.
Publisher’s Note
All claims expressed in this article are solely those of the authors and do not necessarily represent those of their affiliated organizations, or those of the publisher, the editors and the reviewers. Any product that may be evaluated in this article, or claim that may be made by its manufacturer, is not guaranteed or endorsed by the publisher.
Acknowledgments
The authors thank the industrial company members of the Center for Iron and Steelmaking Research at Carnegie Mellon University for both financial and technical collaboration for this work.
References
Abdulsalam, M., Zhang, T., Tan, J., and Webler, B. A. (2018). Automated Classification and Analysis of Non-metallic Inclusion Data Sets. Metall. Materi Trans. B. 49, 1568–1579. doi:10.1007/s11663-018-1276-x
Anderson, C. W., Shi, G., Atkinson, H. V., and Sellars, C. M. (2000). The Precision of Methods Using the Statistics of Extremes for the Estimation of the Maximum Size of Inclusions in Clean Steels. Acta. Mater. 48, 4235–4246. doi:10.1016/S1359-6454(00)00281-0
Coletti, B., Blanpain, B., Vantilt, S., and Sridhar, S. (2003). Observation of Calcium Aluminate Inclusions at Interfaces between Ca-Treated, Al-Killed Steels and Slags. Metall. Materi Trans. B. 34, 533–538. doi:10.1007/s11663-003-0021-1
Higgins, M. D. (2002). Closure in Crystal Size Distributions (CSD), Verification of CSD Calculations, and the Significance of CSD Fans. Am. Mineral. 87, 171–175. doi:10.2138/am-2002-0118
Higgins, M. D. (2000). Measurement of Crystal Size Distributions. Am. Mineral. 85, 1105–1116. doi:10.2138/am-2000-8-901
Lei, H., and He, J. (2012). Nucleation and Growth Kinetics of MgO in Molten Steel. J. Mater. Sci. Tech. 28, 642–646. doi:10.1016/S1005-0302(12)60110-8
Merlet, C. (1994). An Accurate Computer Correction Program for Quantitative Electron Probe Microanalysis. Mikrochim Acta. 114-115, 363–376. doi:10.1007/bf01244563
Merlet, C. (1993). “Evaluation and Description of a New Correction Procedure for Quantitative Electron Probe Microanalysis,” in X-ray optics and microanalysis 1992. Proceedings of the Thirteenth International Congress, UMIST Manchester, UK, 31 August-4 September, 1992 (Bristol, UK: Institute of Physics), 123–126.
Ohta, H., and Suito, H. (2006). Effects of Dissolved Oxygen and Size Distribution on Particle Coarsening of Deoxidation Product. ISIJ Int. 46, 42–49. doi:10.2355/isijinternational.46.42
Piva, S., Ferreira, M., Kumar, D., and Pistorius, P. (2019). “A Study on the Effect of Fluid Flow into Non-metallic Inclusion Changes,” in Proceedings for the 8th International Conference on Modeling and Simulation of Metallurgical Processes in Steelmaking, STEELSIM 2019, Toronto, ON, Canada, 13–15 August 2019 (Warrendale, PA: AIST), 475–487. doi:10.33313/503/050
Piva, S. P. T. (2018). Non-metallic Inclusions Changes in Si-Mn Killed Steels. Pittsburgh, PA, USA: Ph.D. thesis, Carnegie Mellon University.
Piva, S. P. T., Kumar, D., and Pistorius, P. C. (2017). Modeling Manganese Silicate Inclusion Composition Changes during Ladle Treatment Using FactSage Macros. Metall. Materi Trans. B. 48, 37–45. doi:10.1007/s11663-016-0764-0
Piva, S. P. T., and Pistorius, P. C. (2021). Ferrosilicon-Based Calcium Treatment of Aluminum-Killed and Silicomanganese-Killed Steels. Metall. Mater. Trans. B. 52, 6–16. doi:10.1007/s11663-020-02017-1
Schwerdtfeger, K. (1983). Present State of Oxygen Control in Aluminum Deoxidized Steel. Archiv für das Eisenhüttenwesen. 54, 87–98. doi:10.1002/srin.198305204
Smoluchowski, M. (1917). Kinetics of the Coagulation of Colloidal Solutions. Zeitchrift für physikalische Chem. 92, 129–168.
Söder, M., Jönsson, P., and Jonsson, L. (2004). Inclusion Growth and Removal in Gas-Stirred Ladles. steel Res. Int. 75, 128–138. doi:10.1002/srin.200405938
Tang, D., Ferreira, M. E., and Pistorius, P. C. (2017). Automated Inclusion Microanalysis in Steel by Computer-Based Scanning Electron Microscopy: Accelerating Voltage, Backscattered Electron Image Quality, and Analysis Time. Microsc. Microanal. 23, 1082–1090. doi:10.1017/S1431927617012648
Taniguchi, S., and Kikuchi, A. (1992). Mechanisms of Collision and Coagulation between Fine Particles in Fluid. Tetsu-to-Hagane. 78, 527–535. doi:10.2355/tetsutohagane1955.78.4_527
Turkdogan, E. T. (1996). Fundamentals of Steelmaking. London: Institute of Materials. doi:10.1691/ph.2008.7308
van Ende, M.-A., Guo, M., Proost, J., Blanpain, B., and Wollants, P. (2011). Formation and Morphology of Al2O3 Inclusions at the Onset of Liquid Fe Deoxidation by Al Addition. ISIJ Int. 51, 27–34. doi:10.2355/isijinternational.51.27
van Ende, M.-A., Guo, M., Zinngrebe, E., Blanpain, B., and Jung, I.-H. (2013). Evolution of Non-metallic Inclusions in Secondary Steelmaking: Learning from Inclusion Size Distributions. ISIJ Int. 53, 1974–1982. doi:10.2355/isijinternational.53.1974
Verma, N., Pistorius, P. C., Fruehan, R. J., Potter, M., Lind, M., and Story, S. (2011). Transient Inclusion Evolution during Modification of Alumina Inclusions by Calcium in Liquid Steel: Part I. Background, Experimental Techniques and Analysis Methods. Metall. Materi Trans. B. 42, 711–719. doi:10.1007/s11663-011-9516-3
Verma, N., Pistorius, P. C., Fruehan, R. J., Potter, M. S., Oltmann, H. G., and Pretorius, E. B. (2012). Calcium Modification of Spinel Inclusions in Aluminum-Killed Steel: Reaction Steps. Metall. Materi Trans. B. 43, 830–840. doi:10.1007/s11663-012-9660-4
Yin, H., Shibata, H., Emi, T., and Suzuki, M. (1997b). "In-situ" Observation of Collision, Agglomeration and Cluster Formation of Alumina Inclusion Particles on Steel Melts. ISIJ Int. 37, 936–945. doi:10.2355/isijinternational.37.936
Keywords: nonmetallic inclusions., size distributions, scanning electron microscopy, Monte Carlo simulation, calcium treatment
Citation: Ferreira ME, Pistorius PC and Fruehan RJ (2021) Liquid Inclusion Collision and Agglomeration in Calcium-Treated Aluminum-Killed Steel. Front. Mater. 8:736807. doi: 10.3389/fmats.2021.736807
Received: 05 July 2021; Accepted: 28 July 2021;
Published: 11 August 2021.
Edited by:
Susanne K. Michelic, University of Leoben, AustriaReviewed by:
Neslihan Dogan, McMaster University, CanadaSheng Lu, Jiangsu University of Science and Technology, China
Copyright © 2021 Ferreira, Pistorius and Fruehan. This is an open-access article distributed under the terms of the Creative Commons Attribution License (CC BY). The use, distribution or reproduction in other forums is permitted, provided the original author(s) and the copyright owner(s) are credited and that the original publication in this journal is cited, in accordance with accepted academic practice. No use, distribution or reproduction is permitted which does not comply with these terms.
*Correspondence: Petrus Christiaan Pistorius, cGlzdG9yaXVzQGNtdS5lZHU=