 Morteza Beyranvand
 Ahmad Gholizadeh
- School of Physics, Damghan University, Damghan, Iran
The microstructure, optical, and magnetic properties of CdxMg0.3-xCu0.2Zn0.5Fe2O4 ferrites prepared by the citrate auto-combustion method were investigated. The samples were analyzed by X-ray diffraction, scanning electron microscopy, UV-Vis spectroscopy, https://soh.iums.ac.ir/uploads/uv-vis_-_2.pptx X-ray energy-dispersive spectroscopy, Fourier-transform infrared spectroscopy, and vibrating sample magnetometer. Rietveld refinement of XRD patterns shows a single-phase cubic structure (space group Fd
Introduction
Magnetism and magnetic materials have attracted enormous interest since the discovery of the phenomenon of giant magnetic resistance (GMR) in multilayer structures. In these structures, the ferromagnetic layer is coupled to a magnetic metallic layer with 1–3 nm thick (Mollamahaleh et al., 2011; T. Rahal et al., 2017). With the advent of magnetic nanotechnology, small magnetic materials are made with improved magnetic properties (Navaei Diva et al., 2017). The main applications of magnetic nanomaterials are using in the construction of data storage mediums, small electric motors, and magnetic nanofluids (Noori and Gholizadeh, 2019; Esmaili and Gholizadeh, 2020). Nowadays, the most common use of magnetic nanomaterial is related to magnetic nano-powders, because by decreasing the dimensions of the powder particles, the quality of the magnetic devices also improves (Chen and He, 2001; Son et al., 2002). The industrialization of countries has led to the increasing extraction of hazardous heavy metals such as lead, Mercury, and arsenic. As a result, the production of metal superparamagnetic particles from iron oxide nanoparticles to adsorb these heavy metals using their magnetic properties has been considered (Chen et al., 2003; Noori and Gholizadeh, 2019). The optimal properties of magnetic nanostructures are high mechanical strength, high permeability, low core loss (up to about 25% of normal values), high saturation magnetization (Ms), excellent temperature stability, etc. (Gopal Reddy et al., 1999; El-Kemary et al., 2013). Among different spinel ferrites reported in literature, the spinel ferrite nanoparticles have been the subject of nanotechnology researchers due to their unique properties. Spinel ferrites have the general formula [M2+] [Fe3+] O4, in which M is the divalent metal cations such as Zn, Ni, Mn, Cu, etc. (Manikandan et al., 2014). Structural, magnetic, electrical, and catalytic properties of spinel ferrites depend on ionic radii and their distribution on the octahedral (B) and tetrahedral (A) sites of the spinel structure (Manikandan et al., 2013a).
In a spinel structure, the B site is larger than the A site. Bivalent ions are larger than trivalent ions, so it is reasonable that, divalent ions are in the B sites and trivalent ions are in the A sites. But there is an exception in zinc ferrite (ZnFe2O4) that larger divalent ions tend to occupy the A sites because their electronic arrangements are more suitable for A-site binding to lattice oxygen ions (Gill and Puri, 1985; El-Sayed, 2002; Manikandan et al., 2013b). The zinc ferrite is a semiconductor material with a high electrical resistance that does not conduct DC (Manikandan et al., 2013b). ZnFe2O4 is used for many applications, such as catalytic and photocatalytic activity (Manikandan et al., 2014), magnetic resonance imaging, and ferrofluids (Abareshi et al., 2010; Manikandan et al., 2013c). In Zn1-xCuxFe2O4 nanoparticles, a part of the Cu2+and Zn2+ions occupy the B sites and some of the smaller Fe3+ ions may be distributed in the A sites instead of the larger Cu2+ and Zn2+ ions (Banerjee et al., 2007; Ajmal and Maqsood, 2008).
Previous studies on MgxMn0.3-xCu0.2Zn0.5Fe3O4 nanoparticles prepared by the citrate auto-combustion method show Mg+2 ions can be substituted in the A- and B-sites, but preferably tend to occupy the A site, while Fe+3 ions occupy both the sites (Shamgani and Gholizadeh, 2019). Manganese also had a strong tendency to occupy both the sites. In Ni-Cu-Zn ferrite nanoparticles, the nickel ion only tends to occupy the B site, while the Cu+2 occupy both the A and B sites. (Gholizadeh and Jafari, 2017). substituting the Cu+2 ions for Ni+2 at the B site, resulted in a decrease of the Ms. In addition, the results showed that the conclusion of the random distribution of the cations in both the A and B sites, the amount of magnetization in these two sites was subject to change. Studies showed that Mg+2 ions can be substituted on the A and B sites in Mg0.3-xBaxCu0.2Zn0.5Fe3O4, ferrite, but preferably tend to occupy the A sites and, Fe+3 ions are on both the sites (Gholizadeh and Beyranvand, 2020). Because the ionic radius of Ba+2 is larger than the other divalent cations in the A and B sites, it is expected that Ba+2 will sit more in the B site. Also, studies on Mn0.3-xCdxCu0.2Zn0.5Fe3O4 nanoparticles showed that Mn+2 and Fe+3 ions can occupy both the A and B sites (Beyranvand and Gholizadeh, 2020). Since the ionic radius of Cd+2 is greater than the other divalent cations in the A and B sites, it is expected that cadmium ions will occupy the B site. In this paper, the aim is to discuss the structural, optical and magnetic properties of Mg0.30-xCdxCu0.2Zn0.5Fe2O4 spinel ferrites with x = 0.00, 0.05, 0.10, 0.15, 0.20, 0.25, 0.30.
Experimental
Preparation of CdxMg0.3-xCu0.2Zn0.5Fe2O4 Ferrites
First, the appropriate mole of Mg(NO3)2·4H2O, Cd(NO3)2.4H2O, Cu(NO3)2·3H2O, Zn(NO3)2·4H2O, Fe(NO3)3·9H2O according to Table 1, with citric acid (1:1 mole ratio), was completely dissolved with a minimum of water and its pH value noted as 2 (Gholizadeh, 2017b; Gholizadeh and Malekzadeh, 2017; Gholizadeh, 2019). Then, the resulted solution was put in an oven for 24 h at 80°C and kept until complete drying. After that, the dried materials were powdered and finally calcined at 500°C for 3 h.
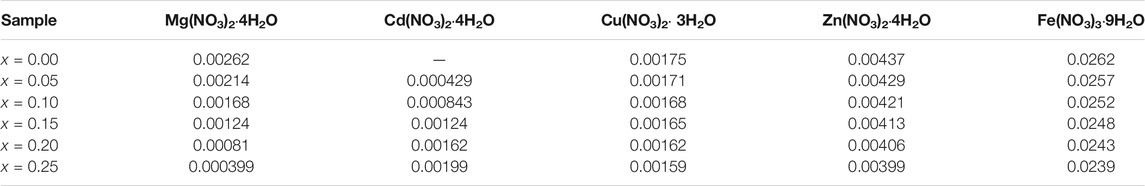
TABLE 1. Moles of the metal nitrates to prepare the Mg0.3-xCdxCu0.2Zn0.5Fe2O4.
Characterization of the Samples
X-ray diffraction patterns (XRD) of the powders were recorded using Bruker’s Advanced-8D at room temperature (RT) in the range of 2θ = 20–80°. XRD device was equipped with a Cu-Kα (λ = 1.5404 Å) radiation source and a nickel filter (35 mA, 30 kV). Fourier-transform infrared (FTIR) spectra of the samples were measured with Perkin-Elmer device at RT. The crystal structure and lattice parameters were determined by a Rietveld method using the Fullprof program. Halder-Wagner (H-W) method was employed for calculating the crystallite size (D) and microstrain (ε) of the samples (Gholizadeh et al., 2016):
where,
Results and Discussion
Structural Features
XRD pattern of CdxMg0.3-xCu0.2Zn0.5Fe2O4 nanoparticles are shown in Figure 1. The Miller indices (hkl) of the spinel phase are labeled on the diffraction peaks in Figure 1, which corresponds to the (220), (311), (222), (400), (422), (511), (440) planes. Structural analysis of samples x = 0.00, 0.05, 0.10, 0.15, 0.20, using X’pert package indicates the formation of a pure cubic spinel structure with Fd
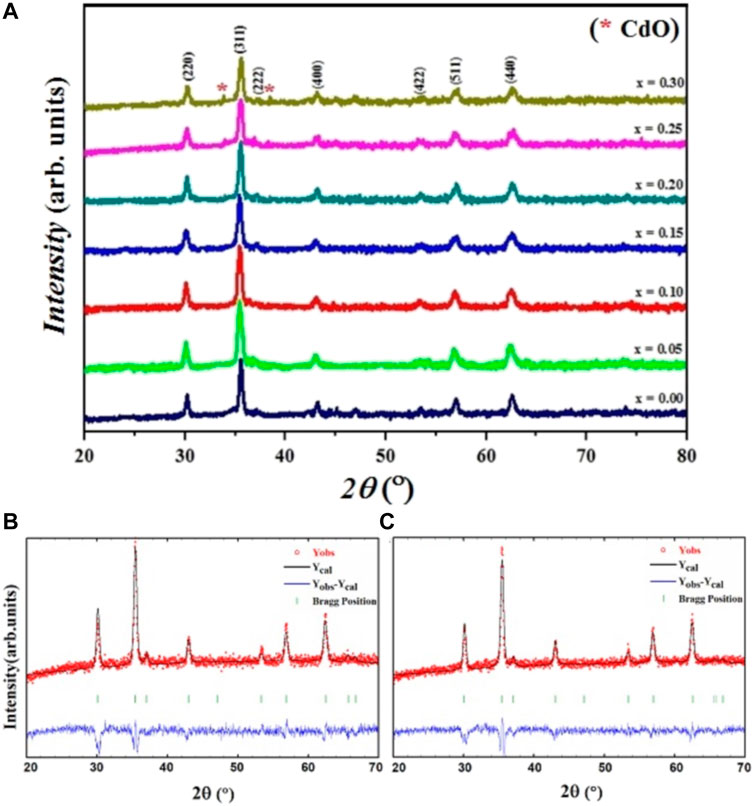
FIGURE 1. (A) XRD patternsof CdxMg0.3-xCu0.2Zn0.5Fe2O4 ferrites. (B), (C) Rietveld refinement of XRD pattern for samples x = 0.00, 0.05, respectively.
The lattice parameter values (a) of all the samples are given in Table 2, and the change in the a with the Cd content is drawn in Figure 2. The a shows a decreasing trend by increasing the amount of cadmium from x = 0.00 to x = 0.15, and then the substitution goes through an increasing trend. The ionic radii of the atoms participating in the A-site (CN: 4) for Mg2+, Cd2+, Zn2+, Cu2+, Zn2+, Fe2+, Fe3+, O2- are: 0.49, 0.84, 0.62, 0.60, 0.63, 0.49, 1.38 Å, respectively, and in the B site (CN: 6) are: 0.72, 0.95, 0.73, 0.74, 0.77, 0.64, 1.40 Å, respectively (William, 1944; Birajdar et al., 2002). It is observed that the lattice parameter decreases with cadmium content obeying Vegard’s law for x up to 0.15 (Bachhav et al., 2011). However, as reported by the structural analysis, there is the traces of CdO impurity phase in addition to spinel phase diffraction peaks for x = 0.25, 0.30. This result shows that the solid solubility limit in our samples is for x = 0.15. Also, decrease in the lattice parameter a results in the decrease of the bond lengths with Cd content. It can be concluded that there is increase of ionic-covalent character of the spinel with Cd content (Yue et al., 2001; Bachhav et al., 2011).
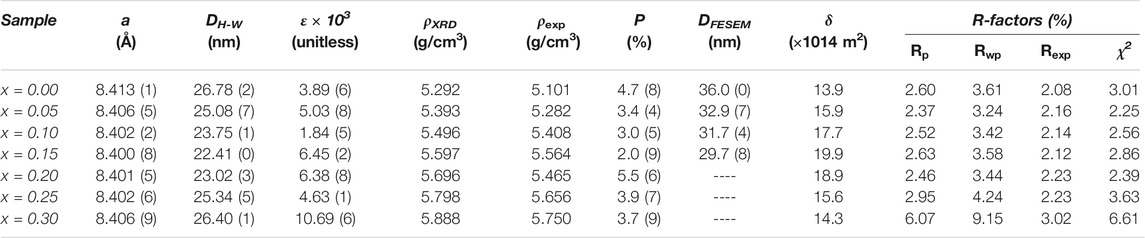
TABLE 2. The a, DH-W, and ε, dislocation density (δ), theoretical and experimental density, porosity percentage, mean particle size (DFESEM), and as well as R-factors values related to the quality of Rietveld refinement.
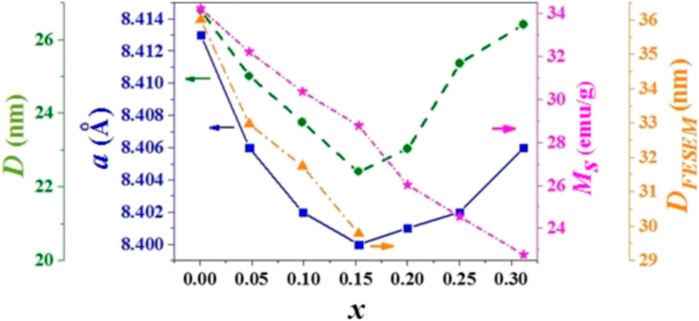
FIGURE 2. Changes of the a, D, Ms, and DFE-SEM of CdxMg0.30-xCu0.20Zn0.50Fe2O4 ferrites.
The linear fitting curves of
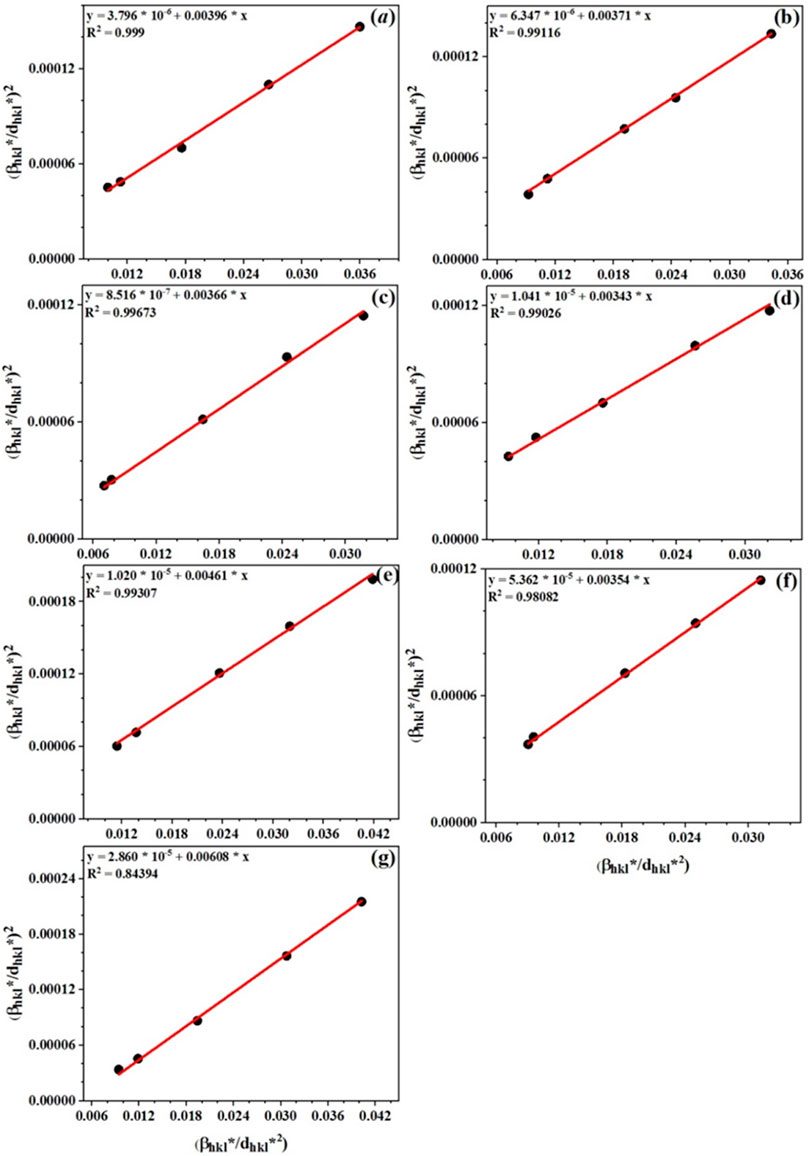
FIGURE 3. Halder-Wagner plots of
The theoretical density (ρXRD) of CdxMg0.30-xCu0.20Zn0.50Fe2O4 ferrites was obtained from the following equation (Gholizadeh, 2018):
In the above relation, M, and a are the molar mass, and the lattice parameter of the samples, respectively. An increase in the theoretical density with the Cd substitution shows that the increasing trend of the molar mass overcomes the non-uniform change of the a. Also, the experimental density (ρexp) of the studied ferrites was obtained by the following equation (Gholizadeh and Jafari, 2017):
In the above relation, A is the surface of the pellet, d is the thickness of the pellet, m is the weight of the pellet, V is also the pellet’s volume. Using the theoretical and experimental densities of all samples, the values of porosity percentage (P) were calculated with the following relation (William, 1944):
The dislocation density (δ) contains information on the improvement of the crystal structure and was calculated according to
FESEM Images and EDX Analysis
The FE-SEM images of the samples with x = 0.00, 0.05, 0.10, 0.15 are shown in Figure 4. As can be seen, the surface morphology of the samples consists of ordered grains composed of smaller nanoparticles with an unequal size that are distributed throughout the samples with small porosity. A particle size distribution diagram of the samples was drawn and the mean particle size (DFESEM) was obtained using fitting the particle size distribution histogram with the lognormal distribution function (Mahmoudi and Gholizadeh, 2018).
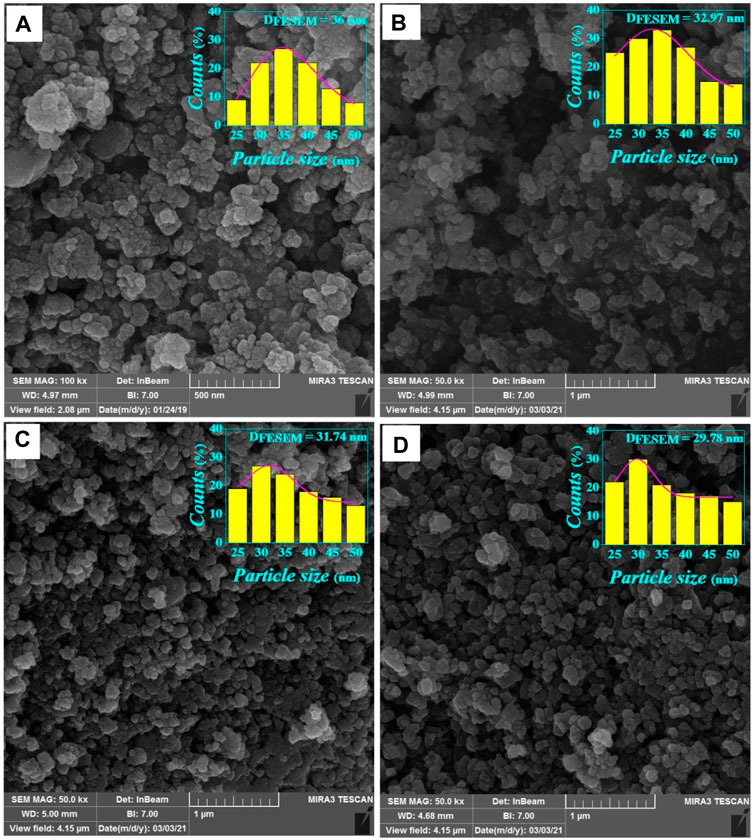
FIGURE 4. The FE-SEM images and log-normal distribution diagram of CdxMg0.30-xCu0.20Zn0.50Fe2O4 for (A) x = 0.00, (B) x = 0.05, (C) x = 0.10, and (D) x = 0.15.
The DFESEM values calculated are given in Table 2 and are plotted in Figure 2. The particle size obtained by this method is slightly larger than the DH-W obtained by the Halder-Wagner method. This is because the grains consist of crystallite size. As shown in Figure 2, the variation of the DFE-SEM is compatible with the values of the a, and DH-W.
The X-ray Energy-dispersive spectroscopy (EDX) attached to the FESEM microscope was used for elemental analysis of the samples. Figure 5 shows the elemental analysis spectra obtained from the EDX analysis for CdxMg0.30-xCu0.20Zn0.50Fe2O4 nanoparticles. In the desired spectrum, energy lines related to Mg, Cd, Cu, Zn, Fe, O can be seen. The values of atomic percentage and weight percentage calculated from the spectrum for the constituent elements of the FESEM samples are recorded as a table in the inset of Figure 5. The data in these tables show a good agreement with the formula composition of each sample.
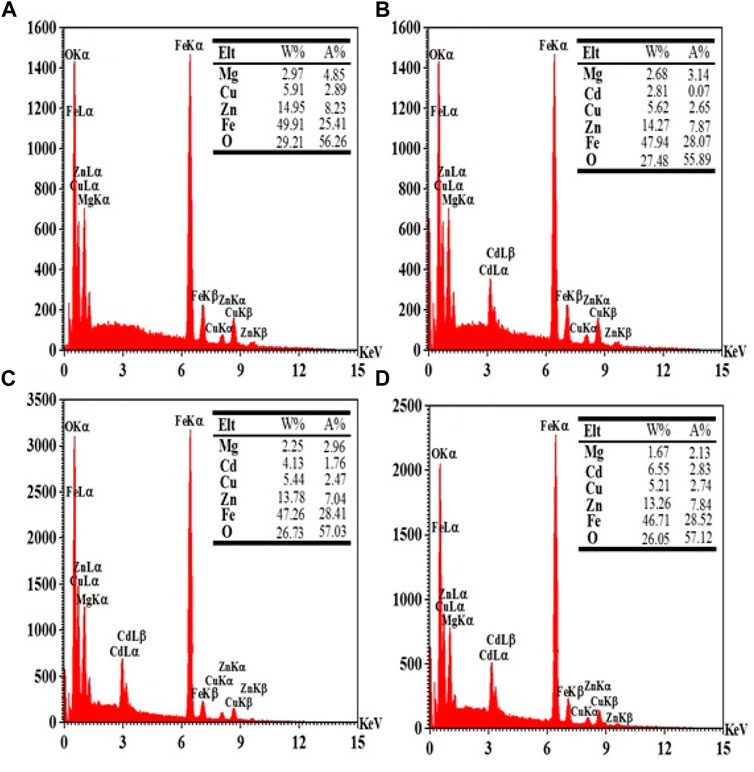
FIGURE 5. EDX analysis of the CdxMg0.30-xCu0.20Zn0.50Fe2O4 nanoparticles for (A) x = 0.00, (B) x = 0.05, (C) x = 0.10, and (D) x = 0.15.
FTIR Analysis
The FTIR spectra of all samples are shown in Figure 6 in the wavelength range of 400–900 cm−1. Two strongly absorption bands are observed around 450 and 560 cm−1, which are familiar to those that observed in the spinel ferrites and are mainly related to the iron-oxygen vibrations. The frequency band υt at around 560 cm−1 related to the oxygen-iron vibration at the A site, the frequency band υo around 450 cm−1 refers to the oxygen-iron vibration at the B site, so that the appearance of these two vibration modes confirms the formation of the spinel structure of the samples (Gholizadeh and Jafari, 2017). However, the position and width of the bands are affected by factors such as grain size, sintering conditions, and preparation method (Gholizadeh and Jafari, 2017).
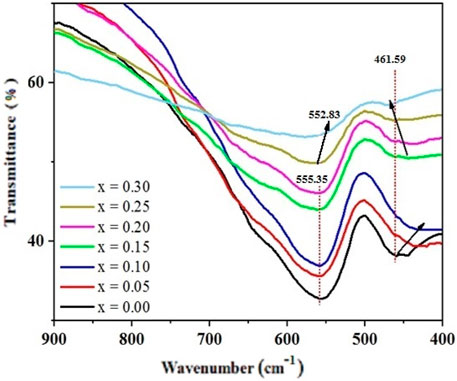
FIGURE 6. FTIR spectra of CdxMg0.3-xCu0.2Zn0.5Fe2O4 ferrites.
As shown in Figure 6, the value of υt at the A site for the samples with x = 0.00, 0.05, 0.10, 0.15, 0.20 is almost constant, but υo at the B site for these samples shows a decreasing trend. However, the value of υt in the samples with x = 0.25, 0.30 shows a decreasing trend, and υo for these samples shows an increasing trend. The difference in the band’s position can be interpreted in terms of the mass and radius of the participating atoms at the two sites. Here, the change in the Fe3+-O2- bond length at the A and B sites explains the changes observed in the a. Since the ionic radius of Cd2+ is greater than other divalent cations participated at the A and B sites, it can mainly occupy the B site, which explains the variation of the υ2.
Magnetic Measurement
Figure 7 shows the magnetization curves of CdxMg0.30-xCu0.20Zn0.50Fe2O4 ferries versus applied magnetic field. The magnetic hysteresis confirms the prepared ferrite material is magnetically ordered. The magnetic parameters of the studied ferrites can be obtained from these curves.
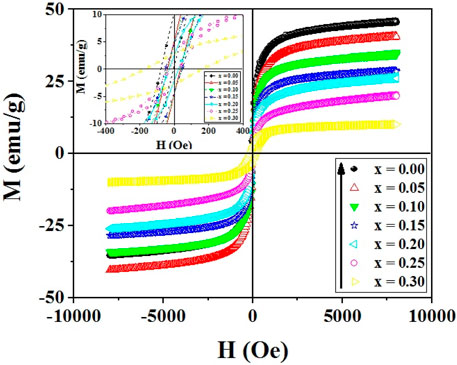
FIGURE 7. Room-temperature magnetization curves of CdxMg0.30-xCu0.20Zn0.50Fe2O4 samples.
The According to law of approach to saturation (LAS), the magnetization of ferromagnetic nanoparticles at high magnetic fields follows the following formula (Gholizadeh and Jafari, 2017; Beyranvand and Gholizadeh, 2020; Gholizadeh and Beyranvand, 2020).
where,
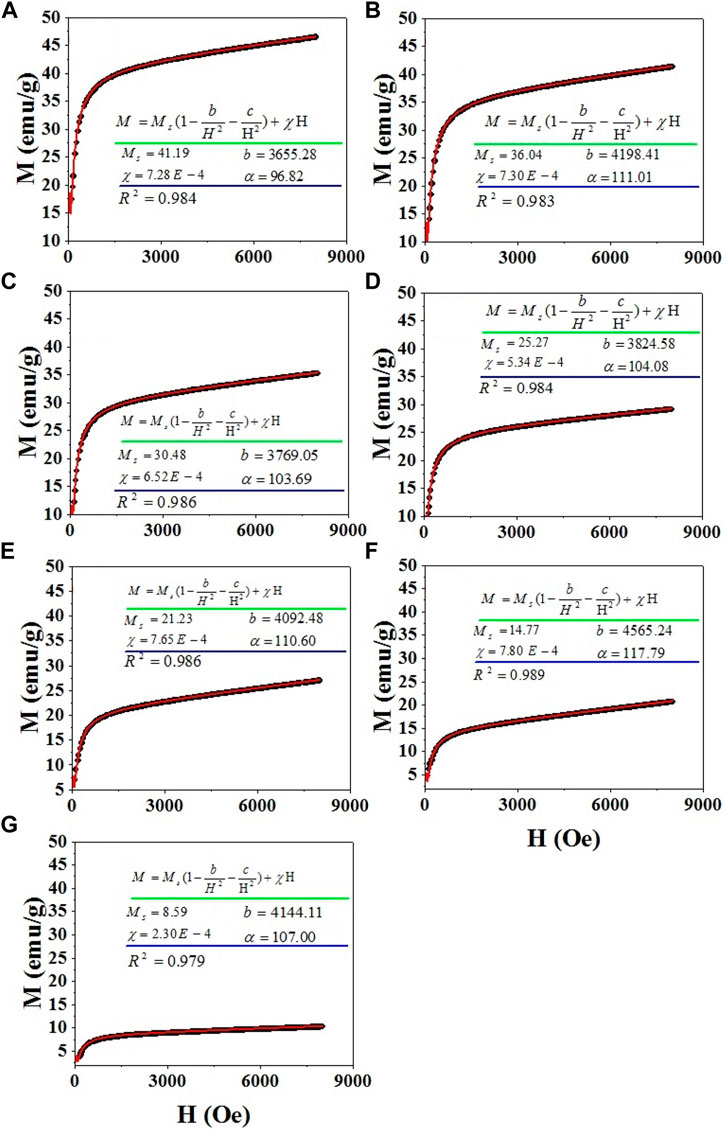
FIGURE 8. LAS fitting of magnetization curves of CdxMg0.30-xCu0.20Zn0.50Fe2O4 nanoparticles for samples (A) x = 0.00, (B) x = 0.05, (C) x = 0.10, (D) x = 0.15, (E) x = 0.20, (F) x = 0.25, (G) x = 0.30.
In general, the total Ms of the ferrites depends on the distribution of magnetic cations in the A and B sites, sintering temperature, grain size, chemical composition, density, etc. (Gholizadeh and Jafari, 2017; Gholizadeh, 2018; Shamgani and Gholizadeh, 2019; Beyranvand and Gholizadeh, 2020; Gholizadeh and Beyranvand, 2020). Magnetization of ferrites is strongly dependent on the exchange interactions between cations present at A and B sites. These exchange interactions are A–B, B–B and A–A interactions, either positive or negative. The parallel arrangement of cations is represented by positive and negative sign denotes anti-parallel arrangement of cations. These interactions depend on magnitude, sign, the extent and form of overlap of the 3d electron wave functions of the neighboring ions (Hakim et al., 2015; Vara Prasad, 2015; THORAT et al., 2018). The strength of the interaction is proportional to the distance between ions and the cations present in the ferrite system. Therefore, when the system is altered with larger/smaller cations it may influence the magnetization. Magnetization of ferrites also can be explained on Neel’s theory of ferrimagnetism (two sub lattice model) (Hakim et al., 2015; Vara Prasad, 2015; THORAT et al., 2018). According to the Néel theory, the A-B negative exchange interaction dominates over the A-A and B-B positive exchange interactions. The magnetic moments in each sublattice are oriented in parallel and relative to each are antiparallel. According to Neil’s theory, the Ms of the spinel ferrites can be expressed by (Gholizadeh and Jafari, 2017; Beyranvand and Gholizadeh, 2020; Gholizadeh and Beyranvand, 2020):
where, MA and MB are the Ms of ions at the A- and B-sites, respectively. Two factor are determining the decrease of Ms with Cd content. First factor for a gradual decrease in the magnetization of the samples with the increasing the Cd2+ content is originated from the presence of non-magnetic Cd2+ ions at the B site which induces a pressure on the Fe3+ (5 μB) ions at the B site and their transfer to the A site. This reduces the magnetization of the samples in accordance with the Néel relation. Second factor in decrease of Ms with Cd content is the decrease of grain size. Since, magnetization caused by domain wall movement requires less energy than that requires by domain rotation, it is easy for the domain wall movement to magnetize or demagnetize the samples with larger grain size (Hakim et al., 2015). Samples with larger grain are expected to have high Ms. However, a high decrease in the Ms of the samples with x = 0.25, 0.30 can also be attributed to the CdO impurity phase. The CdO is the II-VI group semiconductor that shows the paramagnetism nature at RT. The coexistence of the CdO phase and spinel ferrite can potentially explain the decrease of Ms (Beyranvand and Gholizadeh, 2020).
Optical Properties
Investigation of optical properties of Mg0.30-xCdxCu0.2Zn0.5Fe2O4 nanoparticles is possible by using the absorption spectrum of the samples in the visible-ultraviolet region. The direct energy gap of all the studied samples was obtained by extrapolating the linear part of the diagram of (αhʋ)2 versus (hʋ) as shown in Figure 9. The error in bandgap value, measured from Tauc plot method is ∼0.02 eV. The energy gap of the samples with increasing the Cd substitution up to x = 0.20 shows an increasing trend and then decreases with the substitution. The obtained values of the bandgap are in agreement with the values reported in other articles for ferrites (Ajmal and Maqsood, 2008; Banerjee et al., 2007). The energy gap of the samples may shift due to structural changes in the crystal lattice parameters listed in Table 2 (Andrade et al., 2017). It can be interpreted in terms of the changes in the electronic structure of the samples which is originated from the changes in the Fe3+-O2-- Fe3+ bond angle and the Fe3+-O2- bond length. Also, Figure 9 depicts that the energy band gap increases as the crystallite size decreases with the increase of Cdsubstitution for x up to 0.20 (see Table 2). Such behavior may be explained on the bases of Brass’s effective mass model (Lin et al., 2005; Jauhar et al., 2011; Agrawal et al., 2016), where the measured band gap
where
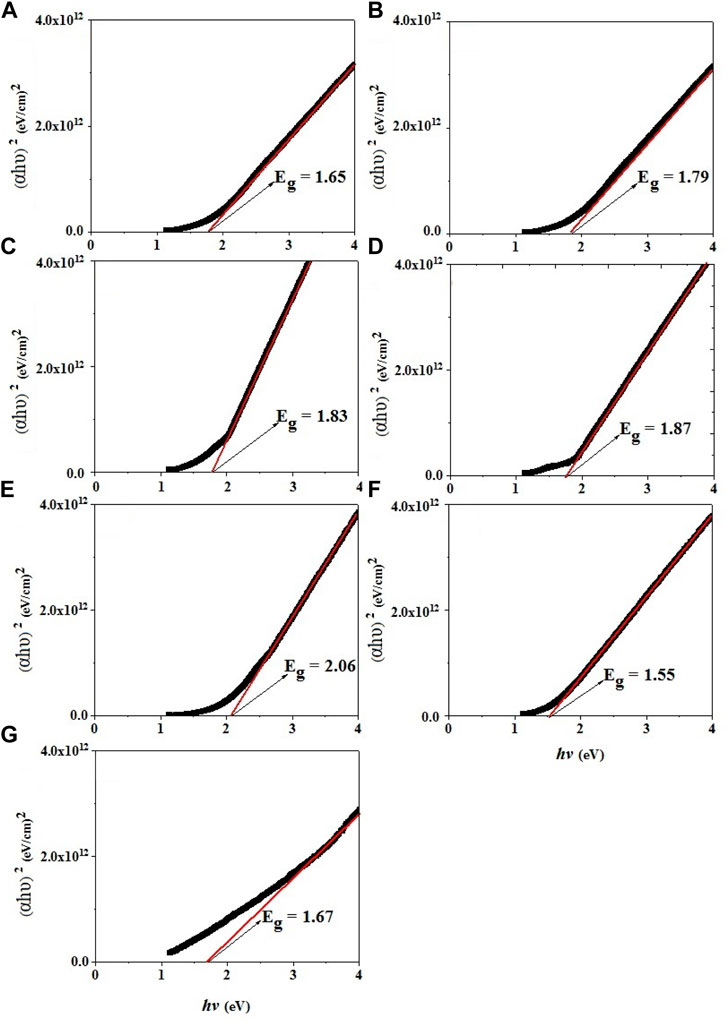
FIGURE 9. Extrapolation of the linear part of diagram of (αhʋ)2 versus (hʋ) for Mg0.30-xCdxCu0.2Zn0.5Fe2O4 ferrites (A) x = 0.00, (B) x = 0.05, (C) x = 0.10, (D) x = 0.15, (E) x = 0.20, (F) x = 0.25, (G) x = 0.30.
Dielectric Properties
The measured values of capacitance (C) and dielectric loss tangent (tan δ) of the pellets were used for obtaining the real (
where t, and A are the thickness, and the surface area of the pellets. The εo is the permittivity of free space.
Changes in the real and imaginary component of the dielectric constant are shown in Figure 10A,B as a function of frequency for Mg0.30-xCdxCu0.2Zn0.5Fe2O4 (x = 0.00, 0.10, 0.20, 0.30) ferrites. The ε′ has larger values at low frequencies and then, the values of the dielectric constants decrease uniformly and become very low in the high frequency region which can be mainly interpreted with a Maxwell’s theory of the interfacial polarization (Beyranvand and Gholizadeh, 2020). Based on the proposed mechanism for this type of polarization, the dielectric structure of the ferrites is generally divided into two layers; Layers of high conductivity grains and grain boundaries that act as insulators. The higher accumulation of electrons at the grain boundary than within the grain results in a more significant bilayer structure and interfacial polarization. At low frequencies, electrons due to transfer and electron exchange between ions can travel more than one atomic distance and pass through the grain and accumulate at the grain boundary. But, the further increase in the frequency causes to change the direction of the electron’s motion before reaching the boundaries, resulting in fewer electrons reaching the grain boundary. Hence, the weaker bilayer structure and lower interfacial polarization are created which results in a decrease of dielectric constant (Amini and Gholizadeh, 2020). As shown in Figures 10A,B, the maximum value for the dielectric constant (real and imaginary part) are observed in sample x = 0.20 and the lowest value in sample x = 0.00. The higher value of the real dielectric constant of sample x = 0.20 may be related to its smaller grain size so that at low frequencies, electrons due to easier transfer and electron exchange between Fe3+and M2+ ions can pass through the grain and accumulate more at the grain boundary. However, a decrease in the real dielectric constant of sample x = 0.25 can also be attributed to the presence of CdO impurity phase.
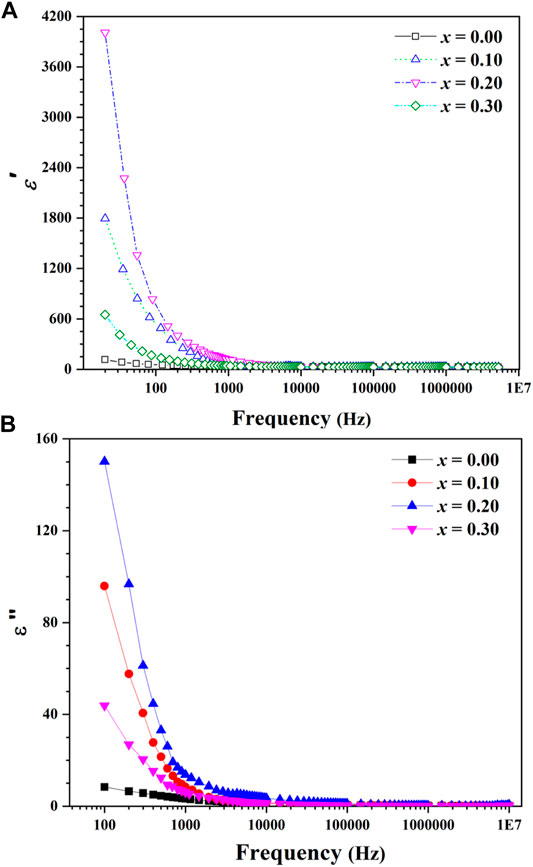
FIGURE 10. Frequency dependency of (A) real part of dielectric constant and (B) imaginary part of dielectric constant for Mg0.30-xCdxCu0.2Zn0.5Fe2O4 ferrites.
Figure 10B shows the imaginary part of dielectric constant which means the loss of energy in dielectric materials. As it can be seen, at low frequencies the loss is very high, and as the frequency increases, the loss decreases steadily. As the frequency increases, the amount of loss reaches a fixed value. High amounts of loss at low frequency can be attributed to the accumulation of electrons in high-resistive grain boundaries. Therefore, much energy is needed to electron transfer between Fe3+ and M2+ ions. The higher the amount of energy consumed for electron exchange, the greater the energy loss. On the other hand, due to the obvious role of the grain in the electron exchange and the lower resistivity of the grains at higher frequencies, the amount of energy required for electron transfer is reduced and consequently the amount of dielectric loss is reduced (Amini and Gholizadeh, 2020; Beyranvand and Gholizadeh, 2020; Gholizadeh and Beyranvand, 2020). The strong dispersion in the low frequency region and the high value of the measured dielectric constant of sample x = 0.20 being large is due to the combined influence of space charge effects arising from species like Fe2+ ions, oxygen vacancies, and grain boundary defects.
Elastic Properties
In the Mg0.30Cu0.2Zn0.5Fe2O4 ferrites, the Zn2+ ions prefer to occupy the tetrahedral sites, while most of the Mg2+ and Cu2+ions occupy the octahedral sites. The Fe3+ ions are distributed among the tetrahedral and octahedral sites (Shamgani and Gholizadeh, 2019). However, the FTIR results of the samples Mg0.30Cu0.2Zn0.5Fe2O4 suggest that Cu2+ ions prefer to occupy the octahedral sites. Thus the cation distribution for the Mg0.30-xCdxCu0.2Zn0.5Fe2O4 ferrites can be written as (Zn0.5Fe0.5)A (CdxMg0.3-xCu0.2Fe1.5)B.
By using molecular weights of cations MA and MB on tetrahedral and octahedral sites, the values of force constants Kt and Ko for A- and B-sites, respectively, which suggested by Waldron, were calculated as follow (WALDRON, 1955):
The stiffness constant C11 can be obtained from K= (Kt + Ko)/2 = a C11 (Gholizadeh, 2017a), where K and a are the average force constant and lattice parameter. In cubic crystals, the other elastic constants of the studied ferrites have been calculated using following equations (WALDRON, 1955; Mohammed et al., 2012; Gholizadeh, 2017a; Dubey and Lahiri, 2021):
where h, kB, M, q and ρ are the Plank constant, the Boltzmann constant, the molecular weight, the number of atoms in the unit formula and density, respectively. The calculated values for the elastic constants are tabulated in Table 3.
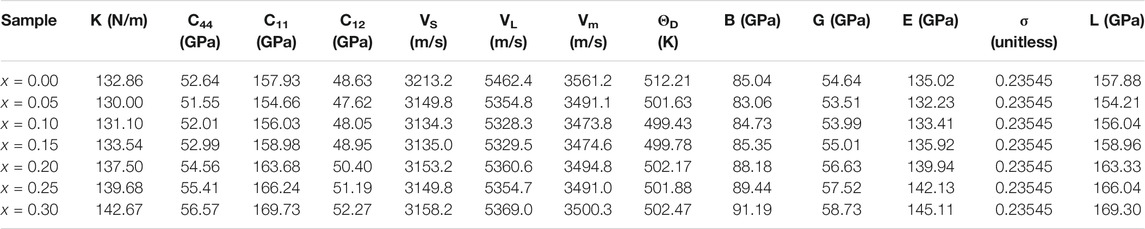
TABLE 3. Mean force constant (K), elastic stiffness constants (C11, C44, C12), velocity of longitudinal and shear waves (VL, VS), mean velocity (Vm) and Debye temperature (ΘD), longitudinal modulus (L), Poisson’s ratio (σ), rigidity modulus (G), Young’s modulus (E), and bulk modulus (B) for Mn0.3-xBaxCu0.2Zn0.5Fe2O4 nanoparticles.
It is observed from Table 3 that the values of the K, C11, C44, C12, L, G, E, and B increase with the increase of Cd2+ substitution. It results in increase of the strength of the interatomic interactions between various atoms. This behavior can be attributed to the substitution of heavier Cd2+ for lighter Mg2+ ions which need higher energy to vibration. The value of σ = 0.2354 for the samples lie in the range from -0.9 to 0.5 obtained from the theory of isotropic elasticity (Mohammed et al., 2012; Gholizadeh, 2017a; Dubey and Lahiri, 2021).
Looking at Table 3, we can observe that the velocity of shear waves (VS) is less than longitudinal waves (VL). This is due to when a wave travels through a material, it makes the particle vibrate. Due to transfer of energy, the vibrating particles collide with other particles, which results in other particles to vibrate. In case of shear waves, vibrates, and hence it requires a larger energy to make the neighboring particle vibrate (Gholizadeh, 2017a). Since, the energy required to vibrate the particle perpendicular to the direction of wave propagation in a material is smaller than parallel vibration; hence the velocity of the shear waves is less than that of longitudinal waves. The values of Vm and
Conclusion
In this work, the structural and magnetic properties of CdxMg0.30-xCu0.20Zn0.50Fe2O4 spinel ferrites prepared by the citrate auto-combustion method were investigated. Rietveld refinement of XRD pattern indicates the formation of a cubic structure with space group Fd
Data Availability Statement
The original contributions presented in the study are included in the article/Supplementary Material, further inquiries can be directed to the corresponding author.
Author Contributions
MB: Formal analysis, resources, methodology, data curation. AZ: Methodology, writing–original draft. AG: Data curation, writing–original draft, writing–review; editing, supervision.
Funding
The Financial Support of the Research Council of Damghan University with the Grant number 679808 is acknowledged.
Conflict of Interest
The authors declare that the research was conducted in the absence of any commercial or financial relationships that could be construed as a potential conflict of interest.
Publisher’s Note
All claims expressed in this article are solely those of the authors and do not necessarily represent those of their affiliated organizations, or those of the publisher, the editors, and the reviewers. Any product that may be evaluated in this article, or claim that may be made by its manufacturer, is not guaranteed or endorsed by the publisher.
References
Abareshi, M., Goharshadi, E. K., Mojtaba Zebarjad, S., Khandan Fadafan, H., and Youssefi, A. (2010). Fabrication, Characterization and Measurement of thermal Conductivity of Fe3O4 Nanofluids. J. Magnetism Magn. Mater. 322, 3895–3901. doi:10.1016/j.jmmm.2010.08.016
Agrawal, S., Parveen, A., and Azam, A. (2016). Structural, Electrical, and Optomagnetic Tweaking of Zn Doped CoFe2-xZnxO4-δ Nanoparticles. J. Magnetism Magn. Mater. 414, 144–152. doi:10.1016/j.jmmm.2016.04.059
Ajmal, M., and Maqsood, A. (2008). Structural, Electrical and Magnetic Properties of Cu1-xZnxFe2O4 Ferrites. J. Alloys Compd. 460, 54–59. doi:10.1016/j.jallcom.2007.06.019
Amini, M., and Gholizadeh, A. (2020). Shape Control and Associated Magnetic and Dielectric Properties of MFe12O19 (M = Ba, Pb, Sr) Hexaferrites. J. Phys. Chem. Sol. 147, 109660. doi:10.1016/j.jpcs.2020.109660
Andrade, A. B., Ferreira, N. S., and Valerio, M. E. G. (2017). Particle Size Effects on Structural and Optical Properties of BaF2 Nanoparticles. RSC Adv. 7, 26839–26848. doi:10.1039/c7ra01582h
Bachhav, S. G., Patil, R. S., Ahirrao, P. B., Patil, A. M., and Patil, D. R. (2011). Microstructure and Magnetic Studies of Mg–Ni–Zn–Cu Ferrites. Mater. Chem. Phys. 129, 1104–1109. doi:10.1016/j.matchemphys.2011.05.067
Banerjee, M., Verma, N., and Prasad, R. (2007). Structural and Catalytic Properties of Cu1-xZnxFe2O4 Nanoparticles. J. Mater. Sci. 42, 1833–1837. doi:10.1007/s10853-006-0821-1
Beyranvand, M., and Gholizadeh, A. (2020). Structural, Magnetic, Elastic, and Dielectric Properties of Mn0.3−xCdxCu0.2Zn0.5Fe2O4 Nanoparticles. J. Mater. Sci. Mater. Electron. 31, 5124–5140. doi:10.1007/s10854-020-03073-8
Birajdar, D. S., Devatwal, U. N., Jadhav, K. M., and X-ray, “ (2002). IR and Bulk Magnetic Properties of Cu1+xMnxFe2–2xO4 Ferrite System. J. Mater. Sci. 37, 1443–1448. doi:10.1023/a:1014505620254
Chen, D.-H., and He, X.-R. (2001). Synthesis of Nickel Ferrite Nanoparticles by Sol-Gel Method. Mater. Res. Bull. 36, 1369–1377. doi:10.1016/s0025-5408(01)00620-1
Chen, D., Chen, D., Jiao, X., Zhao, Y., and He, M. (2003). Hydrothermal Synthesis and Characterization of Octahedral Nickel Ferrite Particles. Powder Technol. 133, 247–250. doi:10.1016/s0032-5910(03)00079-2
Dubey, H. K., and Lahiri, P. (2021). Synthesis, Structural, Dielectric and Magnetic Properties of Cd2+ Based Mn Nanosized Ferrites. Mater. Technol. 36, 131–144. doi:10.1080/10667857.2020.1734728
El-Kemary, M., Nagy, N., and El-Mehasseb, I. (2013). Nickel Oxide Nanoparticles: Synthesis and Spectral Studies of Interactions with Glucose. Mater. Sci. Semiconductor Process. 16, 1747–1752. doi:10.1016/j.mssp.2013.05.018
El-Sayed, A. M. (2002). Effect of Chromium Substitutions on Some Properties of NiZn Ferrites. Ceramics Int. 28, 651–655. doi:10.1016/s0272-8842(02)00022-6
Esmaili, L., and Gholizadeh, A. (2020). The Effect of Nd and Zr Co-substitution on Structural, Magnetic and Photocatalytic Properties of Bi1-xNdxFe1-xZrxO3 Nanoparticles. Mater. Sci. Semiconductor Process. 118, 105179. doi:10.1016/j.mssp.2020.105179
Gholizadeh, A. (2017a). A Comparative Study of Physical Properties in Fe3O4 Nanoparticles Prepared by Coprecipitation and Citrate Methods. J. Am. Ceram. Soc. 100, 3577–3588. doi:10.1111/jace.14896
Gholizadeh, A. (2017b). La1−xCaxCo1−yMgyO3 Nano-Perovskites as CO Oxidation Catalysts: Structural and Catalytic Properties. J. Am. Ceram. Soc. 100, 859–866. doi:10.1111/jace.14602
Gholizadeh, A. (2018). A Comparative Study of the Physical Properties of Cu-Zn Ferrites Annealed under Different Atmospheres and Temperatures: Magnetic Enhancement of Cu0.5Zn0.5Fe2O4 Nanoparticles by a Reducing Atmosphere. J. Magnetism Magn. Mater. 452, 389–397. doi:10.1016/j.jmmm.2017.12.109
Gholizadeh, A., and Beyranvand, M. (2020). Structural, Magnetic, Elastic, and Dielectric Properties of Mg0.3−xBaxCu0.2Zn0.5Fe2O4 Nanoparticles. Physica B: Condensed Matter 584, 412079. doi:10.1016/j.physb.2020.412079
Gholizadeh, A., and Jafari, E. (2017). Effects of Sintering Atmosphere and Temperature on Structural and Magnetic Properties of Ni-Cu-Zn Ferrite Nanoparticles: Magnetic Enhancement by a Reducing Atmosphere. J. Magnetism Magn. Mater. 422, 328–336. doi:10.1016/j.jmmm.2016.09.029
Gholizadeh, A., and Malekzadeh, A. (2017). Structural and Redox Features of La0.7Bi0.3Mn1-xCoxO3 Nanoperovskites for Ethane Combustion and CO Oxidation. Int. J. Appl. Ceram. Technol. 14, 404–412. doi:10.1111/ijac.12650
Gholizadeh, A., and Tajabor, N. (2010). Influence of N2- and Ar-Ambient Annealing on the Physical Properties of SnO2:Co Transparent Conducting Films. Mater. Sci. Semiconductor Process. 13 (3), 162–166. doi:10.1016/j.mssp.2010.10.004
Gholizadeh, A. (2019). The Effects of A/B-site Substitution on Structural, Redox and Catalytic Properties of Lanthanum Ferrite Nanoparticles. J. Mater. Res. Technol. 8, 457–466. doi:10.1016/j.jmrt.2017.12.006
Gholizadeh, A., Yousefi, H., Malekzadeh, A., and Pourarian, F. (2016). Calcium and Strontium Substituted Lanthanum Manganite–Cobaltite [La1−x(Ca,Sr)xMn0.5Co0.5O3] Nanocatalysts for Low-Temperature CO Oxidation. Ceramics Int. 42, 12055–12063. doi:10.1016/j.ceramint.2016.04.134
Gill, N. K., and Puri, R. K. (1985). Mossbauer Study of Li0.5Fe2.5-xCrxO4 Ferrites. Spectrochimica Acta A: Mol. Spectrosc. 41, 1005–1008. doi:10.1016/0584-8539(85)80064-7
Gopal Reddy, C., Manorama, S. V., and Rao, V. J. (1999). Semiconducting Gas Sensor for Chlorine Based on Inverse Spinel Nickel Ferrite. Sensors Actuators B: Chem. 55, 90–95. doi:10.1016/s0925-4005(99)00112-4
Hakim, M. A., Akhter, S., Paul, D. P., and Hoque, S. M. (2015). Effect of Mg Substituted on Physical and Magnetic Properties of Cu-Mg Ferrites. Appl. Res. J. 1, 91–96.
Jauhar, S., Singh, J., Chandra, K., Bansal, S., and Singhal, S. (2011). Structural, Morphological, Magnetic and Optical Properties of Chromium Substituted Strontium Ferrites, SrCrxFe12−xO19 (X = 0.5, 1.0, 1.5, 2.0 and 2.5) Annealed with Potassium Halides. Powder Technol. 212, 193–197. doi:10.1016/j.powtec.2011.05.014
Lin, K.-F., Cheng, H.-M., Hsu, H.-C., Lin, L.-J., and Hsieh, W.-F. (2005). Band gap Variation of Size-Controlled ZnO Quantum Dots Synthesized by Sol–Gel Method. Chem. Phys. Lett. 409, 208–211. doi:10.1016/j.cplett.2005.05.027
Mahmoudi, S., and Gholizadeh, A. (2018). Effect of Non-magnetic Ions Substitution on the Structure and Magnetic Properties of Y3−xSrxFe5−xZrxO12 Nanoparticles. J. Magnetism Magn. Mater. 456, 46–55. doi:10.1016/j.jmmm.2018.02.017
Manikandan, A., Judith Vijaya, J., John Kennedy, L., and Bououdina, M. (2013). Microwave Combustion Synthesis, Structural, Optical and Magnetic Properties of Zn1-xSrxFe2O4 Nanoparticles. Ceramics Int. 39, 5909–5917. doi:10.1016/j.ceramint.2013.01.012
Manikandan, A., Judith Vijaya, J., John Kennedy, L., and Bououdina, M. (2013). Structural, Optical and Magnetic Properties of Zn1-xCuxFe2O4 Nanoparticles Prepared by Microwave Combustion Method. J. Mol. Struct. 1035, 332–340. doi:10.1016/j.molstruc.2012.11.007
Manikandan, A., Judith Vijaya, J., Sundararajan, M., Meganathan, C., Kennedy, L. J., and Bououdina, M. (2013). Optical and Magnetic Properties of Mg-Doped ZnFe2O4 Nanoparticles Prepared by Rapid Microwave Combustion Method. Superlattices and Microstructures 64, 118–131. doi:10.1016/j.spmi.2013.09.021
Manikandan, A., Kennedy, L. J., Bououdina, M., Vijaya, J. J., and Synthesis, “ (2014). Optical and Magnetic Properties O Pure and Co-doped ZnFe2O4 Nanoparticles by Microwave Combustion Method. J. Magnetism Magn. Mater. 349, 249–258. doi:10.1016/j.jmmm.2013.09.013
Mohammed, K. A., Al-Rawas, A. D., Gismelseed, A. M., Sellai, A., Widatallah, H. M., Yousif, A., et al. (2012). Infrared and Structural Studies of Mg1–xZnxFe2O4 Ferrites. Physica B: Condensed Matter 407, 795–804. doi:10.1016/j.physb.2011.12.097
Mollamahaleh, Y. B., Hosseini, D., Mazaheri, M., and Sadrnezhaad, S. K. (2011). Surfactant-Free Production of Ni-Based Nanostructures. Msa 02, 444–452. doi:10.4236/msa.2011.25059
Navaei Diva, T., Zare, K., Taleshi, F., and Yousefi, M. (2017). Synthesis, Characterization, and Application of Nickel Oxide/CNT Nanocomposites to Remove Pb2+ from Aqueous Solution. J. Nanostruct. Chem. 7, 273–281. doi:10.1007/s40097-017-0239-0
Noori, F., and Gholizadeh, A. (2019). Structural, Optical, Magnetic Properties and Visible Light Photocatalytic Activity of BiFeO3/graphene Oxide Nanocomposites. Mater. Res. Express 6, 1250g1. doi:10.1088/2053-1591/ab6807
Shamgani, N., and Gholizadeh, A. (2019). Structural, Magnetic and Elastic Properties of Mn0.3−xMgxCu0.2Zn0.5Fe3O4 Nanoparticles. Ceramics Int. 45, 239–246. doi:10.1016/j.ceramint.2018.09.158
Son, S., Taheri, M., Carpenter, E., Harris, V. G., and McHenry, M. E. (2002). Synthesis of Ferrite and Nickel Ferrite Nanoparticles Using Radio-Frequency thermal Plasma Torch. J. Appl. Phys. 91, 7589. doi:10.1063/1.1452705
Thorat, L. M., Patil, J. Y., Nadargi, D. Y., Ghodake, U. R., Kambale, R. C., and Suryavanshi, S. S. (2018). Co2+ Substituted Mg–Cu–Zn Ferrite: Evaluation of Structural, Magnetic, and Electromagnetic Properties. J. Adv. Ceram. 7, 207–217. doi:10.1007/s40145-018-0272-6
T. Rahal, H., Awad, R., Abdel-Gaber, A. M., and -Said Bakeer, D. E. (2017). Influence of SnO2 Nanoparticles Incorporation on the Electrochemical Behaviour of a Superconductor in Sodium Sulphate Solutions. Int. J. Electrochem. Sci. 12, 10115–10128. doi:10.20964/2017.11.82
Vara Prasad, B. B. V. S. (2015). Effect of Indium Substitution on the Electrical and Magnetic Properties of Ni–Zn Ferrite. J. Theor. Appl. Phys. 9, 267–272. doi:10.1007/s40094-015-0185-5
Waldron, R. D. (1955). Infrared Spectra of Ferrites. Phys. Rev. 99, 1727–1735. doi:10.1103/physrev.99.1727
William, G. (1944). Schlecht, “Calculation of Density from X-ray Data, Geological Survey, US Department of Interior”, 29. Washington: D.C. Am. Mineral., 108–110.
Yue, Z., Zhou, J., Li, L., Wang, X., and Gui, Z. (2001). Effect of Copper on the Electromagnetic Properties of Mg–Zn–Cu Ferrites Prepared by Sol–Gel Auto-Combustion Method. Mater. Sci. Eng. B 86, 64–69. doi:10.1016/s0921-5107(01)00660-2
Keywords: Mg-Cu-Zn spinel ferrite, microstructure, saturation magnetization, citrate-nitrate method, dielectric properties, elastic properties
Citation: Beyranvand M, Zahedi A and Gholizadeh A (2022) Cadmium Substitution Effect on Microstructure and Magnetic Properties of Mg-Cu-Zn Ferrites. Front. Mater. 8:779837. doi: 10.3389/fmats.2021.779837
Received: 19 September 2021; Accepted: 30 December 2021;
Published: 28 January 2022.
Edited by:
Bernardo Mendoza, Centro de Investigaciones en Optica, MexicoReviewed by:
M. Sasani Ghamsari, Atomic Energy Organization of Iran, IranSaket Asthana, Indian Institute of Technology Hyderabad, India
Copyright © 2022 Beyranvand, Zahedi and Gholizadeh. This is an open-access article distributed under the terms of the Creative Commons Attribution License (CC BY). The use, distribution or reproduction in other forums is permitted, provided the original author(s) and the copyright owner(s) are credited and that the original publication in this journal is cited, in accordance with accepted academic practice. No use, distribution or reproduction is permitted which does not comply with these terms.
*Correspondence: Ahmad Gholizadeh, Z2hvbGl6YWRlaEBkdS5hYy5pcg==