 Yan Xiong
 Yaxin Chen
 Bo Wu1*
- 1State Key Laboratory of Subtropical Building Science, South China University of Technology, Guangzhou, China
- 2School of Civil Engineering and Transportation, South China University of Technology, Guangzhou, China
- 3Guangdong Chuangcheng Construction Supervision and Consulting Limited Liability Company, Guangzhou, China
The recycling and reuse of waste concrete is conducive to promoting the sustainable development of resources and practicing the concept of green development. Demolished concrete lumps (DCLs) and self-compacting concrete (SCC) made from waste concrete take full advantage of their recyclability. In order to fully utilize the advantages of demolished concrete lumps and self-compacting concrete in construction, applying demolished concrete lumps and self-compacting concrete to composite shear wall structures is an effective way to reduce costs and improve industrial production. In this paper, a new composite shear wall filled with demolished concrete lumps and self-compacting concrete is proposed, and its fire performance is investigated. The shear wall combines edge constraints of concrete-filled steel tubes, demolished concrete lumps and self-compacting concrete. In order to facilitate the mass pouring of demolished concrete lumps, a cavity is formed between the steel tubes at the ends and the precast walls on both sides. A double-sided fire tests was conducted on three composite shear wall specimens filled with demolished concrete lumps and self-compacting concrete at a constant axial compression ratio, where the fire-retardant coating and the wall width-to-depth ratio were considered as the main test parameters. The specimens were able to steadily withstand the predetermined axial loads during the fire resistance time of 180 min and showed good fire resistance. The concrete temperature variation trends of the three specimens in the wall section were basically the same. The fire-retardant coating on the concealed column had a significant effect on the section temperature of the steel tube, while increasing the wall width-to-depth ratio had little effect. When the axial compression ratio was 0.19, the specimens were in the expansion stage within 180 min and no compression occurred. The results show that the expansion deformation of the shear wall sprayed with fire-retardant coating on the outer surface of the concealed column is smaller than that of the shear wall without fire-retardant coating, and the axial deformation of the composite shear wall infilled with demolished concrete lumps and self-compacting concrete is not affected by increasing the wall width-to-depth ratio.
1 Introduction
Nowadays, the shear wall structure has been widely used in high-rise and super-high-rise buildings. In case of fire, it is easy to cause huge casualties and property damage. Meanwhile, shear walls are used in high-rise buildings not only as load-bearing members, but also as firewalls.
Therefore, a lot of work has been done on the fire performance of shear wall structures. Lee et al. (2013) tested the overall fire performance of 8 RC shear walls and investigated the effects of axial load level, wall thickness and other parameters on the fire performance of the walls. Ryu et al. (2020) also investigated the effects of fire time, concrete compressive strength, and heated areas on the fire resistance and mechanical properties of RC walls. Liu et al. (2010) investigated the effects of fire exposure, reinforcement ratio and the axial load under fire on the seismic behavior of RC shear walls. Bamonte et al. (2016) conducted three-sided fire tests on 3 RC walls with different load levels and boundary conditions, which showed that the applied compressive load and boundary conditions had significant effect on the magnitude of the displacements. Kang et al. (2016) conducted experiments to investigate the effects of thickness and moisture on the temperature distribution of RC walls exposed to fire.
In addition, the fire resistance of concrete shear walls with different filling materials was also investigated. Previous investigations (Go et al., 2012; Hertz, 2018) showed that reinforced lightweight aggregate concrete walls outperformed reinforced normal weight concrete walls in terms of basic mechanical properties such as ultimate load, yield load and stiffness. In other experimental studies (Ngo et al., 2013; Xiao et al., 2017; Nguyen et al., 2018) on high-strength concrete walls exposed to fire, the results showed that high-strength concrete spalled more severely when exposed to fire compared to normal-strength concrete.
Also, the fire performance of new composite shear walls has been explored. Wei et al. (2019) studied the fire performance of concrete-filled double-steel-plate composite walls with shear studs, and the results showed that fire performance of composite walls was severely affected by the axial compression ratio, the eccentricity of the axial load, and the bond strength between shear studs and concrete. Kang et al. (2019) also studied the effects of wall thickness and axial load on the capacity of fire-damaged concrete walls, and the investigation found that wall thickness had an effect on the bearing capacity of the fire-damaged walls. Du et al. (2022) conducted a one-sided fire test on four laminated composite walls with truss connectors, and found that the axial compression ratio and truss spacing to thickness ratio had a significant effect on the deformation of the walls.
The tests were also numerically analyzed and simulated. Mueller and Kurama (2019) analyzed the numerical model of RC bearing wall specimens under fire. Morita et al. (2017) performed one-sided fire tests and numerical simulations on a scaled model of reinforced concrete (RC) shear walls. It was found that the wall specimens had different deformation behaviors at different stages of the test and also gave finite element analysis results for the reduction of concrete transient strain, which were consistent with the test results. Chen et al. (2020) investigated the structural behavior and the degradation of the bearing capacity of RC walls under one-sided fire, developed a structural model, and elucidated the damage mechanism of RC walls in fire. Kumar and Kodur (2017) proposed a numerical model based on generalized three-dimensional finite elements, which could predict the thermodynamic behavior of RC walls in fire. Ni and Birely (2018) conducted numerical simulations to investigate the effect of physical seismic damage on the fire resistance of RC walls and found that cracks had a significant effect on the fire resistance of the walls.
As urbanization continues to accelerate, construction activities not only generate a large amount of construction waste, but also increase the demand for natural resources such as sand and gravel. For those waste concrete, if disposed of by open pile or simple landfill, it will not only occupy the land, but also cause serious environmental pollution. Therefore, in order to promote the sustainable development of resources and protect the environment, the recycling and reuse of waste concrete is particularly important. Recycled concrete is divided into recycled aggregate concrete (RAC) and recycled lump concrete (RLC). RAC is the most common sustainable product that uses recycled coarse aggregate (RA) produced by crushing the waste concrete to aggregate size to replace natural coarse aggregate (NA). RLC is produced by directly mixing large size demolished concrete lumps (DCLs) with natural aggregate concrete (NAC) (Limbachiya et al., 2007). DCLs are made by mixing new concrete and waste concrete blocks with characteristic sizes ranging from 60 mm to 300 mm. Compared with RAC, DCLs have the advantages of improved recycling efficiency of waste concrete, simplified the processes, and reduced recycling cost and energy consumption (Jian and Wu, 2021).
In the past 2 decades, industrialized construction has attracted more attention in many countries, including China, as a modern construction technique to replace the traditional cast-in-place concrete construction method (Wang et al., 2021). Compared with cast-in-place concrete structures, precast concrete structural systems offer better quality control, higher construction speed, and lower construction costs (Pavese and Bournas, 2011).
Industrial fabrication of DCLs components in plants has more significant advantages (Wu et al., 2018). In this paper, a new composite shear wall filled with DCLs and self-compacting concrete (SCC) is proposed. This composite shear wall combines edge restraints of concrete-filled steel tubes, DCLs and SCC. To facilitate the mass casting of DCLs, the steel tubes at the ends and the precast walls on both sides are enclosed with a cavity formed in between. Self-compacting concrete is used for the new concrete cast inside the cavity and steel tubes, which can improve the construction efficiency of DCLs and SCC and avoid the vibration problems caused by casting concrete inside the cavity. Herringbone treatment is used for inner interface of precast walls. The transverse reinforcement in the wall extends to the end steel tube, so that the cast-in-place part and the precast part can better form a single unit and share the force.
For the study of the fire resistance of shear walls, most tests and analyses have been conducted on ordinary reinforced concrete shear walls, but few studies have been conducted on the mechanical properties of composite shear walls at high temperature. In this paper, to study the fire resistance of this new composite shear wall filled with DCLs and SCC, three composite shear wall specimens filled with DCLs and SCC were tested for fire resistance at constant axial compression ratio. The temperature field distribution of shear walls in double-sided fire with different test parameters (fire-retardant coating for steel tubes, the wall width-to-depth ratio) was investigated. In addition, the effects of different parameters on the fire resistance of shear walls were analyzed and the fire resistance limits of shear walls under double-sided fire were obtained.
2 Experimental program
2.1 Specimen design
Three composite shear wall specimens filled with DCLs and SCC were designed, bounded by the edges of concrete-filled square steel tubes. These specimens were numbered SW1 to SW3 respectively. All specimens were subjected to double-sided fire tests. The dimensions and structure of the specimens are shown in Figure 1. All specimens had rectangular cross-sections, of which SW1 and SW2 had 1,000 mm × 200 mm and SW3 had 1,200 mm × 200 mm with a wall height of 1,500 mm. The concealed columns of the specimens were thin-walled square steel tube columns filled with DCLs and SCC. The outer lengths of the steel tubes of specimens SW1 to SW3 were 200 × 200 mm with a nominal thickness of 2 mm (the measured thickness was 1.77 mm). Slots were cut in advance on the side of the steel tube in contact with the precast concrete wall. The size and number of slots were determined according to the number and diameter of the transverse reinforcement of the precast walls. The two ends of the transverse reinforcement of the two precast walls were respectively inserted into the pre-drilled slots of the two square steel tubes. The first transverse reinforcement at the upper and lower ends was threaded and tightened with nuts, while the rest of the transverse reinforcement was plain and fully extended into the square steel tubes to ensure the integrity of the precast walls and the thin-walled square steel tube concealed columns. According to the experiment, the upper and lower ends of the walls were designed with reinforced concrete rigid beams, whose stiffness was much greater than that of the walls. The upper end of the reinforced concrete rigid beam was a loading beam with a cross-section dimension of 400 mm × 400 mm, where the length of the loading beam for specimens SW1 and SW2 was 1,200 mm, and the length of the loading beam for specimen SW3 was 1,400 mm. The purpose of setting the loading beam is to ensure that the axial load can be transferred to the wall uniformly during the test, so that the specimen can bear the force uniformly. The lower reinforced concrete rigid beam was the foundation beam with the cross-section size of 500 mm × 500 mm, where the length of the foundation beam for specimens SW1 and SW2 was 1800 mm, and the length of the foundation beam for specimen SW3 was 2000 mm. The function of the foundation beam is to ensure that the specimen is fixed on the ground during the test, so as to reflect the stress and deformation of the specimen as much as possible. The main parameters explored in the design of the specimen include the fire-retardant coating of the steel tubes, and the wall width-to-depth ratio. The detailed parameters of the specimens are shown in Table 1.
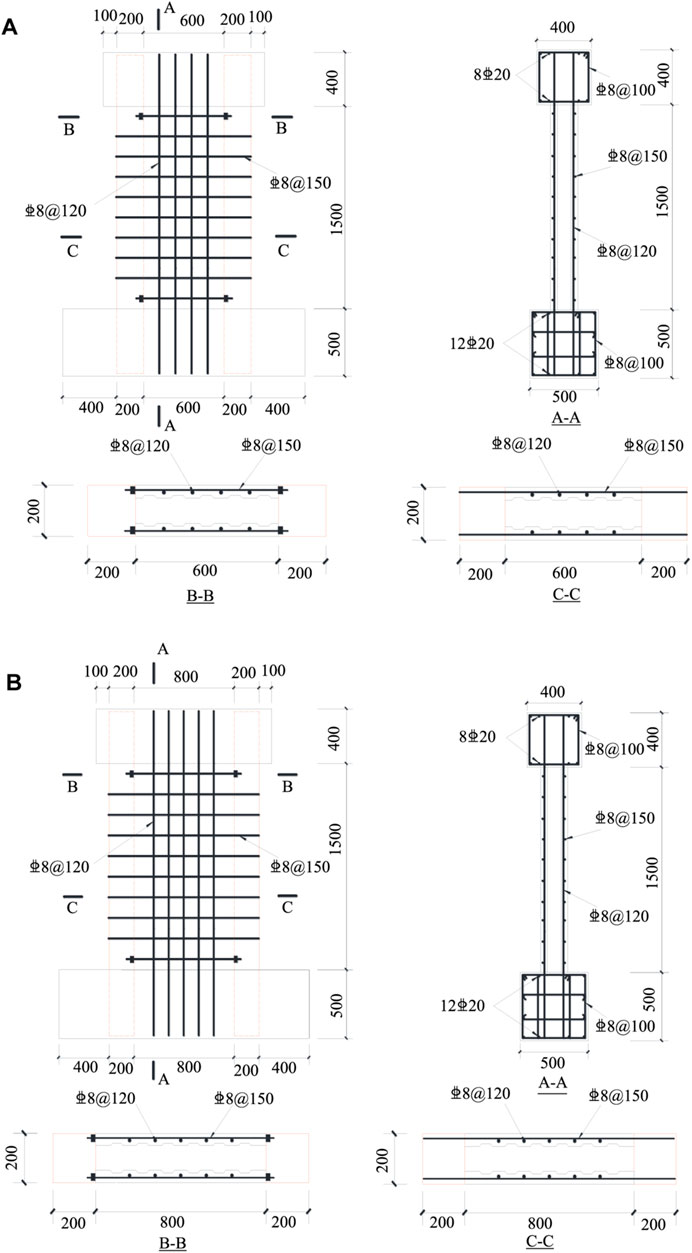
FIGURE 1. Dimensions and details of (A) SW1 and SW2; (B) SW3 (unit: mm).
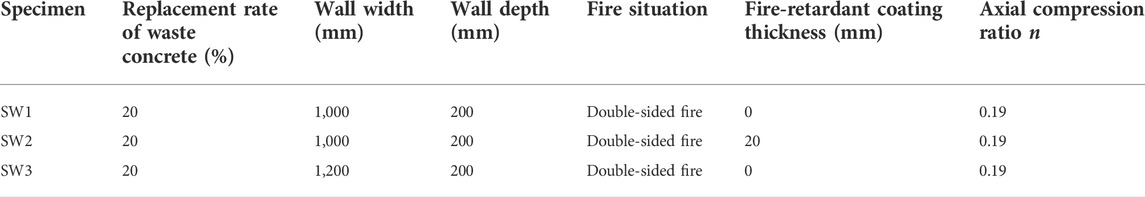
TABLE 1. Detailed parameters of specimens.
2.2 Materials and properties
2.2.1 Rebar and steel
Q235B steel was used for the square steel tubes of the concealed columns of the specimens, HRB400 steel bars with a diameter of 8 mm were used for the horizontal and vertical reinforcement of the precast walls, and HRB400 steel bars with a diameter of 20 mm were used for the longitudinal reinforcement of the loading beams and the foundation beams. The yield strength and ultimate strength of the steel and reinforcement are in accordance with Metallic Materials-Tensile Testing (GB/T 228.1–2010). Details are given in Table 2.
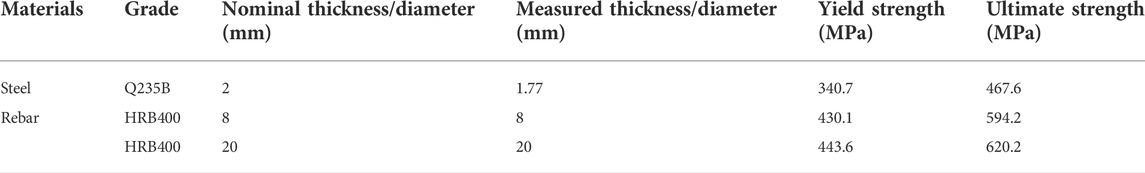
TABLE 2. Strengths of steel plate and steel bar.
2.2.2 Concrete
The waste concrete was obtained from a pit beam of a concrete crushing plant in Panyu District, Guangzhou, China. Before crushing, a cylindrical core sample of 75 × 75 mm (diameter × height) was obtained from the abandoned pit beam by core drilling and used to measure the compressive strength of the abandoned concrete core sample on the test day. Then, the compressive strength of the 150 mm cube was 39.7 MPa according to Technical Specification for Testing Concrete Strength with Drilled Core. As is shown in Figure 2, the waste concrete was manually crushed into concrete blocks with characteristic dimensions of 60–80 mm.
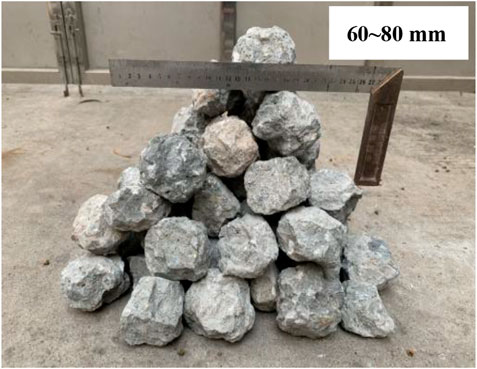
FIGURE 2. Demolished concrete lumps (DCLs).
The determination of compressive strength of 150 mm cube of the concrete was based on Standard for Test Method of Mechanical Properties on Ordinary Concrete (GB/T 50081–2002). The concrete for pouring the precast walls was commercial ordinary concrete (COC). The measured compressive strength of COC cube at 28 days was 23.5 MPa and the compressive strength at the test day was 26.7 MPa. The new concrete was commercial self-compacting concrete (CSCC). The compressive strength of CSCC cube at 28 days was 58 MPa and the compressive strength at the test day was 59 MPa. The mix proportions of COC and CSCC are shown in Table 3 and Table 4.

TABLE 3. Mix proportion of commercial ordinary concrete (Unit: kg/m3).
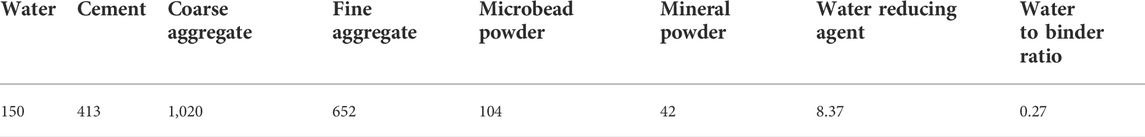
TABLE 4. Mix proportion of commercial self-compacting concrete (Unit: kg/m3).
Before pouring CSCC, the slump extension test, as well as the T500 test and the J-ring extension test were carried out according to Technical Specification for Application of Self-compacting Concrete (JGJ/T 283–2012). The test results are shown in Table 5.

TABLE 5. Test results of the workability of commercial self-compacting concrete.
2.2.3 Fire-retardant coating
In this test, 20 mm thick fire-retardant coating was applied to the steel tube. “Outdoor non-intumescent steel structure fire-retardant coating” produced by Guangzhou Taibao Fireproof Materials Co., Ltd. was selected as the fire-retardant coating. The performance index of fire-retardant coating is shown in Table 6.

TABLE 6. Index of fire-retardant coating.
2.3 Specimen production
The specimens were poured in the following order. The first step was to pour the precast walls with plain concrete, including formwork installation and thermocouple arrangement. The second step was to assemble the precast walls and the square steel tubes. After the precast walls were cured to a certain strength, the two ends of the horizontal reinforcement of the two precast concrete walls were respectively inserted into the pre-drilled slot holes of the two rectangular steel tubes. The first horizontal reinforcement at the upper and lower ends was threaded and tightened with nuts, while the rest of the horizontal reinforcement was made of ordinary ribs that extended completely into the square steel tube. Finally, the vertical reinforcement and the square steel tube were inserted into the reinforcement cage of the foundation beam. The third step was to pour the foundation beam. The fourth step was the pouring of concrete in the cavity of the precast walls and the square steel tubes, as well as the pouring of concrete for the loading beam. One hour before pouring, the waste concrete blocks were well wetted by spraying tap water. During the formal pouring process, self-compacting fresh concrete with a thickness of about 20 mm was first poured into the cavity of the precast walls and square steel tubes, and then the waste concrete blocks and self-compacting fresh concrete were alternately placed into the cavity of the precast walls and square steel tubes with short time assisted vibration using a vibrator. Finally, the loading beam was poured with cast-in-place self-compacting concrete. The fabrication process of the specimens is shown in Figure 3A.
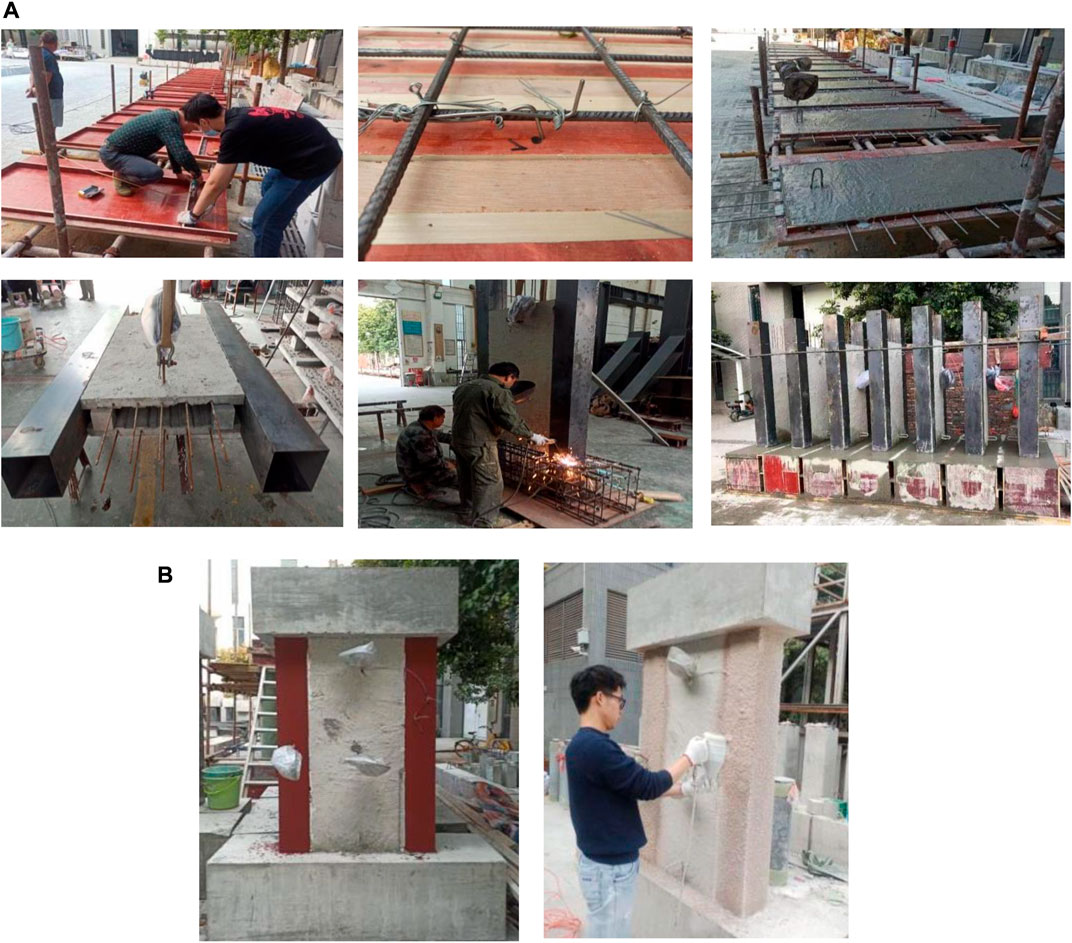
FIGURE 3. Production process of specimens: (A) Concrete pouring of specimens; (B) Construction procedure of fire-retardant coating.
A variable of this test was the application of a 20 mm thick fire-retardant coating to the outer surface of the square steel tube. The fire-retardant coating was applied by the spray construction method. Before spraying the fire-retardant coating, the rust spots on the surface of steel tubes needed to be cleaned, and then the anti-rust primer was applied, and the primer was brushed after the anti-rust primer was thoroughly dried, and then the fire-retardant coating was sprayed. Fire-retardant coating and water were mixed in proportion of 1:1 for 5–10 min and sprayed on the surface of steel tube with a portable spray gun. First, the first layer of fire-retardant coating with a thickness of about 10 mm was sprayed on the surface of steel tubes, and then the second layer of fire-retardant coating with a thickness of about 10 mm was sprayed after an interval of 24 h. Finally, the total thickness of fire-retardant coating on the surface of steel tubes was 20 mm, as shown in Figure 3B.
2.4 Determination of axial compression ratio
The difference between the old and new concrete in this test is 32.3 MPa. The cube combined compressive strength of self-compacting concrete and waste concrete is defined as the average value of the calculated results of Eqs. 1,2 given by Wu et al. (2015).
In the above equations, fcu1 and fcu2 are the cube compressive strengths of self-compacting concrete and waste concrete on the test day, respectively; η is defined as the ratio of the mass of waste concrete to the mass of all concrete in the specimen.
The conversion formula between the axial compressive strength of concrete and the cube compressive strength is calculated as
where for ordinary concrete of grade C50 and below, αc is taken as 0.76; for concrete of grade C100, αc is taken as 0.86; the values between them are taken as linear values.
For composite shear walls, the experimental axial compression ratio is given by Hou et al. (2019):
where N is the applied vertical load on the wall; Ac1 is the cross-sectional area of the precast concrete; fc1 is the axial compressive strength of the precast concrete; Ac2 is the cross-sectional area of the cast-in-place concrete; fc2 is the axial compressive strength of the cast-in-place concrete; As and fy are the cross-sectional area and yield strength of the concealed column steel tube, respectively.
2.5 Instrumentation and measurement content
2.5.1 Instrumentation
The dimensions of the furnace chamber were 4 m × 3 m×2.2 m. The maximum load capacity of the reaction frame above the furnace was 1,800 kN, and a 200-t pressure sensor was set between the jack and the steel distribution beam for real-time monitoring of the vertical load during the test. The test setup is shown in Figure 4.
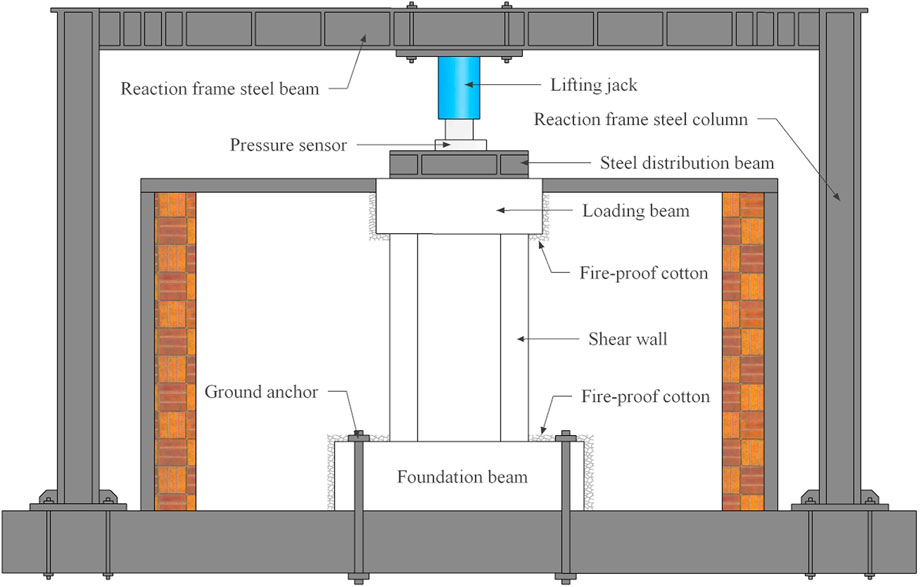
FIGURE 4. Test setup.
During the fire resistance test, two layers of fireproof cotton were wrapped around the concrete surfaces of the loading beam and foundation beam to ensure that the loading beam and foundation beam would not be damaged throughout the test. The left and right sides of the specimen were wrapped with two layers of fireproof cotton to ensure that both sides of the shear wall were exposed to fire. The fire protection treatment of specimens is shown in Figure 5.
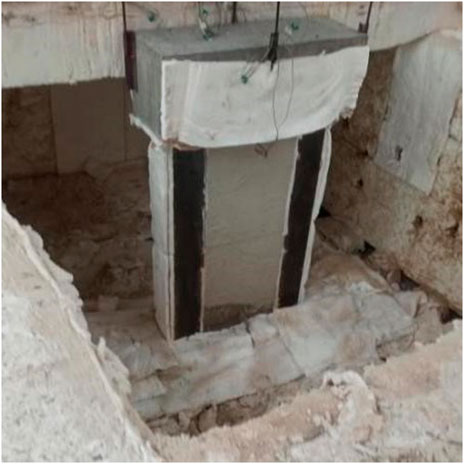
FIGURE 5. Fire protection treatment of specimens.
After the specimen was installed, the furnace cover was closed first, then the gap between the cover and the specimen was filled with fireproof cotton to make the furnace in a closed state, and then the steel distribution beam, pressure sensor and other experimental instruments were installed. Before the test, the specimen was preloaded to 30% of the set load, and then unloaded, with the purpose of compacting the specimen and checking whether the displacement meter reading was stable and normal. Subsequently, the load was gradually applied to the set value and the load was maintained for 10 min. After the load and displacement were stabilized, the furnace was ignited. The average temperature inside the furnace was strictly controlled according to the ISO-834 standard fire temperature-time curve. A dead-load heating path was used in the test. During the test, the magnitude of the load applied by the jack was monitored in real time by the pressure sensor. If necessary, the magnitude of the load was adjusted appropriately so that the load varied within ± 5% of the set load.
2.5.2 Layout of measured points
The main components of this test include the axial deformation of the specimen, the temperature field of the specimen, and the heating curve in the test furnace. Vertical displacement meters were set around the top of the loading beam to measure the axial deformation of the shear wall during the test. The layout of the displacement meters is shown in Figure 6.
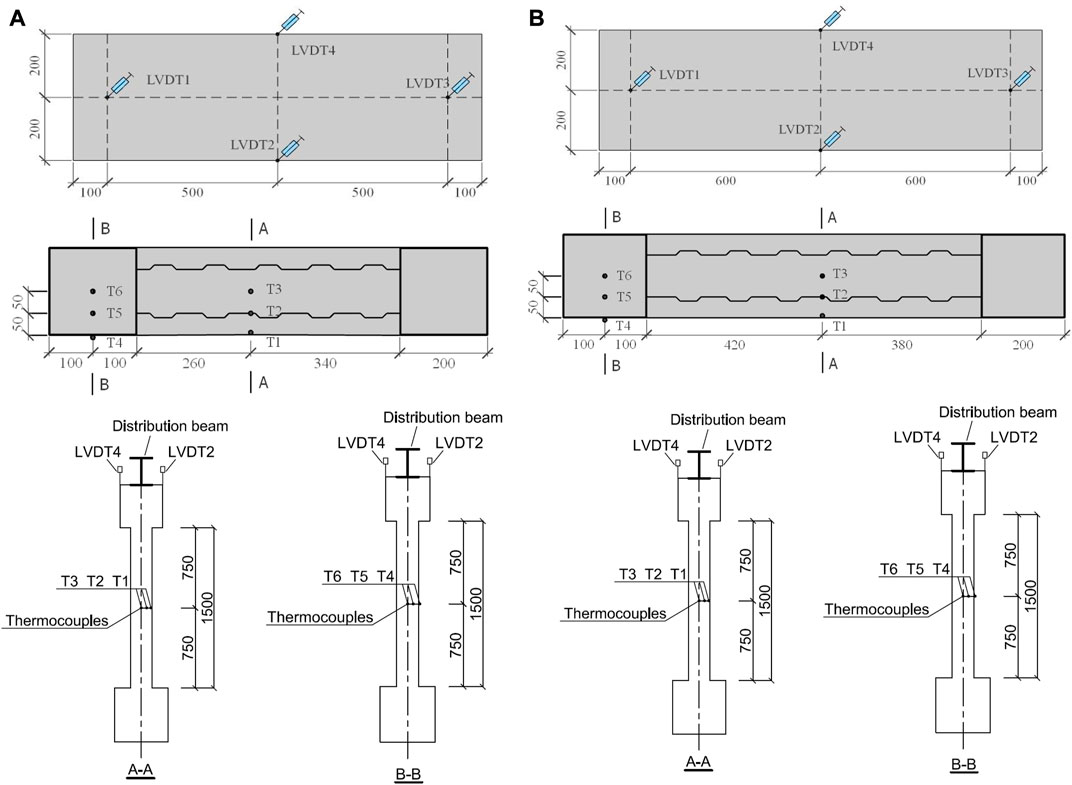
FIGURE 6. Arrangements for instrumentations of (A) SW1 and SW2; (B) SW3 (unit: mm).
Thermocouples were embedded at 1/2 height section of the specimen to measure the internal temperature field of the specimen. Six thermocouples were embedded inside each of specimens SW1∼SW3, where thermocouple T1 was located at the inner side of the precast wall and the distance from the fire surface was about 5 mm; thermocouple T2 was about 50 mm from the fire surface; thermocouple T3 was about 100 mm from the fire surface; thermocouple T4 was close to the outer wall of the square steel tube; thermocouple T5 was located at the midpoint of the line from the center of the core concrete to the outer wall of the square steel tube; thermocouple T6 was located at the center of the core concrete of the edge-constrained steel tube. The layout of the thermocouples is shown in Figure 6.
3 Experimental results and analysis
3.1 Test phenomenon
3.1.1 Specimen SW1
When the test of specimen SW1 began, the gauge reading of the pressure sensor rose slowly, so it was necessary to continuously adjust the hydraulic jack oil pressure to ensure that the axial pressure remained constant during the test. After the test lasted for 80 min, the pressure gauge reading stabilized. During the test, water vapor flowed out from the upper part of the loading beam. After 180 min of ignition, the specimen was in the expansion stage and was able to withstand the predetermined axial pressure stably. Considering that the specimen had reached the first-class fire resistance limit standard and the horizontal fire resistance test furnace was close to the safe burning time limit, the burning was stopped and the test was terminated.
After the test, it was found that the concrete surfaces of the specimens were all light yellow in color. The concrete spalling on one side of the specimen was serious, the horizontal and vertical reinforcement in the precast wall on the surface was exposed and bulged out, and the precast wall was separated from the cavity. On the concrete surface of the other side of the specimen, a coarse horizontal crack and several small turtle cracks without distribution pattern appeared, but there was no concrete spalling and reinforcement exposure. The outer surface of the square steel tube was dark black. Due to the long fire time, the oxidation layer on the outer surface of the steel tube was obviously flaking off and the steel tube appeared to be seriously bent. The failure mode of specimen SW1 is shown in Figure 7.
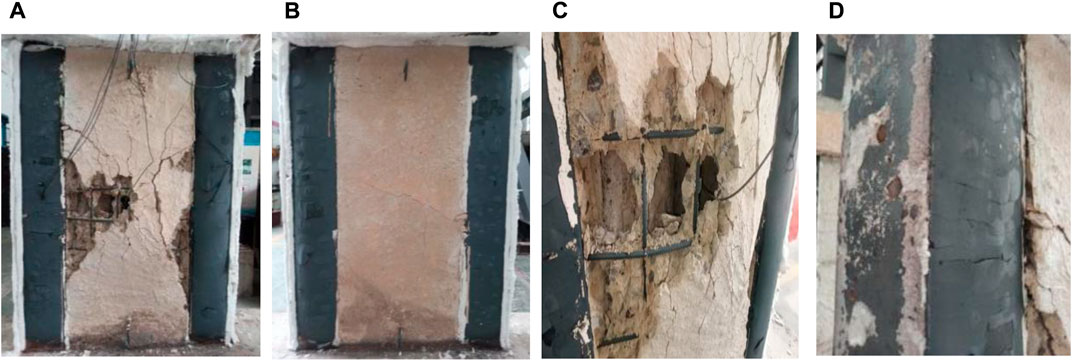
FIGURE 7. Specimen SW1 after fire test: (A) front; (B) back; (C) stripping of concrete in the wall and exposed reinforcing steel; (D) buckling of the concealed column steel tube and oxidation layer on the steel tube surface.
3.1.2 Specimen SW2
After the high temperature test started, the specimen SW2 was heated and expanded, and the pressure gauge reading slowly increased. During the test, the oil pressure of the hydraulic jack was continuously adjusted to keep the axial pressure from changing during the test. When the specimen was exposed to fire for 90 min, the hydraulic jack leaked oil and was reloaded after repair. Loading was completed at about 100 min, and the pressure gauge reading stabilized. During the test, water vapor flowed out of the upper part of the loading beam. After 180 min of ignition, the specimen did not fail and was still stable to the intended axial pressure. Considering that the specimen had reached the first-class fire resistance limit standard and the horizontal fire resistance test furnace was close to the safe burning time limit, the burning was stopped and the test was terminated.
At the end of the flame test, when the temperature cooled to room temperature and the furnace lid was opened, it was observed that the fire-retardant coating of the specimen had peeled off (but it can be seen from Figure 11B that the temperature field of the square steel tube cross-section did not rise rapidly throughout the open flame test. Therefore, the peeling of the fire-retardant coating occurred after the test, probably due to the vibration when the furnace lid was opened.). The concrete surface of the specimen was light yellow after the fire. The concrete on one side of the specimen near the steel tube was heavily spalled, horizontal and vertical reinforcement was exposed, and the precast walls on this side was bulging. On the other side of the specimen, several small cracks with irregular distribution appeared on the concrete surface, and the concrete surface of the wall tended to spall, but no reinforcement was exposed. Since the outer surface of the steel tube was coated with fire-retardant coating, the steel tube did not bulge and the surface was relatively flat. The failure mode of specimen SW2 is shown in Figure 8.
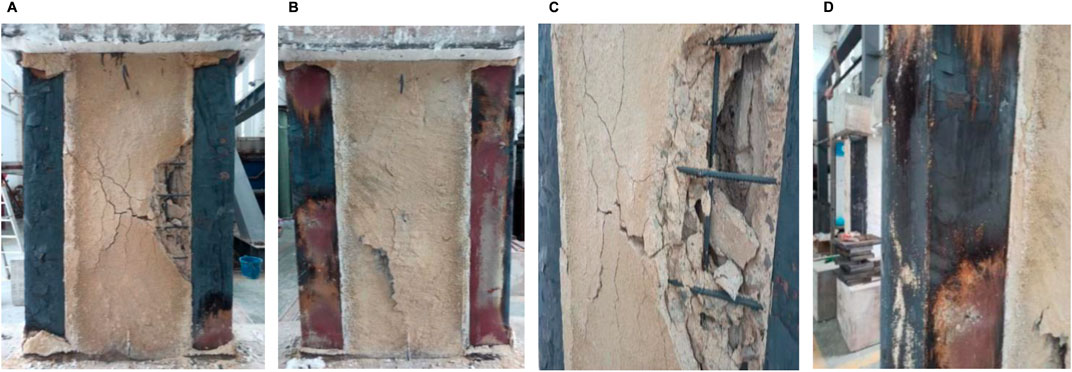
FIGURE 8. Specimen SW2 after fire test: (A) front; (B) back; (C) stripping of concrete in the wall and exposed reinforcing steel; (D) buckling of the concealed column steel tube and oxidation layer on the steel tube surface.
3.1.3 Specimen SW3
After the high temperature test started, the specimen SW3 was heated and expanded, and the pressure gauge reading of the pressure sensor rose slowly. To ensure that the specimen was subjected to constant axial pressure during the test, the oil pressure of the hydraulic jack needed to be continuously adjusted. After the test lasted for 80 min, the pressure gauge reading stabilized. During the test, water vapor could be observed to spill out from above the loading beam. After 180 min of ignition, the specimen was still in the expansion stage and could also steadily withstand the predetermined axial pressure. Considering that the specimen had reached the first-class fire resistance limit standard and the horizontal fire resistance test furnace was close to the safe burning time, the burning was stopped and the test was terminated.
After the fire test, when the temperature cooled to room temperature and the furnace lid was opened, the concrete of the specimen was observed to be light yellow after the fire. There were several small cracks on the concrete surface of the precast walls on both sides of the specimen, but no spalling occurred. The horizontal and vertical reinforcement of the precast walls were not exposed. The outer surface of the steel tube of the concealed column was dark black. Due to the prolonged fire, the oxidation layer on the outer surface of the steel tube was significantly spalled off and the steel tube was severely bent. The failure mode of specimen SW3 is shown in Figure 9.
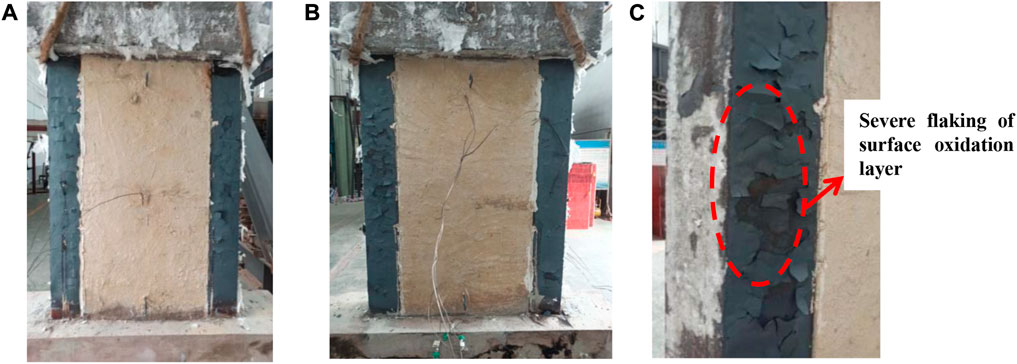
FIGURE 9. Specimen SW3 after fire test: (A) front; (B) back; (C) buckling of the concealed column steel tube and oxidation layer on the steel tube surface.
3.2 Temperature field analysis
3.2.1 Furnace temperature
Figure 10 shows the measured average air temperature-burning time curves in the furnace chamber for three specimens compared to the ISO-834 standard temperature rise curve. It can be seen from the figure that the measured heating curves of the three specimens are basically consistent with the standard fire temperature-time curve.
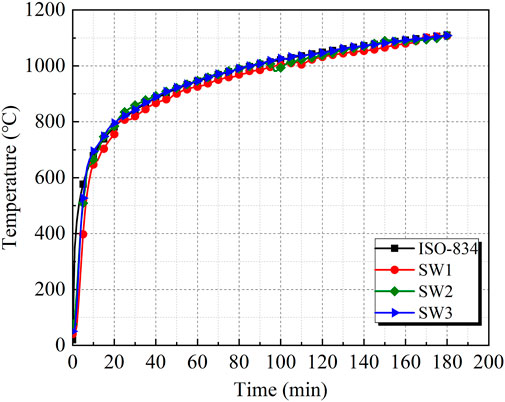
FIGURE 10. Comparison of the temperature-time curves measured in the furnace with the ISO-834 standard curve.
3.2.2 Temperature field of each measured point of the same specimen
The temperature-time curves of six measured points during the test of specimens SW1 to SW3 are shown in Figure 11. It can be seen from the figure that:
(1) The temperature of each measured point of the three specimens increased with the increase of ignition time. In the same section, the measured concrete temperature gradually decreased as the depth of the measured point increased. Most of the measured points located in the concrete had the same trend of temperature profile. When the temperature was between 100°C and 150°C, there was a significant temperature plateau, which was caused by the evaporation and heat absorption of water in the concrete. The duration of the temperature platform was longer at measured points T3 and T6 than at T2 and T5, because the farther the measured point was from the fire surface, the greater the vapor escape force and the longer it took.
(2) The temperatures of measured points T1 and T4 of specimen SW1 showed a trend of first fast and then slow, which was similar to the law of furnace temperature rise. At the beginning of the open fire test, the temperatures of measured points T5 and T6 in the concealed column were higher than the temperatures of measured points T2 and T3 at the same locations in the wall. This was because the thermal conductivity of steel was larger than that of concrete, and the temperature transfer of steel was faster than that of concrete. 120 min later, the temperature rise of measured point T2 was accelerated, which was due to the synergistic effect of fire and external load, the reinforcement in the precast wall bulged, the precast wall separated from the cavity, and the concrete surface on one side of the measured point began to produce coarse cracks and partial concrete spalling, resulting in the accelerated temperature rise of T2. 105 min later, the temperature rise rate of the measured point T3 accelerated, and finally the temperature curve of measured point T2 almost overlapped with that of measured point T3. The reason was that the measured point T3 was located in the demolished concrete lumps and self-compacting concrete, and the water vapor in C60 self-compacting concrete could not be released quickly at high temperature, and the internal vapor pressure was large, which started to burst at 380°C–458°C (Anagnostopoulos et al., 2009), leading to the gradual dislodgement of the self-compacting concrete around measured point T3. After 125 min, the measured points T2 and T3 were exposed to the same air temperature, so the measured temperatures were the same.
(3) The temperatures of measured points T1 to T3 of specimen SW2 were similar to those of specimen SW1, except that the self-compacting concrete cavity in the wall section began to burst at 150 min, resulting in an accelerated rise in temperature at measured point T3. The temperatures of measured points T4, T5 and T6 at the square steel tube section were lower than those of measured points T1, T2 and T3 at the same location of the wall. This was because the outer surface of the square steel tube of specimen SW2 was sprayed with fire-retardant coating, and the temperature rising rate of measured points of the square steel tube decreased.
(4) The temperature rising pattern of each measured point of specimen SW3 was basically the same as that of specimen SW1, but the temperature rise rate of measured points T2 and T3 of specimen SW3 was not faster than that of specimen SW1. This was because the specimen SW3 was more intact after the fire and there was no concrete spalling or exposed reinforcement. In the late stage of the fire, the temperature difference between the measured point T5 of the concealed column section and measured point T2 at the same location of the wall section was the same as that between measured point T6 and measured point T3, which was about 50°C.
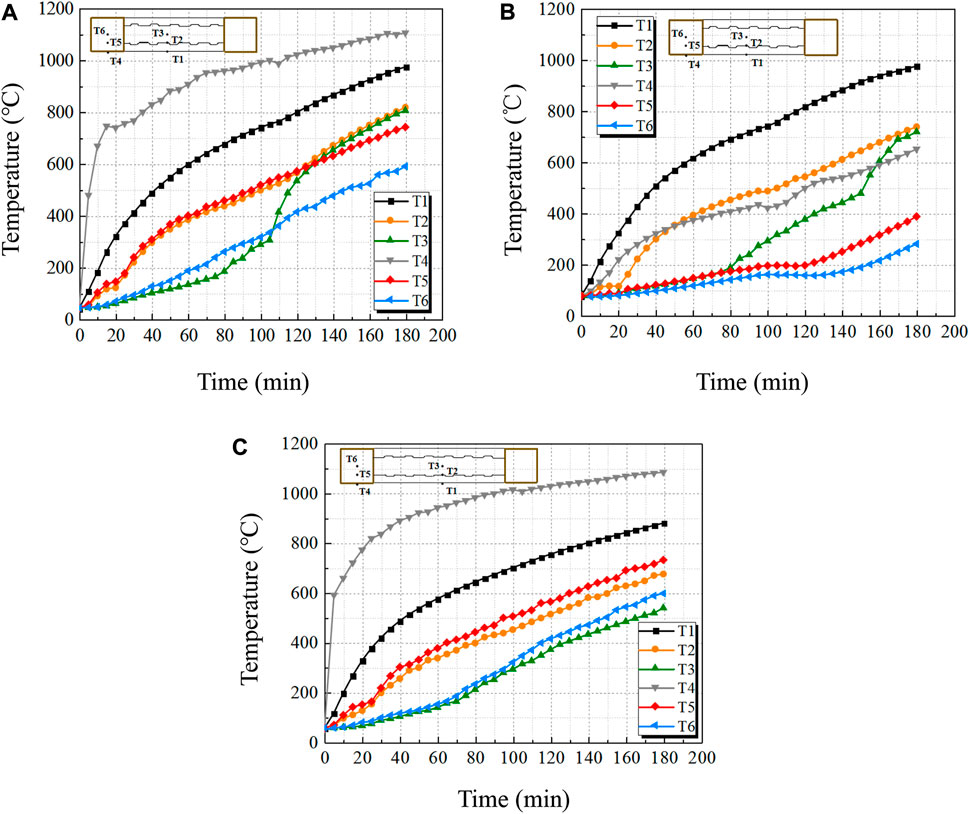
FIGURE 11. Temperature-time curves of (A) SW1; (B) SW2; (C) SW3.
3.2.3 Temperature fields of different specimens at the same measured point
Figure 12 shows the temperature-time comparison graphs for the same measured points of specimens SW1 to SW3. It can be seen from the figure that the temperature rise at the measured points T1 to T3 is essentially the same for all three specimens. However, specimen SW1 had the most severe concrete spalling, bursting and reinforcement bulging, followed by specimen SW2, while specimen SW3 was the most intact. Therefore, the highest temperatures were observed at the measured points T2 and T3 of specimen SW1 and the lowest temperatures were observed at specimen SW3 during the last stage of fire exposure. The temperature comparison of the three measured points T4, T5 and T6 of the concealed column section shows that increasing the wall width-to-depth ratio had little effect on the temperature of the concealed column section, and the setting of the fire-retardant coating made the temperature of measured point T4 on the outer surface of the steel tube and the temperature of measured points T5 and T6 of concrete of the specimen SW2 lower than those of specimens SW1 and SW3. At 180 min, the temperature of the measured point T4 on the outer surface of the steel tube of the specimen SW2 was about 450°C lower than that of specimens SW1 and SW3, and the temperature of measured point T5 and T6 in the concrete was about 350°C lower.
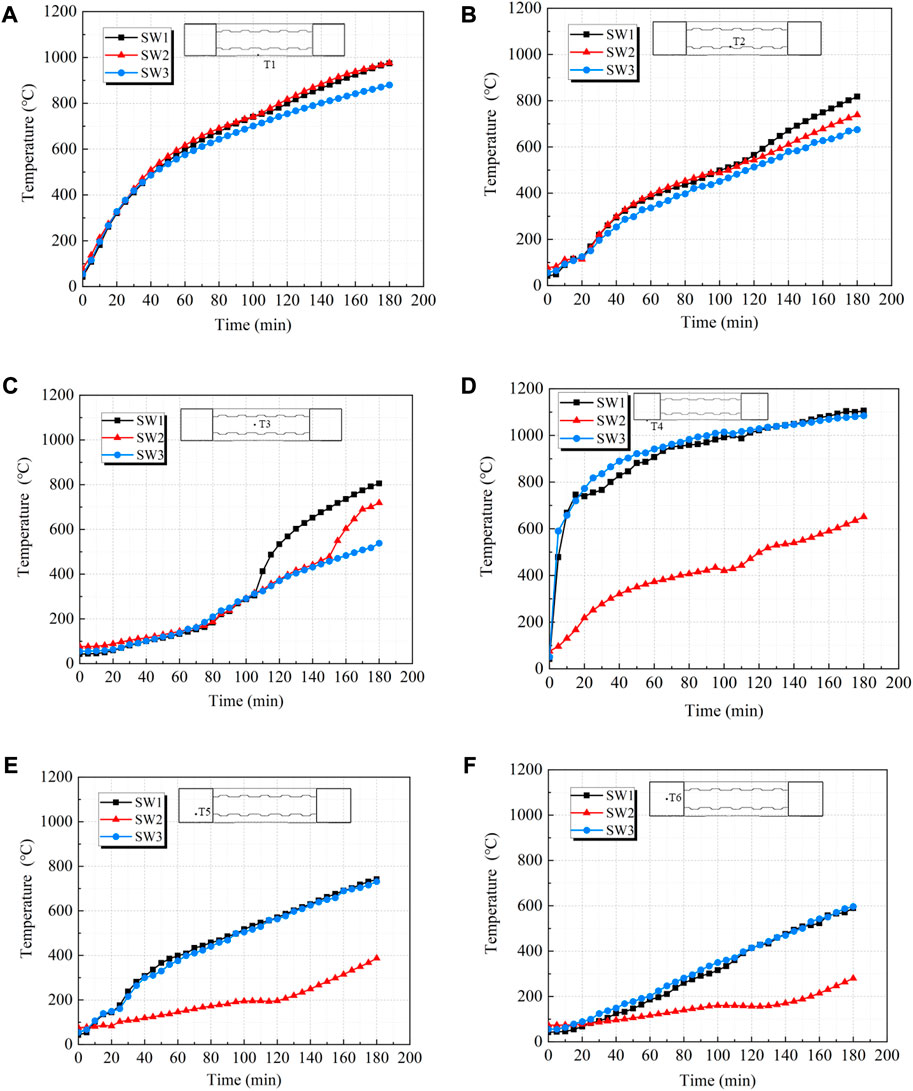
FIGURE 12. Temperature-time curves of different specimens at the same measured point: (A) T1; (B) T2; (C) T3; (D) T4; (E) T5; (F) T6.
3.3 Analysis of axial deformation
The measured axial deformation-burning time curves of the specimens are shown in Figure 13. For the axial deformation, the expansion deformation of the specimen is positive, while the compression deformation is negative. The axial displacement of the specimen is the average of the displacement values measured by the four vertical displacement gauges. It can be seen from the test results that:
(1) In the open fire test, all three specimens were exposed to fire on both sides. The deformation of the specimens was in the expansion stage and there was no compression. At an axial compression ratio of 0.19, the deformation values were far below the damage limit of shear wall bearing capacity, indicating that the three specimens had good fire resistance performance.
(2) The change patterns of axial displacement of specimens SW1 and SW3 were basically the same. Taking specimen SW1 as an example, the expansion deformation of specimen SW1 gradually increased within 80 min after ignition, and the axial deformation did not change much from 80 to 150 min. The expansion deformation peaked at 150 min and 160 min for both specimens, respectively, and the peak expansion deformation was comparable for both specimens, after which the expansion deformation value decreased slightly. The maximum expansion deformation of specimen SW1 was about 3.04 mm in 150 min from the beginning of ignition to the end of combustion, while the maximum expansion deformation of specimen SW3 was about 2.88 mm in 160 min. There was no significantly different in the maximum displacements of the two specimens. The main reasons were the large surplus of end-restrained column and wall bearing capacity in the case of relatively small loads, as well as the loading beam that played a role in load redistribution. It can be seen that increasing the wall width-to-depth ratio had little effect on the axial deformation of specimens.
(3) After 90 min of fire, the specimen SW2 was suspended for 10 min due to oil leakage from the hydraulic jack. At this point, the axial deformation increased by nearly 3 mm. After repair and reassembly, the specimen was still in the expansion deformation stage. During the 180 min from the start of ignition to the end of combustion (excluding the 10 min of test suspension), the maximum deformation of specimen SW2 during 140 min was about 2.07 mm, which was smaller than that of specimen SW1. This indicates that the expansion of SW2 during the test was smaller than that of SW1. The main reason was that the fire-retardant coating was set on the outer surface of the steel tube of the concealed column, which slowed down the heat transfer to the concealed column section and reduced the expansion of the concealed column section.
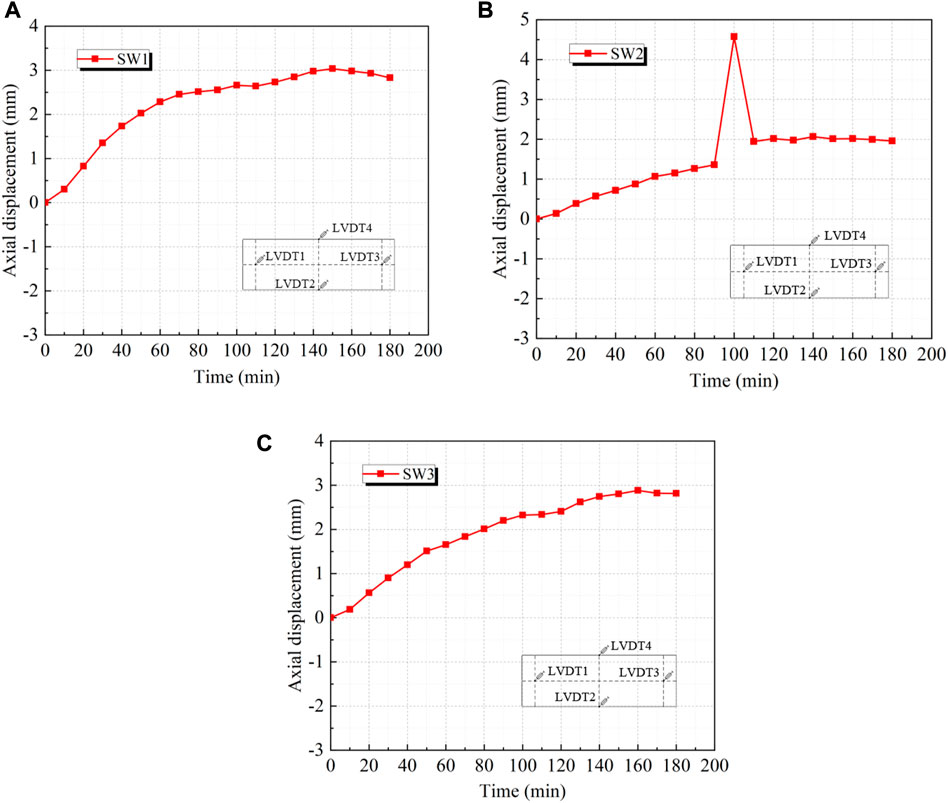
FIGURE 13. Vertical deformation-time curves of (A) SW1; (B) SW2; (C) SW3.
4 Summary and conclusion
This paper discusses the fire performance of composite shear walls filled with DCLs and SCC restrained by the edges of concrete-filled square steel tubes. Three specimens of composite shear walls filled with DCLs and SCC were fabricated and tested for fire resistance on both sides. The effects of steel tube fire-retardant coating and the wall width-to-depth ratio on temperature field, axial deformation and fire resistance limit of composite shear walls under constant axial pressure ratio were investigated. The experimental results and analysis support the following conclusions.
(1) The phenomena of the three specimens after fire were not the same. The test results showed that concrete of the specimens without fire-retardant coating and with fire-retardant coating had different degrees of spalling and bursting, but the shear wall steel tube with fire-retardant coating was smoother than the steel tube without fire-retardant coating. With the increase of the wall width-to-depth ratio, the steel tube had bulging phenomenon, but the concrete did not spall and showed reasonable fireproof performance.
(2) The temperature change trends in the wall section of the three specimens were generally consistent. Spraying fire-retardant coating on the outer surface of the steel tube had a significant effect on the temperature of the steel tube section, while increasing the wall width-to-depth ratio of the wall had little effect on the temperature of the steel tube section.
(3) At the axial compression ratio of 0.19, all three specimens were in the expansion stage during the fire resistance test. The expansion deformation of the shear wall with fire-retardant coating on the outer surface of the steel tube was smaller than that without fire-retardant coating, while increasing the wall width-to-depth ratio had little effect on the axial deformation of the composite shear wall filled with DCLs and SCC at high temperature.
Overall, the composite shear walls filled with DCLs and SCC were able to withstand the intended axial loads stably for 180 min and had good fire resistance. This paper provides a preliminary discussion on the fire resistance of composite shear walls filled with DCLs and SCC, only the fire-retardant coating of steel tubes and the wall width-to-depth ratio on the fire resistance of composite shear walls on both sides were experimentally studied, but there are still some issues to be further investigated. And due to the limitation of the bearing capacity of the test equipment, only the fire resistance of the shear wall with an axial compression ratio of 0.19 was tested in this paper, and the fire resistance of the shear wall with larger axial compression ratio is subject to further study.
Data availability statement
The original contributions presented in the study are included in the article/supplementary material, further inquiries can be directed to the corresponding author.
Author contributions
YX contributed to the overall concept, the methodology, the funding acquisition, the supervision, the writing-review and editing. YC contributed to the data curation, the investigation, and writing original draft. BW contributed to the conceptualization, the project administration, the investigation, the writing-review and editing. GZ contributed to the conceptualization, the data curation, the investigation, and the validation.
Funding
This work was supported by National Key R&D Program of China during the 13th 5-year Plan Period (2017YFC0703303), National Natural Science Foundation of China (51878298), Natural Science Foundation of Guangdong Province (2021A1515012606), and Guangdong Provincial Key Laboratory of Modern Civil Engineering Technology (2021B1212040003).
Conflict of interest
The authors declare that the research was conducted in the absence of any commercial or financial relationships that could be construed as a potential conflict of interest.
Publisher’s note
All claims expressed in this article are solely those of the authors and do not necessarily represent those of their affiliated organizations, or those of the publisher, the editors and the reviewers. Any product that may be evaluated in this article, or claim that may be made by its manufacturer, is not guaranteed or endorsed by the publisher.
References
Anagnostopoulos, N., Sideris, K. K., and Georgiadis, A. (2009). Mechanical characteristics of self-compacting concretes with different filler materials, exposed to elevated temperatures. Mat. Struct. 42 (10), 1393–1405. doi:10.1617/s11527-008-9459-6
Bamonte, P., Felicetti, R., Kalaba, N., Lo Monte, F., Pinoteau, N., Miah, M. J., et al. (2016). On the structural behavior of reinforced concrete walls exposed to fire. Key Eng. Mat. 711, 580–587. doi:10.4028/www.scientific.net/kem.711.580
Chen, J., Hamed, E., and Gilbert, R. (2020). Structural performance of reinforced concrete walls under fire conditions. J. Struct. Eng. (N. Y. N. Y). 146, 04020006. doi:10.1061/(asce)st.1943-541x.0002519
Du, E., Shu, G., Qin, L., Lai, B., Zhou, X., and Zhou, G. (2022). Experimental investigation on fire resistance of sandwich composite walls with truss connectors. J. Constr. Steel Res. 188, 107052. doi:10.1016/j.jcsr.2021.107052
Go, C., Tang, J., Chi, J., Chen, C., and Huang, Y. (2012). Fire-resistance property of reinforced lightweight aggregate concrete wall. Constr. Build. Mat. 30, 725–733. doi:10.1016/j.conbuildmat.2011.12.081
Hertz, K. D. (2018). Fire resistance of concrete walls with light aggregate. J. Struct. Fire Eng. 9 (4), 319–341. doi:10.1108/jsfe-11-2017-0043
Hou, H., Fu, W., Qiu, C., Cheng, J., Qu, Z., Zhu, W., et al. (2019). Effect of axial compression ratio on concrete-filled steel tube composite shear wall. Adv. Struct. Eng. 22 (3), 656–669. doi:10.1177/1369433218796407
Jian, S., and Wu, B. (2021). Compressive behavior of compound concrete containing demolished concrete lumps and recycled aggregate concrete. Constr. Build. Mat. 272, 121624. doi:10.1016/j.conbuildmat.2020.121624
Kang, J., Yoon, H., Kim, W., Kodur, V., Shin, Y., and Kim, H. (2016). Effect of wall thickness on thermal behaviors of RC walls under fire conditions. Int. J. Concr. Struct. Mat. 10, 19–31. doi:10.1007/s40069-016-0164-5
Kang, J. Y., Yoon, H. A., Ryu, E. M., and Shin, Y. S. (2019). Analytical studies for the effect of thickness and axial load on load bearing capacity of fire damaged concrete walls with different sizes. J. Struct. Integr. Maintenance 4 (2), 58–64. doi:10.1080/24705314.2019.1603189
Kumar, P., and Kodur, V. K. R. (2017). Modeling the behavior of load bearing concrete walls under fire exposure. Constr. Build. Mat. 154, 993–1003. doi:10.1016/j.conbuildmat.2017.08.010
Lee, C., Lee, S., and Kim, H. (2013). Experimental observations on reinforced concrete bearing walls subjected to all-sided fire exposure. Mag. Concr. Res. 65 (2), 82–92. doi:10.1680/macr.12.00013
Limbachiya, M. C., Marrocchino, E., and Koulouris, A. (2007). Chemical–mineralogical characterisation of coarse recycled concrete aggregate. Waste Manag. 27 (2), 201–208. doi:10.1016/j.wasman.2006.01.005
Liu, G., Song, Y., and Qu, F. (2010). Post-fire cyclic behavior of reinforced concrete shear walls. J. Cent. South Univ. Technol. 17, 1103–1108. doi:10.1007/s11771-010-0603-4
Morita, T., Yamashita, H., Beppu, M., and Suzuki, M. (2017). “A study on structural behavior of reinforced concrete walls exposed to hydrocarbon fire under vertical load,” in Fire sci. Technol. Editors K. Harada, K. Matsuyama, K. Himoto, Y. Nakamura, and K. Wakatsuki, 299–308. doi:10.1007/978-981-10-0376-9_30
Mueller, K. A., and Kurama, Y. C. (2019). Numerical modeling of three reinforced concrete bearing wall tests subject to one-sided standard fire. ACI Struct. J. 116 (5), 29–41. doi:10.14359/51716756
National Standards of the People's Republic of China. Metallic materials-tensile testing. GB/T 228, 1–2010. (in Chinese).
Ngo, T., Fragomeni, S., Mendis, P., and Ta, B. (2013). Testing of normal- and high-strength concrete walls subjected to both standard and hydrocarbon fires. ACI Struct. J. 110 (3), 503–510. doi:10.14359/51685607
Nguyen, K. T., Ngo, T. D., Mendis, P., and Heath, D. (2018). Performance of high-strength concrete walls exposed to fire. Adv. Struct. Eng. 21, 1173–1182. doi:10.1177/1369433217732500
Ni, S., and Birely, A. C. (2018). Impact of physical seismic damage on the fire resistance of reinforced concrete walls. Constr. Build. Mat. 182, 469–482. doi:10.1016/j.conbuildmat.2018.06.120
Pavese, A., and Bournas, D. A. (2011). Experimental assessment of the seismic performance of a prefabricated concrete structural wall system. Eng. Struct. 33 (6), 2049–2062. doi:10.1016/j.engstruct.2011.02.043
Ryu, E., Kim, H., Chun, Y., Yeo, I., and Shin, Y. (2020). Effect of heated areas on thermal response and structural behavior of reinforced concrete walls exposed to fire. Eng. Struct. 207, 110165. doi:10.1016/j.engstruct.2020.110165
Wang, T., Wang, X., Wang, L., Au-Yong, C. P., and Ali, A. S. (2021). Assessment of the development level of regional industrialized building based on cloud model: A case study in Guangzhou, China. J. Build. Eng. 44, 102547. doi:10.1016/j.jobe.2021.102547
Wei, F., Zheng, Z., Yu, J., and Wang, Y. (2019). Structure behavior of concrete filled double-steel-plate composite walls under fire. Adv. Struct. Eng. 22 (8), 1895–1908. doi:10.1177/1369433218825238
Wu, B., Peng, C., Zhao, X., and Zhou, W. (2018). Axial loading tests of thin-walled circular steel tubes infilled with cast-in-place concrete and precast segments containing DCLs. Thin-Walled Struct. 127, 275–289. doi:10.1016/j.tws.2018.02.008
Wu, B., Zhang, S., and Yang, Y. (2015). Compressive behaviors of cubes and cylinders made of normal-strength demolished concrete blocks and high-strength fresh concrete. Constr. Build. Mat. 78, 342–353. doi:10.1016/j.conbuildmat.2015.01.027
Keywords: composite shear walls, fire performance, demolished concrete lumps, self-compacting concrete, experimental study
Citation: Xiong Y, Chen Y, Wu B and Zhao G (2022) Fire resistance of composite shear walls filled with demolished concrete lumps and self-compacting concrete. Front. Mater. 9:1007868. doi: 10.3389/fmats.2022.1007868
Received: 31 July 2022; Accepted: 28 September 2022;
Published: 11 October 2022.
Edited by:
Zhigang Zhang, Chongqing University, ChinaReviewed by:
Shan Gao, Harbin Institute of Technology, ChinaYifei Hao, Hebei University of Technology, China
Jiangtao Yu, Tongji University, China
Copyright © 2022 Xiong, Chen, Wu and Zhao. This is an open-access article distributed under the terms of the Creative Commons Attribution License (CC BY). The use, distribution or reproduction in other forums is permitted, provided the original author(s) and the copyright owner(s) are credited and that the original publication in this journal is cited, in accordance with accepted academic practice. No use, distribution or reproduction is permitted which does not comply with these terms.
*Correspondence: Bo Wu, Ym93dUBzY3V0LmVkdS5jbg==