 Baojun Li1,2
 Jinlong Jiang
- 1College of Civil Engineering and Architecture, Guangxi University, Nanning, China
- 2Guangxi Transportation Science and Technology Group Co., Ltd., Nanning, China
- 3School of Civil Engineering, Chongqing Jiaotong University, Chongqing, China
- 4School of River and Ocean Engineering, Chongqing Jiaotong University, Chongqing, China
Using ultra-high performance concrete (UHPC) as the pavement layer on the orthotropic steel deck (OSD) can greatly enhance the rigidity to solve the fatigue cracking of the steel deck and the resulting damage to the pavement layer. However, the thin UHPC layer limits the extensive use of the short stud connector. In this study, three types of interfaces were designed by introducing different additives into the epoxy matrix, and the shear properties of each interface and short stud connector were compared. Then, the influence of short stud connectors and optimized interface on the composite bridge deck’s bending property was analyzed through the composite bridge deck’s bending test. Moreover, the mechanical behavior of the interface in the composite bridge deck is discussed based on the finite element model. The results show that the ultimate load of the composite bridge deck with the optimized interface is reduced by 21.5% compared with that of the composite bridge deck with the short stud connector. However, the composite bridge deck with the optimized interface has higher bending stiffness before failure and is less affected by cyclic loading. Moreover, the composite bridge deck with the optimized interface is unsuitable for cyclic loading conditions when the defect area reaches 30%. Finally, the numerical simulation of the composite bridge deck with the optimized interface is successfully realized based on the cohesive zone model, and the applicability of the interface in the composite bridge deck is verified.
1 Introduction
Orthotropic steel bridge deck (OSD) has become the bridge deck form of large-span steel bridges because of its outstanding advantages, such as lightweight, high bearing capacity, and fast construction (Alavi et al., 2017; Freitas et al., 2017). However, insufficient stiffness of OSD can easily lead to fatigue cracking of the steel bridge deck (Fu et al., 2019) and pavement damage (Wang et al., 2020) under the coupling effect of the reciprocating vehicle and external environmental factors. Therefore, the OSD can be paved with high- performance concrete (Zhang et al., 2020; Zou et al., 2021a; Zhang et al., 2021; Jiang et al., 2022; Zhang et al., 2022) to increase its stiffness of the OSD. Ultra-high performance concrete (UHPC), a new type of steel fiber reinforced concrete (Hung et al., 2021), has good fluidity (minimum slump is 200–250 mm (Alkaysi and El-Tawil, 2017)), high strength (compressive strength greater than 120 MPa (Zhu et al., 2020), tensile strength greater than 5 MPa (Meng and Khayat, 2017)), impact resistance (Wu et al., 2019) and excellent durability (Charron et al., 2008). Under the excellent mechanical properties of UHPC, the stiffness of OSD is significantly enhanced, and the thin pavement thickness can also ensure the crack resistance of the pavement layer, thereby realizing the light weight of the steel deck and improving the durability and service life of the steel deck (Cheng et al., 2021; Feng et al., 2021; Liu et al., 2022).
As a kind of steel-UHPC composite structure, the stiffness enhancement of UHPC pavement to OSD largely depends on the composite action at the interface. The traditional stud connectors are widely used in steel-concrete composite structures due to their simple force and convenient construction (Kruszewski et al., 2019). Still, there are the following problems when applied to OSD-UHPC composite bridge deck. Welding defects and residual stresses are inevitably introduced in a large number of stud welding operations, which is unfavorable to the fatigue resistance of steel structures (Feng et al., 2021), (Zhang et al., 2016). More adversely, the shear capacity of short studs in thin UHPC pavement is insufficient to require a large number of intensive studs installed on OSD, resulting in cumbersome welding operations (Zhang et al., 2016)- (Wang et al., 2019). Given this, the use of epoxy adhesive to realize the steel-concrete bonding interface has been applied (Bouazaoui and Li, 2008). Compared with stud connectors, the steel-concrete bonding interface can make the stress transfer at the interface between steel and concrete uniform (Larbi et al., 2009)- (Kumar et al., 2018) and avoid the stress concentration caused by the discontinuous distribution of studs (Luo et al., 2012)- (Bouazaoui et al., 2007). Meanwhile, the bonding interface can realize the rapid connection between steel structure and prefabricated concrete structure, which simplifies the construction process and improves construction efficiency (Berthet et al., 2011)- (Zhao et al., 2019). However, the brittle failure of the steel-concrete bond interface cannot be ignored (Jiang et al., 2021)- (Zhan et al., 2021), and only the use of the bond interface for precast concrete structures and steel structures has obvious application advantages. To sum up, compared with the OSD-UHPC composite bridge deck with stud connectors, a suitable interface form for fresh UHPC can be sought to realize the connection between OSD and UHPC pavement. This interface form can minimize or avoid the use of stud connectors to ensure the connection performance of OSD and UHPC pavement.
Given the hidden trouble in applying stud connectors in steel-UHPC composite structures, the composite interface formed by introducing additives based on epoxy matrix appears. Sun et al. (Sun et al., 2017) designed the interface form in which limestone is uniformly arranged on the epoxy matrix, and the test proved that the interface had high bonding properties, and the tensile and shear strength could reach about 2 MPa. Wang et al. (Wang et al., 2019) designed the composite beam LEA-6.9 with limestone interface connection uniformly arranged on the epoxy matrix and beam LHS-6.9 with stud connectors. The ultimate load of beam LEA-6.9 is 6.8% lower than that of beam LHS-6.9, indicating that the composite interface can successfully replace the stud connector. Robert et al. (Robert et al., 2007) designed the interface form of copper fiber embedded in the epoxy matrix. The pull-out behavior of copper fiber from the epoxy matrix can significantly increase the interfacial strength and fracture toughness of composites. Maloney et al. (Maloney and Fleck, 2019) studied the toughening effect of copper wire mesh in the epoxy matrix on the interface properties through double cantilever beams. They confirmed that this interface form could realize a reliable connection at the interface of composite materials. In short, introducing additives into the epoxy matrix can meet the requirements of interfacial strength and can be comparable to the stud connector.
No matter what connection mode is adopted for the composite structure, the mechanical behavior of the composite structure is largely affected by the interface performance. Therefore, the interface form with excellent mechanical properties is crucial to the mechanical properties of composite structures. This study introduced different additives into the epoxy matrix to select the interface form suitable for OSD-UHPC composite bridge deck. In order to optimize the most suitable interface, the shear behavior of various interfaces was discussed through the direct shear test. Then, the influence of optimized interface and stud connectors on the bending performance of the steel-UHPC composite bridge deck was analyzed. Finally, based on the cohesive zone model, the numerical simulation of the optimized interface and stud connectors was successfully realized, and the excellent mechanical properties of the epoxy adhesive steel-UHPC composite bridge deck were verified.
2 Interface optimization
2.1 Interface design
In order to enhance the interfacial toughness of the steel-UHPC composite bridge deck, the epoxy bonding interface (EB interface), particle embedded interface (PE interface), and fiber toughening interface (FT interface) were designed in this study. Detailed information on the designed interface and specimen is shown in Figure 1. The components of the specimen can be divided into three parts: steel plate, interface, and UHPC matrix. The thickness of the steel plate in the region 50 mm away from the top increases by 5 mm to ensure that the specimen is loaded without eccentricity. The area size of the three types of interfaces is 150 mm × 150 mm, and the thickness of the epoxy matrix is 2 mm (Berthet et al., 2011), but the composition of the interface is different. The EB interface is the epoxy matrix between the steel plate and the UHPC matrix, which can realize the connection between the steel plate and the UHPC matrix through the adhesive force. The PE interface is composed of epoxy matrix and quartz sand particles. The epoxy matrix uniformly adheres to the steel plate, and the quartz sand particles are firmly embedded on the surface of the epoxy matrix and UHPC matrix. The PE interface realizes the connection between the steel plate and UHPC matrix through the adhesive force of the epoxy matrix and the embedding effect of quartz sand particles. The particle size of quartz sand is 2–3 mm. The FT interface is composed of epoxy matrix and helical fiber. The diameter of the helical fiber is 0.5 mm, the diameter of the ring is 6mm, and the longitudinal length is 150 mm. It is arranged in two rows in the transverse direction and three columns in the longitudinal direction on the epoxy matrix. The epoxy matrix uniformly adheres to the steel plate, and the helical fibers are firmly embedded in the epoxy matrix and UHPC matrix. The FT interface realizes the connection between the steel plate and the UHPC matrix through the epoxy matrix’s adhesive force and the fiber’s bridging effect. The area 50 mm from the bottom of the UHPC matrix was thickened to prevent the specimen from rollover during loading. Details of all specimens are shown in Table 1.
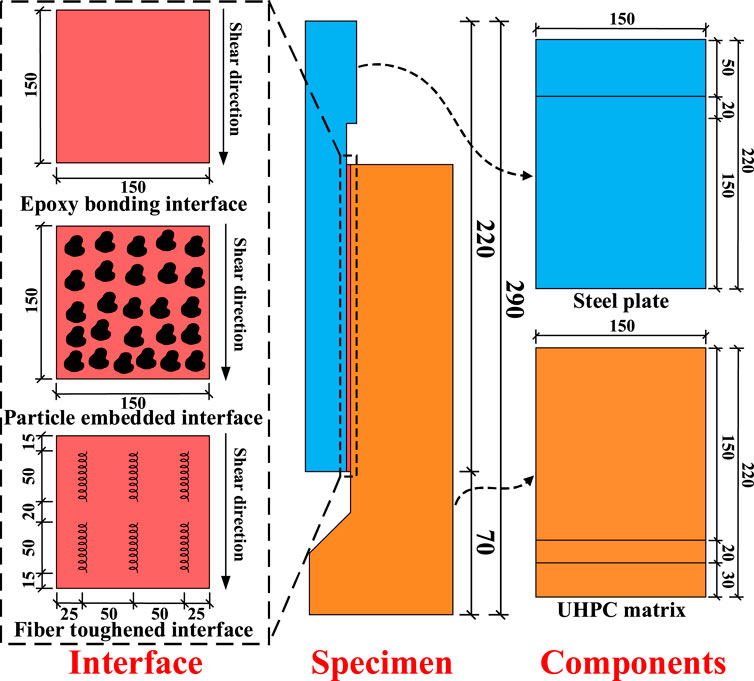
FIGURE 1. Specimen and interface design.
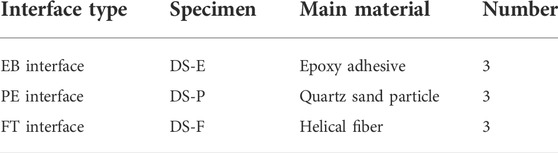
TABLE 1. Design information of specimen.
2.2 Direct shear test scheme
The specimen was loaded by an electronic universal testing machine (MTS Exceed E45.205) with a nominal bearing capacity of 200 kN. In Figure 2, the top of the steel plate of the test piece is in flat contact with the loader, and the interface center does not deviate from the center of the loader to avoid eccentric loading. The load on the specimen is measured by sensors in the loader. The two digital micrometers are symmetrically arranged at both ends of the interface, and the interface slip is the average value of the measured data. Before formal loading, it is necessary to move the beam slightly to make the loader fully in contact with the top of the steel plate to eliminate the gap caused by insufficient contact. The displacement loading method is adopted in the test, and the loading speed is 0.01 mm/s. During the loading process, the interface between the steel plate and UHPC matrix continuously slips until the final complete separation, leading to the failure of the specimen.
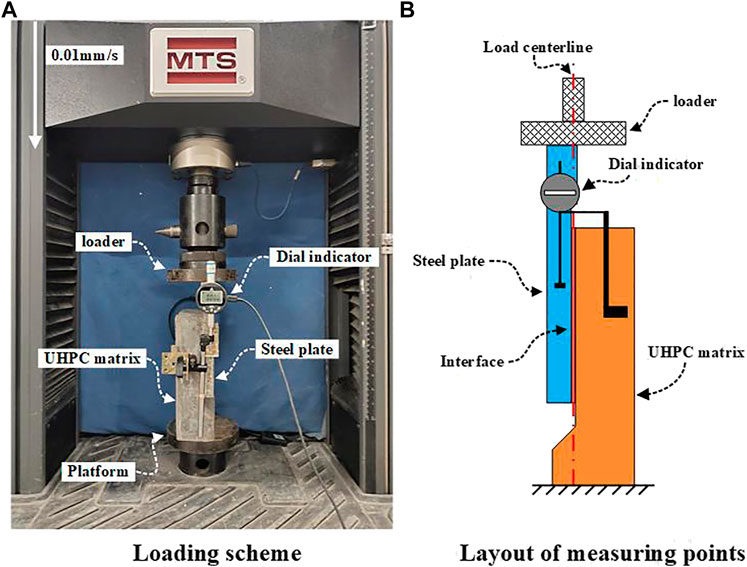
FIGURE 2. Interface test scheme. (A) Loading scheme. (B) Layout of measuring points.
2.3 Interface comparison
According to the test results, the load-slip curves of specimen DS-E, specimen DS-P, and specimen DS-F were selected to characterize the shear behavior of the three types of interfaces. In addition, the shear performance of short studs with a diameter of 13 mm and a height of 35 mm in the thin UHPC layer was additionally considered (Cao and Shao, 2019). According to the arrangement spacing of short studs in the literature, the equivalent interface area of short studs is 200 mm × 200 mm. The shear stress of the EB interface, PE interface, FT interface, and the short stud is the ratio of specimen load to interface area, and the shear stress-slip curve is shown in Figure 3.

FIGURE 3. Comparison of shear stress-slip curves between short stud connector and interface.
In Figure 3, the shear strength of the EB interface and PE interface is significantly higher than that of the FT interface and short stud connector. However, the sliding ability of the FT interface and short stud connector is much higher than that of the EB interface and PE interface. According to the shear stress-slip curve, the shear stiffness of the three types of interfaces is significantly higher than that of the short stud connector. Compared with the three types of interfaces, the shear strength of the FT interface is 1.8 MPa, much lower than the EB interface and PE interface. The shear strength of the EB interface is the largest among the three types of interfaces. Still, this interface only applies to the connection between the steel plate and the prefabricated UHPC matrix. By contrast, the shear strength of the PE interface decreases, but its stiffness exceeds that of the FT interface and the short stud connector interface, and it is suitable for connecting the steel plate with the fresh UHPC matrix. Therefore, the PE interface is applicable in the steel-UHPC composite bridge deck formed by pouring UHPC.
3 Test scheme
3.1 Specimen design
In this study, six steel-UHPC composite bridge decks of the same size were fabricated to evaluate the flexural performance of composite bridge decks with different interfaces. As shown in Figure 4, all composite deck slabs have the same structural form and reinforcement arrangement except for the interface. The overall dimension of the steel-UHPC composite bridge deck is 1,200 × 200 × 62 mm, the size of the steel plate is 1,200 × 200 × 12 mm, and the size of the thin layer UHPC is 1,200 × 200 × 50 mm. HRB400 reinforcement with a diameter of 10 mm is arranged in the thin UHPC layer, and the arrangement spacing is 50 mm. The composite bridge deck adopts the short stud connector and the PE interface, and the defects of the PE interface are also considered. In the two types of connections, the diameter of the short stud is 13 mm, and the height is 35 mm. The PE interface comprises a 2 mm thick epoxy matrix and 2–3 mm quartz sand particles, and the quartz sand parameter is 0.23 g/cm2. Details of all specimens are shown in Table 2. In the table, “CD” represents the steel-UHPC composite deck. “S” represents the stud. “P” represents the PE interface. “I” represents that the interface is intact without defects. “D” represents the interface defect, and the defect area accounts for 30% of the interface area. The defect position is not coated with epoxy, and its position is shown in Figure 4C. The subscripts “M” and “C” represent monotonic and cyclic loading, respectively.
FIGURE 4. Steel-UHPC composite bridge deck. (A) Specimens CD-S-IM and CD-S-IC. (B) Specimens CD-P-IM and CD-P-IC. (C) Specimens CD-P-DM and CD-P-DC.
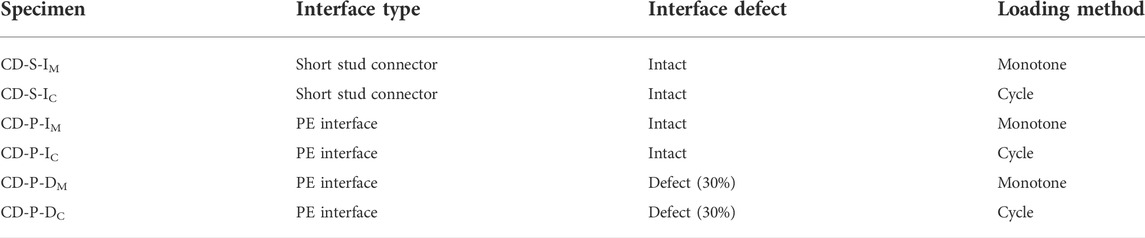
TABLE 2. Detailed information on the composite bridge deck.
3.2 Material properties
3.2.1 UHPC
In this study, UHPC is composed of cement, silica fume, quartz sand, quartz powder, water reducer, and water. The detailed raw material ratio is shown in Table 3. The volume content of polycarboxylate superplasticizer on the market is 1.5%, and the water reduction rate is greater than 35%. In order to ensure the excellent tensile properties of UHPC, the flat steel fiber with a volume content of 3% was introduced. The diameter of the steel fiber is 0.12 mm, the length is 8 mm, and the yield strength is greater than 1,200 MPa. According to Reactive powder concrete (GB/T31387-2015 (General Administration of Quality Supervision, 2015)), the compressive strength fc, tensile strength ft, and Young’s modulus Ec respectively of UHPC were 114.6 MPa, 14.9 MPa, and 48.0 GPa, respectively.
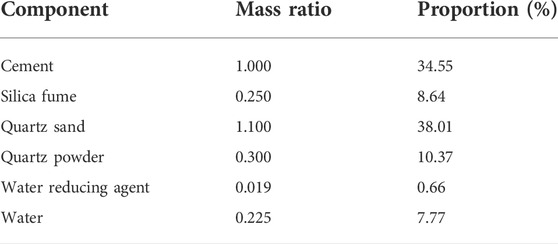
TABLE 3. Proportion of UHPC.
3.2.2 Steel
Q345 grade steel and HRB400 grade reinforcement are selected for the steel-UHPC composite bridge deck. According to Metallic materials—Tensile testing—Part 1:Method of test at room temperature (GB/T 228.1-2010 (General Administration of Quality Supervision, 2010)), the yield 225 strength f y, ultimate tensile strength fu, and Young’s modulus Es of the steel plate and reinforcement were measured by tensile test. Table 4 summarizes the material properties of Q345 grade steel and HRB400 grade reinforcement.
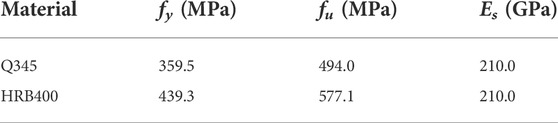
TABLE 4. Material properties of steel.
3.2.3 Epoxy adhesive
The epoxy adhesive (steel adhesive CBSR-A/B) used to make the epoxy matrix is produced in Carbon Technology Group Co., Ltd. The components of CBSR-A/B were the main agent CBSR-A and curing agent CBSR-B, and the weight ratio of the two was 2:1. According to Test methods for properties of resin casting body (GB/T 2567-2021 (Zou et al., 2022)), the tensile properties of the epoxy adhesive include tensile strength fte and tensile Young’s modulus Ete, and the compressive properties include compressive strength fce and compressive Young’s modulus Ece. Table 5 summarizes the mechanical properties of epoxy adhesive.
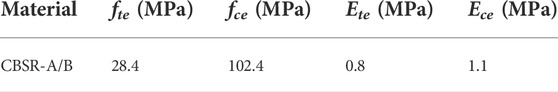
TABLE 5. Mechanical properties of epoxy adhesive.
3.3 Specimen preparation
The fabrication process of the steel-UHPC composite bridge deck is detailed in Figure 5. In Figure 5A, the surface of the steel plate is cleaned with acetone to ensure firm adhesion between the epoxy matrix and the steel plate. In Figure 5B, after the epoxy adhesive is fully mixed in the container, the epoxy adhesive is evenly applied from the center of the steel plate to the periphery to complete the production of the 2 mm thick epoxy matrix. In Figure 5C, before the epoxy matrix is cured, quartz sand particles are evenly distributed on the epoxy matrix in time. Afterward, appropriate pressure was applied to make quartz sand particles firmly embedded in the epoxy matrix. After 7 days of room temperature curing, the PE interface is completed. In contrast, the short studs are directly welded to the steel plate without additional maintenance. In Figure 5D, the steel plate and steel mesh are installed in the mold, and the spacing between the steel mesh and the top of the steel plate and UHPC layer meets the thickness requirement of the protective layer. In Figure 5E, UHPC was poured into the mold, and the mold was removed after 3 days of natural maintenance. In Figure 5F, the composite plate was cured at room temperature for 28 days, and the specimen was prepared by coating it with white paint.
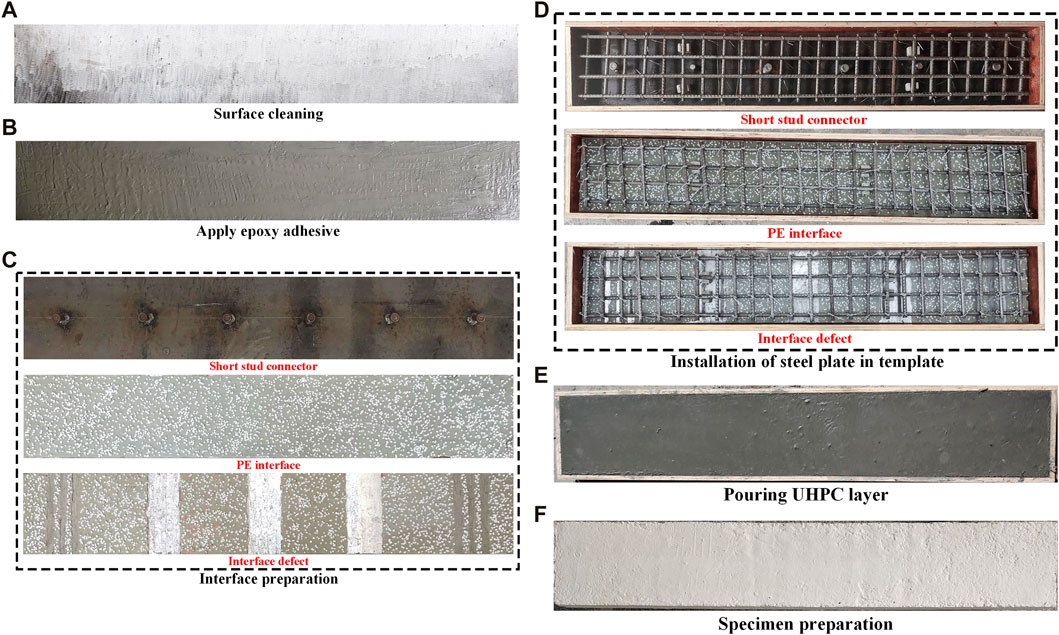
FIGURE 5. Preparation of three types of steel-UHPC composite bridge deck. (A) Surface cleaning. (B) Apply epoxy adhesive. (C) Interface preparation. (D) Installation of steel plate in template. (E) Pouring UHPC layer. (F) Specimen preparation.
3.4 Test scheme and instrument
Figure 6A shows the measuring point arrangement of the steel-UHPC composite bridge deck. All the composite bridge decks adopt a four-point loading scheme, and a hydraulic jack and distribution beam can realize the pure bending moment area of 400 mm in the middle span. The displacement sensors D-1 and D-2 are arranged at 100 mm from the edge of the composite plate to measure the deflection at the fulcrum, and the displacement sensor D-3 is arranged in the middle of the composite plate to measure the mid-span deflection. Displacement sensors S-1 to S-4 were arranged at the edge of the composite bridge deck and 300 mm away from the edge to measure the slip of the thin UHPC layer and steel plate at the interface. Strain gauges are arranged at the top, bottom, and side of the composite bridge deck at midspan to measure the strain of the thin UHPC layer and the steel plate in the pure bending area.
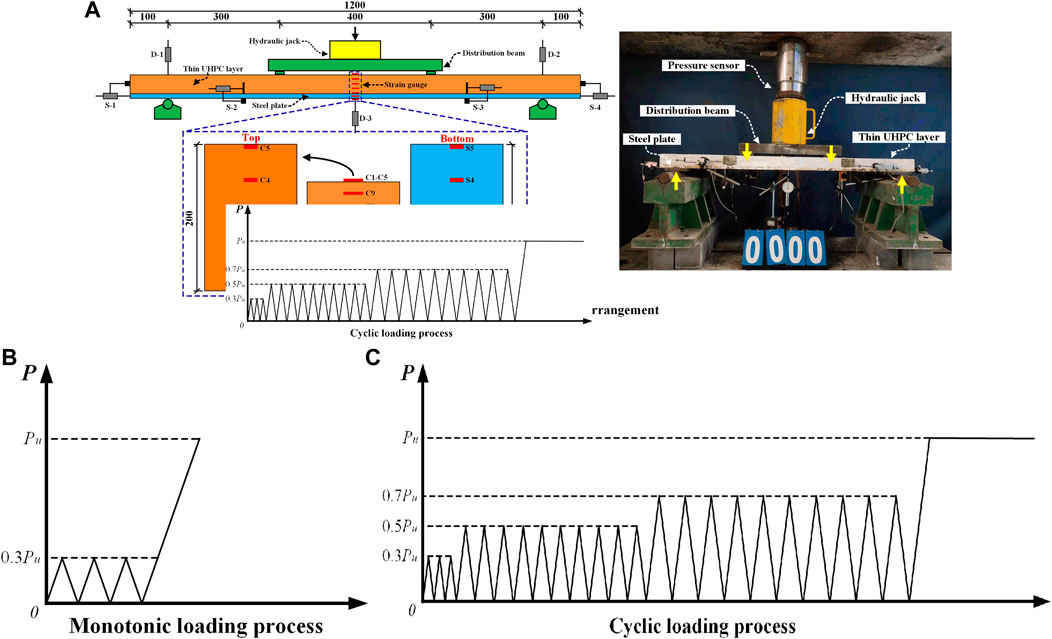
FIGURE 6. Loading scheme. (A) Measuring point arrangement. (B) Monotonic loading process. (C) Cyclic loading process.
The bending test of the steel-UHPC composite bridge deck adopts the loading process adopted by Zou et al. (2022), as shown in Figures 6B,C. In Table 2, the same group of specimens can be divided into monotonic and cyclic loading according to the loading process. In the monotonic loading scheme (Figure 6B), three preloads with an amplitude of 30% of the predicted ultimate load (P) is applied to check the potential problem during loading. Finally, continuous loading until the specimen fails. In the cyclic loading scheme (Figure 6C), the cyclic loading of 0-50% Pu and 0-70% Pu was applied ten times after three times of pre-loading, and then the specimen was continuously loaded until failure. During the test, the development process of cracks was observed and recorded.
4 Results and analysis
4.1 Failure mode
The specimen CD-S-IM has the following failure characteristics. At the beginning of loading, no obvious phenomenon was observed on the composite bridge deck, and the structural stiffness had not changed. After that, when loading to a certain extent, the end of the composite plate was observed to slip, and the micro-cracks at the steel-UHPC interface began to initiate. With the increasing load, the UHPC layer near the loading point produced obvious oblique cracks and cracks developed along the interface. After the steel plate yielded, the UHPC layer near the loading point was crushed locally, and the interface in the shear bending section and the end of the composite bridge deck was void, leading to the specimen’s bending failure. After specimen failure, the crack distribution of specimen CD-S-IC is more dense than that of specimen CD-S-IM. The reason is that the cyclic loading scheme makes the stress redistribution at the steel-UHPC interface, the interface slip distribution uniform, and the damage to the UHPC layer continuously accumulates. The failure of specimens CD-S-IM and CD-S-IC is shown in Figures 7A,B.
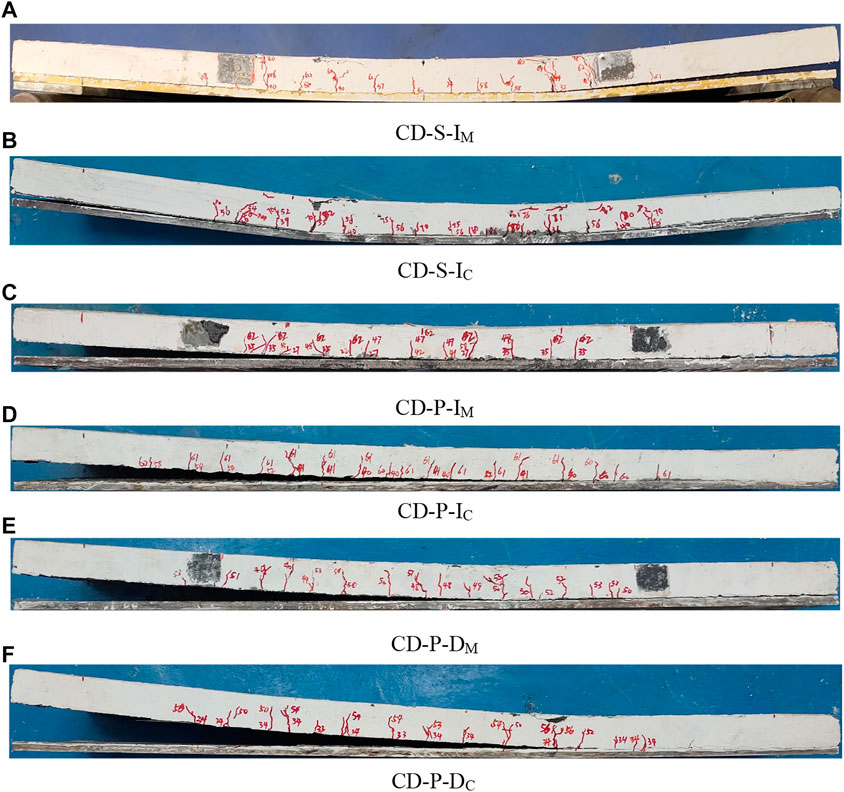
FIGURE 7. Failure of the steel-UHPC composite bridge deck. (A) Specimen CD-S-IM. (B) CD-S-IC. (C) CD-P-IM. (D) CD-P-IC. (E) CD-P-DM. (F) CD-P-DC.
The specimen CD-P-IM has the following failure characteristics. At the beginning of loading, no cracks were observed at the interface of the composite bridge deck. With the increasing load, tiny cracks gradually appeared near the interface. Once the cracks penetrated longitudinally along the composite bridge deck, the separation occurred at the steel-UHPC interface instantaneously, and the interface slip suddenly increased. However, the flexural bearing capacity of the specimen was not lost at this time. Finally, the increasing load made the steel plate yield, and the UHPC layer near the loading point was partially crushed, resulting in the bending failure of the composite bridge deck. After the failure of the specimen, specimen CD-P-IC appeared to have severe interface failure compared with specimen CD-P-IM in the cyclic loading process, which reduced the combined effect of the composite bridge deck at the interface. The low sliding ability of the PE interface led to this phenomenon. The failure of specimens CD-P-IM and CD-P-IC is shown in Figures 7C,D.
The specimen CD-P-DM has the following failure characteristics. At the beginning of loading, the composite bridge deck was not damaged at the interface. After that, when loading to a certain extent, the cracks near the interface of the composite bridge deck were penetrated, resulting in sudden separation at the interface and sudden growth of interface slip. Finally, the increasing load made the steel plate yield, and the UHPC layer near the loading point was partially crushed, resulting in the bending failure of the composite bridge deck. After the specimen is failed, the specimen CD-P-DC has a larger interface separation than the specimen CD-P-DM. In the case of interface defects, cyclic loading makes the connection effect of the PE interface significantly reduced, resulting in a large area of interface failure of the composite bridge deck. The failure of specimens CD-P-DM and CD-P-DC is shown in Figures 7E,F.
4.2 Load-deflection curve
Figure 8 shows the load-deflection curves of all composite bridge decks. In Figure 8A, specimen CD-S-IM and specimen CD-S-IC exhibit similar bending behavior. However, in the process of specimen failure caused by loading, the specific bending behaviors of the two types of specimens are significantly different. (a) Elastic phase. Before loading to30kN, the load and deflection of the composite bridge deck showed a linear growth relationship, and the bending stiffness of the composite bridge deck did not change. Before loading, specimen CD-S-IC produced a significant residual deflection of 3.1 mm compared with specimen CD-S-IM. (b) Elastic-plastic phase. With the increase of load, the end of the composite bridge deck slipped, the combined effect of the structure decreased, and the structural stiffness decreased so that the load-deflection curve increased nonlinearly. In this stage, the load-slip curves of the two types of specimens were basically coincident, and the cracks in the UHPC layer were continuously developing. (c) Yield phase. With the cracks’ continuous development, the steel plate stress increased until yielding, the load no longer increased, and the mid-span deflection continued to grow. However, the damage accumulation of the UHPC layer under cyclic loading makes the mid-span deflection of specimen CD-S-IC increase much less than that of specimen CD-S-IM. (d) Failure phase. The load decreases rapidly with the increase of deflection, the UHPC layer near the loading point is locally crushed, and the composite bridge deck is bending failure.
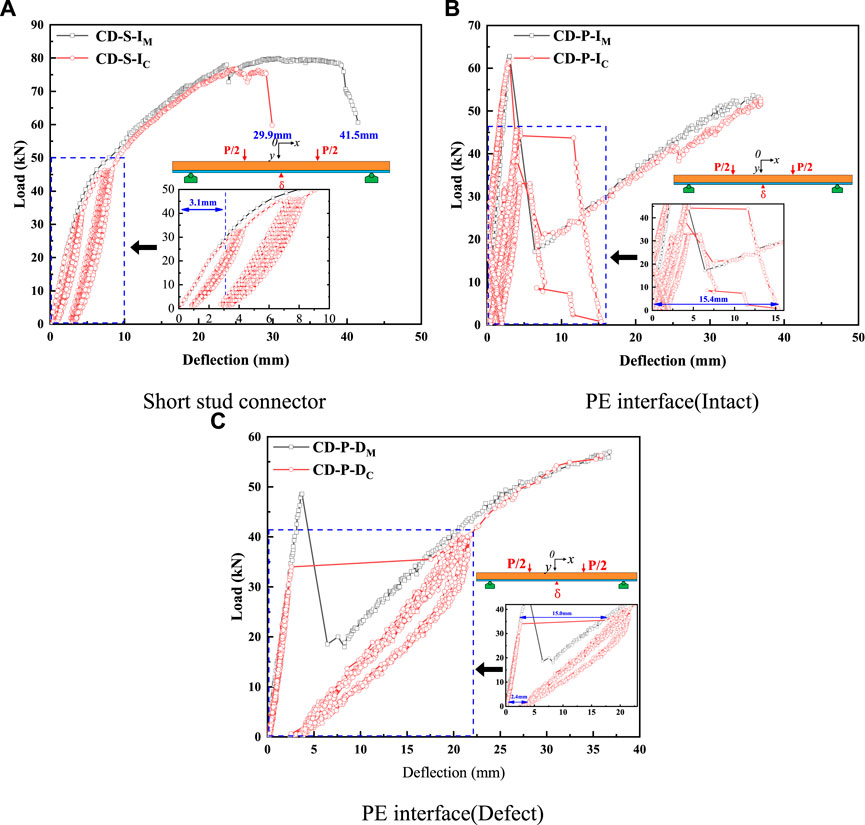
FIGURE 8. Load-deflection curve. (A) Short stud connector. (B) PE interface (Intact). (C) PE interface (Defact).
In Figure 8B, specimen CD-P-IM and specimen CD-P-IC shows similar bending behavior, but the specimen CD-P-IC suddenly shows 15.4 mm mid-span deflection under a cyclic loading scheme. The load-deflection curves of the two types of specimens are characterized as follows. (a) Elastic phase. Before loading to the ultimate load, the bending stiffness of the composite bridge deck did not change, and the load and deflection of the composite bridge deck showed a linear growth relationship. During this stage, the bending stiffness of specimen CD-P-IC was slightly lower than that of specimen CD-P-IM. (b) Damage phase. When loaded to the ultimate load, the PE interface on the side of the composite bridge deck appeared to have a large area failure, resulting in a sudden drop in load. The difference is that the deflection of specimen CD-P-IC increases by 15.9% compared with specimen CD-P-IM due to cyclic loading. (c) Failure phase. The load increases linearly with the deflection until the ultimate steel plate yields, and the UHPC layer is locally crushed near the loading point.
In Figure 8C, specimen CD-P-DM and specimen CD-P-DC show completely different bending behavior, indicating that when the interface defect area reaches 30%, the interface damage caused by cyclic loading cannot be ignored. In addition, the mid-span deflection of specimen CD-P-DC suddenly increased by 15.0 mm during cyclic loading. Under the monotonic loading scheme, specimen CD-P-DM showed similar bending behavior to specimen CD-P-IM. The difference is that the load of specimen CD-P-DM does not reach the ultimate load in the elastic stage, and the load-slip curve shows nonlinear growth characteristics in the failure stage. Under cyclic loading, the specimen CD-P-DC produced a mid-span deflection of 2.4 mm before loading and then experienced elastic-plastic growth until the bending failure of the composite bridge deck.
Table 6 lists the bending properties of the three types of composite bridge decks. Compared with the composite bridge deck with short stud connectors (specimen CD-S-IM), the ultimate load of specimen CD-S-IC is reduced by 4.1%,and the maximum deflection is reduced by 37.8%. Compared with the composite bridge deck with PE interface (specimen CD-P-IM), the ultimate load of specimen CD-P-IC is reduced by 2.1%, and the maximum deflection is reduced by 1.4%. Compared with the composite bridge deck with defect PE interface (specimen CD-P-DM), the ultimate load of specimen CD-P-DC is reduced by 1.2%, and the maximum deflection is reduced by 2.4%. Therefore, even though the ultimate load of the specimen CD-P-IM is reduced by 21.5% compared with the specimen CD-S-IM, the maximum deflection is less affected by the cyclic loading mode. In Figure 3, the main reason is that the shear stiffness of the PE interface is much larger than that of the short stud connector.
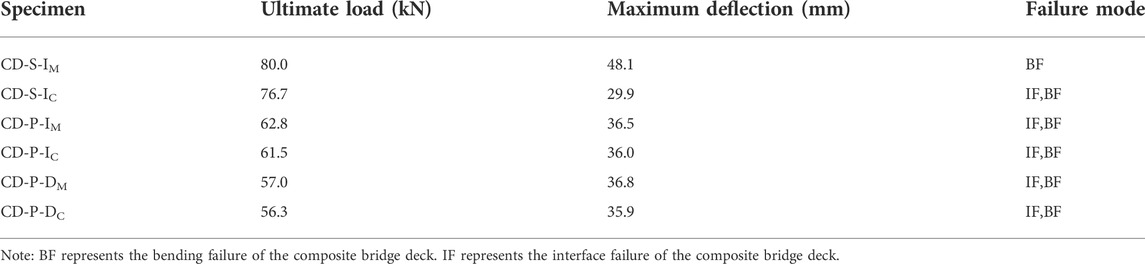
TABLE 6. Bending properties of steel-UHPC composite bridge deck.
4.3 Load-slip curve
Figure 9 shows the load-slip curves of all composite bridge decks. In the figure, the maximum interface slip occurs at the interface near the loading point. The interface void in the pure bending section leads to its slip greater than that at the end of the composite bridge deck. In Figures 9A,B, the maximum interface slip of specimen CD-S-IM is 9.3 mm, and the maximum interface slip of specimen CD-S-IC is 6.9 mm. The maximum interface slip of composite bridge deck under cyclic loading is reduced by 25.8% compared with that under monotonic loading. In addition, the interface slip distribution of the specimen CD-S-IC is more symmetrical along both sides of the span, indicating that the stress redistribution occurs at the interface of the composite bridge deck under cyclic loading. In Figures 9C,D, the initial crack load of specimen CD-P-IM was 53.2kN, and the maximum interfacial slip was 8.1mm, while the initial crack load of specimen CD-P-IC was 32.7 kN and the maximum interfacial slip was 18.8 mm. However, the maximum interfacial slip of specimen CD-P-IC occurs during cyclic loading, not during failure. Cyclic loading causes continuous damage to the PE interface resulting in a sudden increase in interface slip. When the specimen CD-P-IC failed, the maximum interface slip of the measuring point was 6.8 mm, 16.0% lower than that of the specimen CD-P-IM. In addition, the interface slip distribution of the specimen CD-P-IC is more symmetrical along both sides of the span, indicating that the PE interface can still ensure the reliable connection of the composite bridge deck at the interface under cyclic loading. The composite bridge deck produces stress redistribution at the interface.
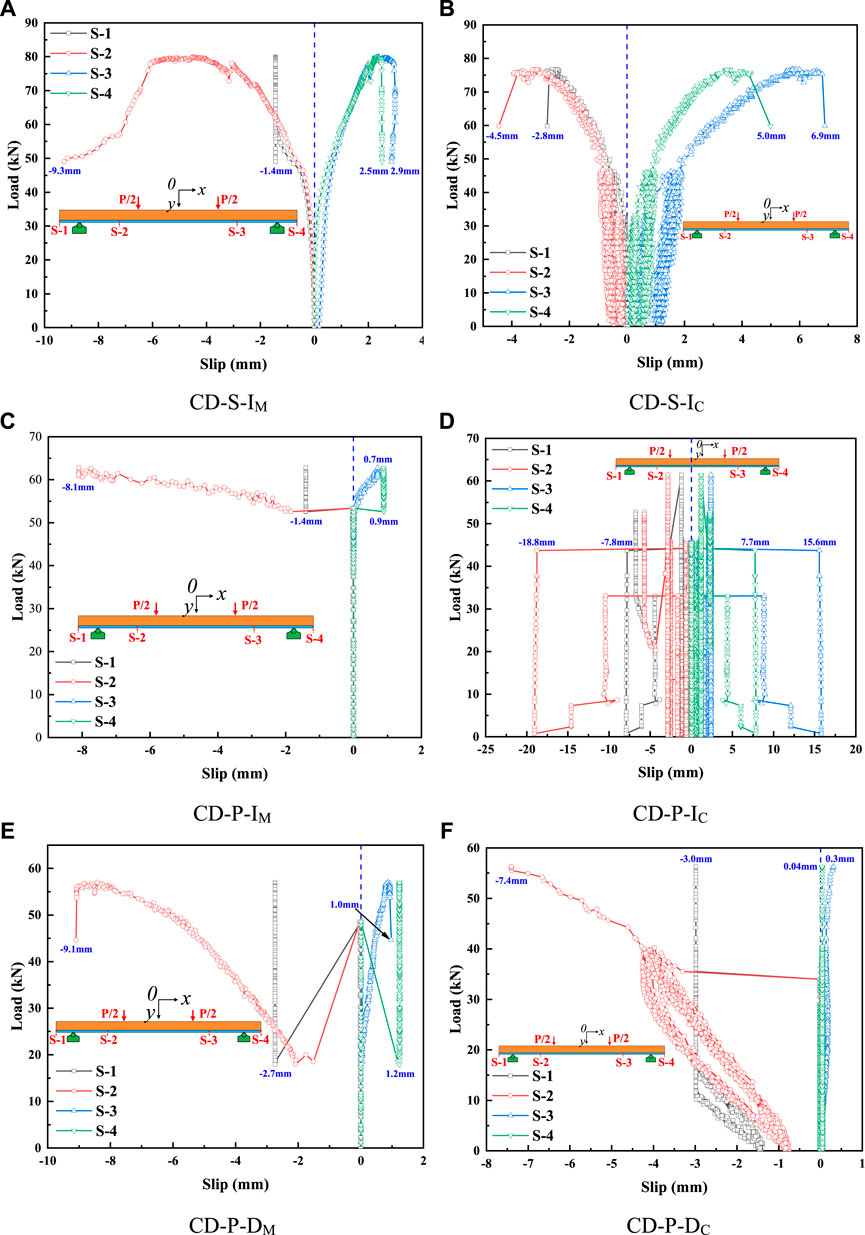
FIGURE 9. Load-slip curve. (A) Specimen CD-S-IM. (B) CD-S-IC. (C) CD-P-IM. (D) CD-P-IC. (E) CD-P-DM. (F) CD-P-DC.
In Figures 9E,F, the initial crack load of specimen CD-P-DM was 19.6kN, and the maximum interfacial slip was 9.1 mm. However, due to defects in specimen CD-P-DC, the slip occurred at the defect position when the cyclic load began, and the maximum interfacial slip was 7.4 mm. The maximum interface slip of composite bridge deck under cyclic loading is reduced by 18.7% compared with that under monotonic loading. However, the distribution of the interface slip of the specimen CD-P-DC along both sides of the span is no longer symmetrical, indicating that the cyclic loading makes the combined action of the composite bridge deck fail at the interface. The composite bridge deck with PE interface is not suitable to bear the cyclic load when the interface defect area reaches 30%.
4.4 Strain distribution
Figure 10 shows the strain distribution of all composite bridge decks along the height direction in the midspan. In Figures 10A,B, when the load of specimen CD-S-IM is lower than 48.5 kN, the strain at midspan is linearly distributed. As the loading continues, the strain at the midspan presents more and more obvious nonlinear distribution. The strain at the midspan of the specimen CD-S-IC is always linearly distributed. Still, it is not continuous at the steel-UHPC interface, and the strain of the thin UHPC layer and the steel plate is linearly distributed. Under the cyclic loading scheme, the stress redistribution occurs at the interface of the composite bridge deck, resulting in a greatly reduced combination of the thin UHPC layer and steel plate at the interface. Meanwhile, when the load is higher than 46.0 kN, the strain of the thin UHPC layer near the interface increases significantly, indicating that the thin UHPC layer at the interface is gradually damaged.
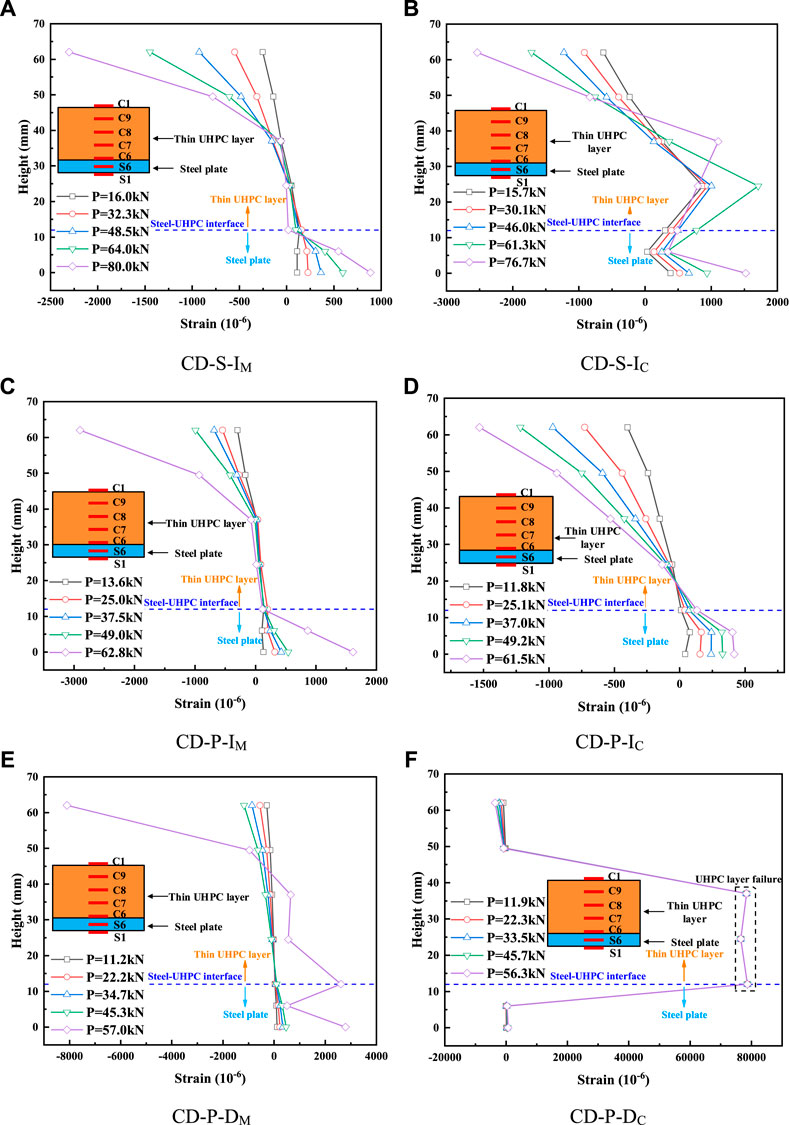
FIGURE 10. Strain distribution. (A) Specimen CD-S-IM. (B) CD-S-IC. (C) CD-P-IM. (D) CD-P-IC. (E) CD-P-DM. (F) CD-P-DC.
In Figures 10C,D, when the load of specimen CD-P-IM is lower than 49.0 kN, the strain at midspan is approximately linearly distributed. Before loading to the ultimate load, the PE interface can realize the reliable connection between the thin UHPC layer and steel plate. When the load is 62.8 kN, the PE interface is suddenly damaged in a large area at the end, resulting in a sudden increase in strain. The strain distribution of specimen CD-P-IC in the loading failure process is approximately linear, indicating that the PE interface can ensure the reliable connection of the thin UHPC layer and steel plate even after cyclic damage.
In Figures 10E,F, when the load of specimen CD-P-DM is lower than 45.3 kN, the strain at midspan is approximately linearly distributed. When the load is 57.0 kN, the PE interface is suddenly destroyed in a large area at the end, resulting in a sudden increase in strain. Compared with the specimen CD-P-IM, the interface defect area of 30% does not significantly weaken the connection performance of the PE interface in the composite bridge deck. After cyclic loading of specimen CD-P-DC, the thin UHPC layer near the interface has already cracked and been destroyed, so the strain is very large. Therefore, when the interface defect area is 30%, the composite bridge deck with PE interface is not suitable to bear the cyclic load.
5 Numerical simulation
5.1 Simulation procedure
In this study, the finite element model of the steel-UHPC composite bridge deck is established by ABAQUS explicit analysis method to realize the numerical simulation of the short stud connector and PE interface in the composite bridge deck. In Figure 11, based on the symmetry of the composite bridge deck, a quarter model is established to improve the calculation efficiency. The symmetry planes are plane y and plane x, respectively. The steel plate, thin UHPC layer, studs, and cube are simulated by C3D8 (three-dimensional 8-node linear solid integration element), and the reinforcement is simulated by B31 (2-node linear beam in space). The zero-thickness cohesive element was used to simulate the mechanical behavior of the PE interface. In the model, the global cell size of the steel plate, thin UHPC layer, and reinforcement is 5 mm, and the global cell size of the cube is 10 mm.
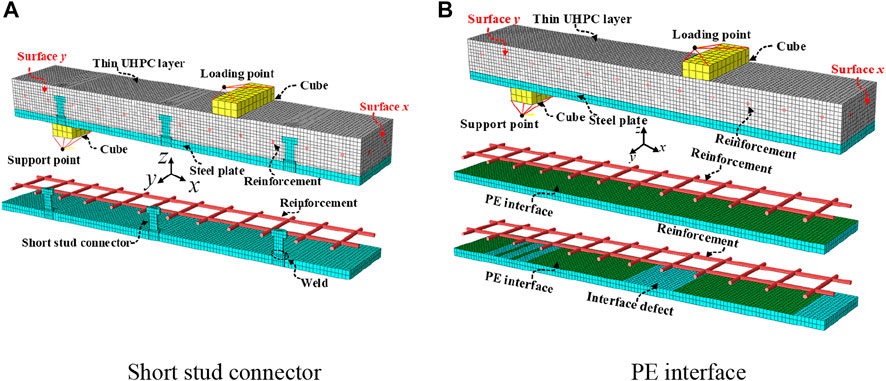
FIGURE 11. Modeling information. (A) Short stud connector. (B) PE interface.
The contact relationship between the steel plate and the thin UHPC layer, the thin UHPC layer, and the short stud connector is normal hard contact, and the tangential friction coefficient is set to 0.4 (Cao and Shao, 2019). The reinforcement is constrained inside the thin UHPC layer by the “embedded region.” The PE interface and thin UHPC layer are constrained by “Tie,” and the thin UHPC layer and cube are also constrained. In addition, the numerical models adopt the displacement loading method and set smooth analysis steps to avoid the fluctuation of the applied load.
5.2 Material constitutive model
5.2.1 UHPC
The concrete plastic damage (CDP) model provided by finite element software ABAQUS was used to simulate the damage and failure process of the thin UHPC layer. Therefore, the tensile and compressive behaviors of UHPC stress-strain curves need to be defined independently. Zhang et al. (2015) obtained the constitutive law under tensile load (Eq. 1) according to the tensile test of UHPC. Yang and Fang (2008) calculated the constitutive law under compression load according to the uniaxial compression test of UHPC (Eq. 2). The stress-strain relationship of UHPC is shown in Figure 12.
where
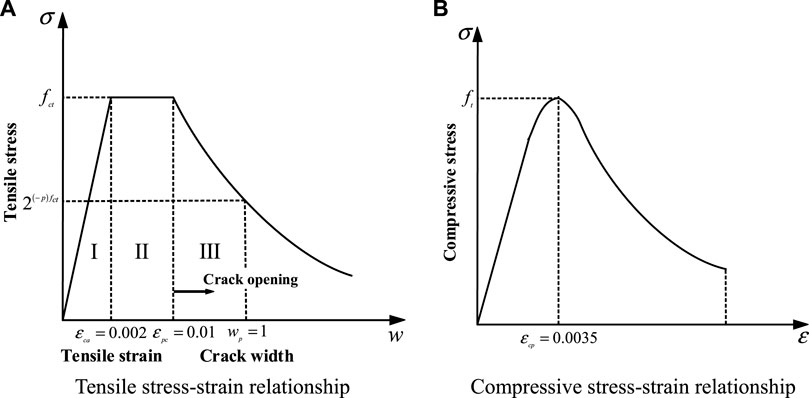
FIGURE 12. Stress-strain relationship of UHPC. (A) Tcnsile stress-strain relationship. (B) Compresssive stress-strain relationship.
5.2.2 Steel and weld
The test results show that the steel plate has yielded during the bending failure of the composite bridge deck, and the reinforcement can reach the yield stress. Therefore, the constitutive relationship of steel and reinforcement is based on the trilinear stress-strain relationship (Zou et al., 2021b) in Figure 13A, and the mechanical properties are listed in Table 4. The first phase characterizes the elastic phase, the stress increases linearly with the strain growth, and the linear slope is the material’s elastic modulus. The second phase represents the yield phase, in which the stress remains unchanged, and the strain increases to
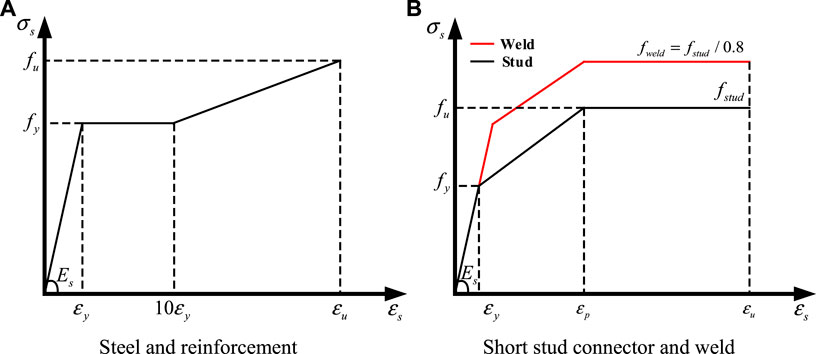
FIGURE 13. Stress-strain relationship of steel, short stud connector and weld.
5.2.3 Interface
The cohesive model is suitable for the numerical analysis of the steel-concrete interface. The complex interface behavior simulation can be realized by the traction- separation relationship of the nodes in the cohesive element (Ranz et al., 2020). In Figure 14, the thickness of the PE interface is much smaller than the size of the composite bridge deck. Therefore, the zero thickness cohesive element is used to simulate the PE interface. Meanwhile, the shear stress-slip curve of the PE interface in Figure 3 is bilinear. Its stress characteristics show that the cohesive model should adopt a bilinear stress-separation relationship. The constitutive law of the traction-separation relation is Eq. 3. The stress-displacement relationship of the cohesive element can be determined through the bilinear traction-separation relationship. Then the complex interface behavior simulation in the local model can be realized. The cohesive model parameters for the PE interface are detailed in Table 7.
where
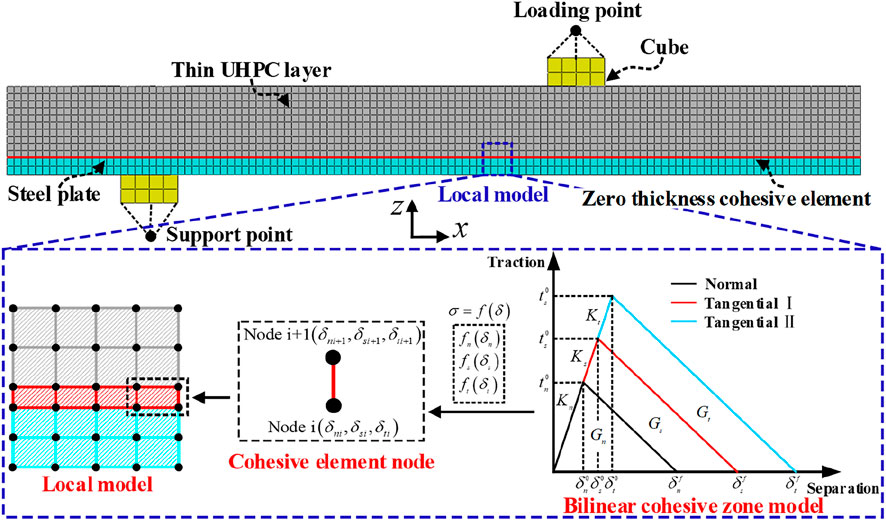
FIGURE 14. Constitutive model of cohesive element.
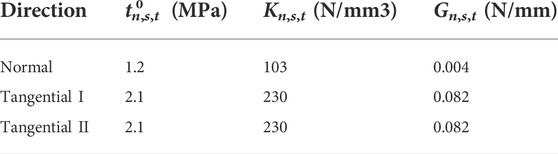
TABLE 7. Cohesive model parameters of PE interface.
5.3 Model validation
Figure 15 shows the load-deflection curves of three types of composite bridge decks (Test and model). In Figure 15A, the two types of curves show good consistency, but the difference is large in the failure phase. In Table 8, the deviation of the model calculation value
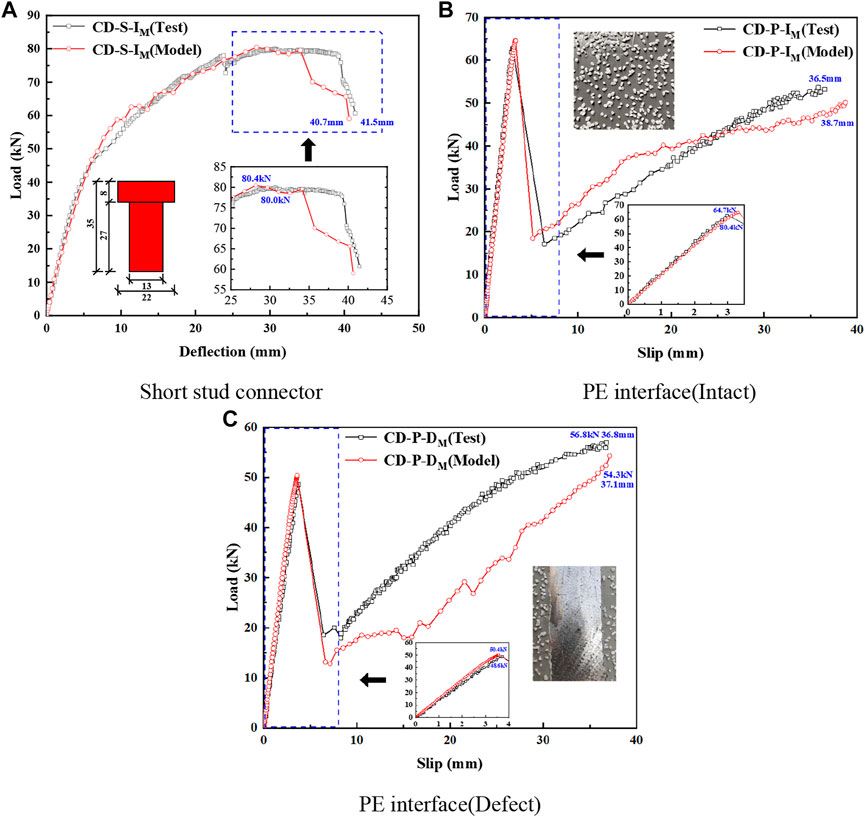
FIGURE 15. Load-deflection curves of test and model. (A) Short stud connector. (B) PE interface (Intact). (C) PE interface (Defact).
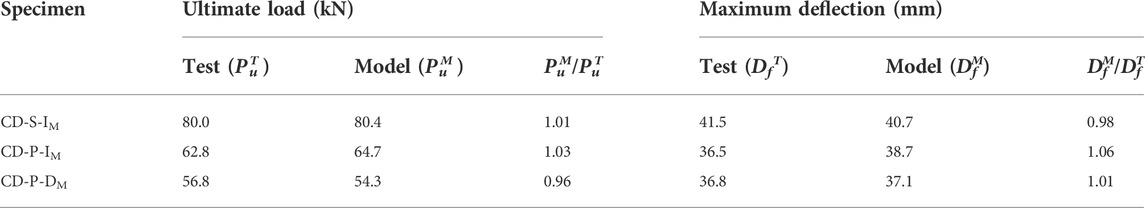
TABLE 8. Comparison of test and model results.
5.4 Discussion
Figure 16 shows the damage of the thin UHPC layer, short stud connectors, and PE interface in various steel-UHPC composite decks. In Figure 16, the stud’s equivalent plastic strain (PEEQ) is greater than 0.2, indicating that the stud fracture (Luo et al., 2016). The equivalent plastic strain (PEEQ) of UHPC is greater than 0.03, indicating the failure of UHPC (Luo et al., 2016). In addition, when the interface element’s stiffness degradation (SDEG) reaches 1, the PE interface fails. SDEG is between 0 and 1, indicating PE interface damage. In Figure 16A, when the load is up to the ultimate load (p = 80.4 kN), the stress of the composite bridge deck with the short stud connector is mainly concentrated near the short stud connectors. In the composite bridge deck, UHPC outside the pure bending section is damaged, and the root of the stud at the end is fractured. In Figure 16B, the stress of the bridge deck with PE interface (Intact) is uniformly distributed along the x-axis before the interface failure (p = 64.7 kN). Meanwhile, UHPC damage occurred near the interface outside the pure bending section, and a large area of failure and damage occurred at the PE interface. In Figure 16C, the stress of the bridge deck with PE interface (Defect) is uniformly distributed along the x-axis before the interface failure (p = 50.4 kN). Although the UHPC damage in the interface defect is weaker, the failure and damage of the PE interface are more concentrated. In the steel-UHPC composite bridge deck, the PE interface can make the stress transfer at the steel-UHPC interface more uniform than the short stud connector, and there is no failure to the thin UHPC layer before the interface failure.

FIGURE 16. Damage of thin UHPC layer, short stud connector, and PE interface. (A) Short stud connector. (B) PE interface (Intact). (C) PE interface (Defact).
6 Conclusion
This study used the PE interface to realize the reliable connection between the thin UHPC layer and the steel plate in the steel-UHPC composite bridge deck. Through the bending test of the composite bridge deck, the effects of the short stud connector and PE interface on the bending performance of the composite bridge deck were compared, and the defects of the PE interface were considered. Finally, it is verified that the cohesive zone model (CZM) can realize the finite element simulation of the PE interface in the composite bridge deck based on the test results. The following conclusions can be drawn:
(1) The shear strength of the FT interface is far lower than that of the EB interface and PE interface among the three designed interfaces. The shear strength of the PE interface is significantly lower than that of the EB interface, but it is much higher than that of the short stud connector. Among the two types of interfaces, the PE interface is more suitable for connecting steel plate and fresh UHPC matrix, which can be used as the interface of the steel-UHPC composite bridge deck.
(2) After the steel plates yield, the thin UHPC layer of the composite bridge deck with the short stud connector is locally crushed near the loading point, resulting in the bending failure of the composite deck. On the contrary, the interface on the midspan side of the composite bridge deck with PE interface failed in a large area before the steel plate yield. After the interface failure, the composite bridge deck can still withstand the load until the final bending failure.
(3) The ultimate load of specimen CD-S-IC is decreased by 4.1% compared with specimen CD-S-IM, and the maximum deflection is decreased by 37.8%. The ultimate load of specimen CD-P-IC is less than 2.1% lower than that of specimen CD-P-IM, and the maximum deflection is reduced by 2.4%. The difference in the maximum deflection reduction between specimen CD-S-IC and specimen CD-P-IC is attributed to the fact that the shear stiffness of the PE interface is much larger than that of the short stud connector.
(4) The slip distribution of specimen CD-P-DC after interface defects is not symmetrical, and the thin UHPC layer at the loading point has failed. The combined action of specimen CD-P-DC at its interface is invalidated by cyclic loading. Therefore, the composite bridge deck is unsuitable for the cyclic load when the defect area of the PE interface reaches 30%.
(5) The load-deflection curves of three types of composite bridge decks obtained from both the test and the model show good agreement. The deviation of the model calculation value
(6) In the steel-UHPC composite bridge deck, the PE interface can make the stress transfer at the steel-UHPC interface more uniform than the short stud connector, and there is no failure to the thin UHPC layer before the failure of the interface.
Data availability statement
The original contributions presented in the study are included in the article/supplementary material, further inquiries can be directed to the corresponding author.
Author contributions
These authors have made great contributions in the field of the steel-concrete composite structure and high-performance concrete material. All authors listed have made a substantial, direct, and intellectual contribution to the work and approved it for publication.
Acknowledgments
The authors express their sincere gratitude for the financial support provided by the Key R&D projects in Guangxi (AB19245017), the National Natural Science Foundation of China (52278147), National Natural Science Foundation of China (52208302), the Major Science and Technology Projects in Hainan (ZDKJ2021048) and the Natural Science Foundation of Chongqing City, China (cstc2020jcyj-msxmX0062).
Conflict of interest
The author BL is employed by Guangxi Communications Technology Group Co., Ltd.
The remaining authors declare that the research was conducted in the absence of any commercial or financial relationships that could be construed as a potential conflict of interest.
Publisher’s note
All claims expressed in this article are solely those of the authors and do not necessarily represent those of their affiliated organizations, or those of the publisher, the editors and the reviewers. Any product that may be evaluated in this article, or claim that may be made by its manufacturer, is not guaranteed or endorsed by the publisher.
References
Alavi, A. H., Hasni, H., Jiao, P. C., Borchani, W., and Lajnaf, N. (2017). Fatigue cracking detection in steel bridge girders through a self-powered sensing concept. J. Constr. STEEL Res. 128, 19–38. doi:10.1016/j.jcsr.2016.08.002
Alkaysi, M., and El-Tawil, S. (2017). Factors affecting bond development between Ultra High Performance Concrete (UHPC) and steel bar reinforcement. Constr. Build. Mat. 144, 412–422. doi:10.1016/j.conbuildmat.2017.03.091
Berthet, J. F., Yurtdas, I., Delmas, Y., and Li, A. (2011). Evaluation of the adhesion resistance between steel and concrete by push out test. Int. J. Adhes. Adhes. 31 (2), 75–83. doi:10.1016/j.ijadhadh.2010.11.004
Bouazaoui, L., and Li, A. (2008). Analysis of steel/concrete interfacial shear stress by means of pull out test. Int. J. Adhesion Adhesives 28 (3), 101–108. doi:10.1016/j.ijadhadh.2007.02.006
Bouazaoui, L., Perrenot, G., Delmas, Y., and Li, A. (2007). Experimental study of bonded steel concrete composite structures. J. Constr. Steel Res. 63 (9), 1268–1278. doi:10.1016/j.jcsr.2006.11.002
Cao, J. H., and Shao, X. D. (2019). Finite element analysis of headed studs embedded in thin UHPC. J. Constr. Steel Res. 161, 355–368. doi:10.1016/j.jcsr.2019.03.016
Charron, J. P., Denarie, E., and Brtihwiler, E. (2008). Transport properties of water and glycol in an ultra high performance fiber reinforced concrete (UHPFRC) under high tensile deformation. Cem. Concr. Res. 38, 689–698. doi:10.1016/j.cemconres.2007.12.006
Cheng, Z. Y., Zhang, Q. H., Bao, Y., Deng, P., Wei, C., and Li, M. (2021). Flexural behavior of corrugated steel-UHPC composite bridge decks. Eng. Struct. 246, 113066. doi:10.1016/j.engstruct.2021.113066
Feng, Z., Li, C. X., He, J., Ke, L., Lei, Z., and Vasdravellis, G. (2021). Static and fatigue test on lightweight UHPC-OSD composite bridge deck system subjected to hogging moment. Eng. Struct. 241, 112459. doi:10.1016/j.engstruct.2021.112459
Freitas, S. T. D., Kolstein, H., and Bijlaard, F. (2017). Fatigue assessment of full-scale retrofitted orthotropic bridge decks. J. BRIDGE Eng. 22 (11), 04017092. doi:10.1061/%28ASCE%29BE.1943-5592.0001115
Fu, Z. Q., Wang, Y. X., Ji, B. H., and Jiang, F. (2019). Effects of multiaxial fatigue on typical details of orthotropic steel bridge deck. Thin-Walled Struct. 135, 137–146. doi:10.1016/j.tws.2018.10.035
General Administration of Quality Supervision (2010). Inspection and quarantine. Metallic materials-Tensile testing-Part 1:Method of test at room temperature. beijing, China. (GB/T 228.1-2010) [in Chinese].
General Administration of Quality Supervision (2015). Inspection and quarantine. beijing, China: Reactive powder concrete. (GB/T 31387-2015)[in Chinese].
Hung, C. C., El-Tawil, S., and Chao, S. H. (2021). A review of developments and challenges for UHPC in structural engineering: Behavior, analysis, and design. J. Struct. Eng. (N. Y. N. Y). 147 (9), 03121001. doi:10.1061/(asce)st.1943-541x.0003073
Jiang, J. L., Zou, Y., Yang, J., Zhou, J. T., Zhang, Z. Y., and Huang, Z. L. (2021). Study on bending performance of epoxy adhesive prefabricated UHPC-steel composite bridge deck. Adv. Civ. Eng. 2021, 6658451. doi:10.1155/2021/6658451
Jiang, J. L., Leng, J. C., Zhang, J. T., and Guo, J. C. (2022). Interfacial behavior of the steel–UHPC composite deck with toughened epoxy bonding. Front. Mat. 9, 859214. doi:10.3389/fmats.2022.859214
Kruszewski, D., Zaghi, A. E., and Wille, K. (2019). Finite element study of headed shear studs embedded in ultra-high performance concrete. Eng. Struct. 188, 538–552. doi:10.1016/j.engstruct.2019.03.035
Kumar, P., Patnaik, A., and Chaudhary, S. (2018). Effect of bond layer thickness on behaviour of steel-concrete composite connections. Eng. Struct. 177, 268–282. doi:10.1016/j.engstruct.2018.07.054
Larbi, S., Ferrier, E., and Hamelin, P. (2009). Concrete to steel lap joint failure criteria under combined shear and peeling stress. J. Constr. Steel Res. 65 (2), 386–394. doi:10.1016/j.jcsr.2008.03.012
Liu, Y. M., Zhang, Q. H., Bu, Y. Z., and Bao, Y. (2022). Static and fatigue performance of steel bridge decks strengthened with air-cured UHPC. STRUCTURES 41, 203–214. doi:10.1016/j.istruc.2022.05.025
Luo, Y. B., Hoki, K., Hayashi, K., and Nakashima, M. (2016). Behavior and strength of headed stud-SFRCC shear connection. II: Strength evaluation. J. Struct. Eng. (N. Y. N. Y). 142 (2), 04015113. doi:10.1061/(asce)st.1943-541x.0001372
Luo, Y. J., Li, A., and Kang, Z. (2012). Parametric study of bonded steel-concrete composite beams by using finite element analysis. Eng. Struct. 34, 40–51. doi:10.1016/j.engstruct.2011.08.036
Maloney, K., and Fleck, N. (2019). Toughening strategies in adhesive joints. Int. J. Solids Struct. 158, 66–75. doi:10.1016/j.ijsolstr.2018.08.028
Meng, W. N., and Khayat, K. (2017). Effects of saturated lightweight sand content on key characteristics of ultra-high-performance concrete. Cem. Concr. Res. 101, 46–54. doi:10.1016/j.cemconres.2017.08.018
Ranz, D., Cuartero, J., Castejon, L., Miralbes, R., and Malon, H. (2020). A cohesive zone model approach to interlaminar behaviour of carbon/epoxy laminated curved beams. Compos. Struct. 238, 111983. doi:10.1016/j.compstruct.2020.111983
Robert, C. W., Mathieu, C., and Pradipta, K. D. (2007). Multiscale considerations for interface engineering to improve fracture toughness of ductile fiber/thermoset matrix composites. Compos. Sci. Technol. 67 (11), 2428–2437. doi:10.1016/j.compscitech.2007.01.004
Sun, Q. L., Lu, X. Y., Nie, X., Han, Z. J., and Fan, Z. S. (2017). Experimental research on tensile and shear behaviour of the interface between non-steam-cured UHPC and steel plate structure. Eng. Mech. 34 (9), 167–174. doi:10.6052/j.issn.1000-4750.2016.05.0361
Wang, Z., Nie, X., Fan, J. S., Lu, X. Y., and Ding, R. (2019). Experimental and numerical investigation of the interfacial properties of non-steam-cured UHPC-steel composite beams. Constr. Build. Mater. 195, 323–339. doi:10.1016/j.conbuildmat.2018.11.057
Wang, Q. D., Ji, B. H., Xia, J. Y., and Fu, Z. (2020). Fatigue assessment of rib-deck welds in orthotropic steel decks integrating the effect of load dispersal through asphalt surfacing. STRUCTURES 28, 1701–1712. doi:10.1016/j.istruc.2020.10.017
Wu, Z. M., Shi, C. J., and Khayat, K. H. (2019). Investigation of mechanical properties and shrinkage of ultra-high performance concrete: Influence of steel fiber content and shape. Compos. Part B Eng. 174, 107021. doi:10.1016/j.compositesb.2019.107021
Yang, J., and Fang, Z. (2008). Research on stress-strain relation of ultra high performance concrete. Concrete 7, 11–15. doi:10.3969/j.issn.1002-3550.2008.07.004
Zhan, Y. L., Duan, M. J., Zhang, L., Liu, C., Li, Z., and Zhao, R. (2021). Study on the shear performance of adhesive shear connectors in push-out tests. STRUCTURES 32, 2103–2117. doi:10.1016/j.istruc.2021.03.109
Zhang, Z., Shao, X. D., Li, W., Zhu, P., and Chen, H. (2015). Axial tensile behavior test of ultra high performance concrete. China J. Highw. Transp. 28 (8), 50–58.
Zhang, S. H., Shao, X. D., Cao, J. H., Cui, J., Hu, J., and Deng, L. (2016). Fatigue performance of a lightweight composite bridge deck with open ribs. J. Bridge Eng. 21 (7), 04016039. doi:10.1061/(asce)be.1943-5592.0000905
Zhang, Z. G., Yang, F., Liu, J. C., and Wang, S. P. (2020). Eco-friendly high strength, high ductility engineered cementitious composites (ECC) with substitution of fly ash by rice husk ash. Cem. Concr. Res. 137, 106200. doi:10.1016/j.cemconres.2020.106200
Zhang, Z. G., Liu, S. Y., Yang, F., Weng, Y. W., and Qian, S. Z. (2021). Sustainable high strength, high ductility engineered cementitious composites (ECC) with substitution of cement by rice husk ash. J. Clean. Prod. 317, 128379. doi:10.1016/j.jclepro.2021.128379
Zhang, Z. G., Liu, D., Ding, Y., and Wang, S. (2022). Mechanical performance of strain-hardening cementitious composites (SHCC) with bacterial addition. J. Infrastruct. Preserv. Resil. 3, 3. doi:10.1186/s43065-022-00048-3
Zhao, W., Yu, Y., and Xie, Q. S. (2019). Nonuniform interface failure of steel-concrete composite structures bonded using epoxy resin mortar. Eng. Struct. 184, 447–458. doi:10.1016/j.engstruct.2019.01.109
Zhu, Y. P., Zhang, Y., Hussein, H. H., and Chen, G. (2020). Numerical modeling for damaged reinforced concrete slab strengthened by ultra-high performance concrete (UHPC) layer. Eng. Struct. 209, 110031. doi:10.1016/j.engstruct.2019.110031
Zou, Y., Jiang, J. L., Zhou, Z. X., Wang, X. F., and Guo, J. C. (2021). Study on the static performance of prefabricated UHPC-steel epoxy bonding interface. Adv. Civ. Eng. 2021, 1–15. doi:10.1155/2021/6663517
Zou, Y., Qin, F. J., Zhou, J. T., Zheng, Z. C., Huang, Z. L., and Zhang, Z. Y. (2021). Shear behavior of a novel bearing-shear connector for prefabricated concrete decks. Constr. Build. Mat. 268, 121090. doi:10.1016/j.conbuildmat.2020.121090
Keywords: bridge engineering, UHPC, steel-UHPC composite bridge deck, epoxy adhesive, cohesive zone model
Citation: Li B, Jiang J, Deng Z, Zhou H, Wang H, Jiang H and Cao Y (2022) Bending behavior of steel-UHPC composite bridge deck based on epoxy adhesive. Front. Mater. 9:1023886. doi: 10.3389/fmats.2022.1023886
Received: 20 August 2022; Accepted: 13 September 2022;
Published: 13 October 2022.
Edited by:
Jialuo He, Washington State University, United StatesCopyright © 2022 Li, Jiang, Deng, Zhou, Wang, Jiang and Cao. This is an open-access article distributed under the terms of the Creative Commons Attribution License (CC BY). The use, distribution or reproduction in other forums is permitted, provided the original author(s) and the copyright owner(s) are credited and that the original publication in this journal is cited, in accordance with accepted academic practice. No use, distribution or reproduction is permitted which does not comply with these terms.
*Correspondence: Jinlong Jiang, amlubG9uZ2ppYW5nQG1haWxzLmNxanR1LmVkdS5jbg==