 Miaomiao Chen
 Qiang Du
 Renhai Shi
 Huadong Fu1,3,4
 Jianxin Xie
- 1Beijing Advanced Innovation Center for Materials Genome Engineering, University of Science and Technology Beijing, Beijing, China
- 2SINTEF Industry, Oslo, Norway
- 3Key Laboratory for Advanced Materials Processing (MOE), Institute for Advanced Materials and Technology, University of Science and Technology Beijing, Beijing, China
- 4Beijing Laboratory of Metallic Materials and Processing for Modern Transportation, Institute for Advanced Materials and Technology, University of Science and Technology Beijing, Beijing, China
An in-depth and integral understanding of the microstructural evolution during thermomechanical process (TMP) is of great significance to optimize the manufactural process for high-quality components via additive manufacturing. The solidified microstructure model of Inconel 718 alloy fabricated via laser powder bed fusion (L-PBF) is established by multiphase field model firstly. Furthermore, the microstructural evolution during homogenization process is simulated and optimized in this study. Phase field simulation results show that the concentration gradient of Nb along the radius of the cellular substructure decreases from the initial 1.217 wt% to 0.001 wt%, and 67% area fraction of the Laves phase dissolves at the homogenization time of 0.5 h, which have achieved the homogenization purpose. The experimental results show that the average grain size decreases from 9.4 μm to 5.9 μm at the homogenization time from 1.5 h (the standard AMS 5383) to 0.5 h, which resulted in the increase of yield strength and tensile strength of the aged alloy by 14% and 6%, respectively. This research can provide guidance and reference for the microstructural control as well as the TMP parameters design of the additive manufactured alloys.
1 Introduction
Inconel 718 alloy is a typical precipitation strengthened nickel-base superalloy with excellent strength, high fatigue resistance, and desirable structural stability at higher temperature. The alloy has been widely applied in gas turbine, ship, nuclear power plant, and aerospace sectors to make turbine disk, blade, support, pipeline, brake, seal, fastener (Reed, 2006; De Bartolomeis et al., 2021). However, it is still a challenge to machine and manufacture Inconel 718 alloy parts with complex geometry due to higher cutting temperature and serious work hardening (Paturi et al., 2021). Focusing on the above problem, Laser Powder Bed Fusion (L-PBF), an attractive laser additive manufacturing technology, has been applied successfully in improving mechanical properties and broadening the application of Inconel 718 components (Trosch et al., 2016; Hosseini and Popovich, 2019). Nevertheless, there are some problems in as-built Inconel 718 parts fabricated via L-PBF, such as large residual stress, solute segregation, and the precipitation of Laves phase ((Ni, Fe, Cr)2(Nb, Mo, Ti)). The formation of long-chain Laves phase not only consumes the elements (Nb, Ti, Al) required for the formation of γ′ (Ni3(Al, Ti, Nb)) and γ″ (Ni3Nb) strengthening phases but also promotes initiation and propagation of cracks (Sui et al., 2017; Yuan et al., 2018; Luu et al., 2022). Another issue is that there is no special heat treatment developed for AM-ed Inconel 718 alloy. So far, the heat treatments applied to Inconel 718 alloy fabricated by L-PBF are based on the standard heat treatments proposed for casting and forging alloys (Rao et al., 2003; Blackwell, 2005; Zhao et al., 2008; Zhang et al., 2015).
Microstructure modeling, an essential part of integrated computational materials engineering (ICME) approach, has proven to be useful in accelerating material design and heat treatment process parameter optimization (Sahoo and Chou, 2014; Du et al., 2017; Nandy et al., 2019; Chen et al., 2022; Chen and Zhao, 2022; Dai et al., 2022). Among various microstructure simulation methods, phase field method (PFM) has become one of the most commonly used computational modeling techniques for studying microstructure evolution and an important component in the ICME approach to materials design. PFM has been coupled with temperature field (Sahoo and Chou, 2016; Sahoo, 2022) and solute field to realize scale-crossing simulation (Kumara et al., 2020; Nabavizadeh et al., 2020) and the description of actual engineering process to guide material design and processing parameters optimization (Hu et al., 2019; Seiz and Nestler, 2021; Zeng et al., 2021). Some PFM simulation studies have been carried out on L-PBF Inconel 718 alloy. For example, the finite element thermal model was employed to calculate the cooling rate and temperature gradient by Wang and Chou. (2018). The results were applied as input parameters for the phase-field model to investigate the evolution of microstructures. The simulated columnar dendrite arm spacing is consistent with the experimental results. Xiao et al. (2019) also combined the finite element model with the PFM to establish a multi-scale model to analyze the solidification behavior and dendrite growth during the direct energy deposition process of Inconel 718 alloy. The predicted results of columnar dendrite morphology and dendrite arm spacing provided a good fit to experimental results. Kumara et al. (2019); Kumara et al. (2020) proposed to simulate Laves phase and δ phase of Inconel 718 alloy during laser direct energy deposition and subsequent heat treatment via a phase-field model, but the accurate prediction of secondary phases was not realized.
In summary, PFM has been well applied in the simulation of microstructure in additive manufacturing. But it only focuses on microstructure morphology of dendrite and secondary phases, and does not simulate the evolution of microstructure characteristics in the subsequent heat treatment (Wang and Chou, 2018; Kumara et al., 2019; Kumara et al., 2020; Cao et al., 2021; Zhao et al., 2021). The microstructure in solidification and subsequent heat treatment jointly determines the performance of Inconel 718 samples fabricated by the L-PBF. In this paper, the solidification and subsequent heat treatment are connected to optimize the process and explore the feasibility of the whole process organization simulation. The solidified microstructure model of Inconel 718 alloy fabricated via L-PBF is established by multiphase field model. Then, based on the solidified microstructure model and HSA standard heat treatment (AMS 5383) proposed for casting Inconel 718, the microstructure evolution of Inconel 718 fabricated by the L-PBF during homogenization is simulated by the multiphase-field method coupled with CALPHAD data. Together with experimental research, the effects of homogenization time on microstructure evolution and mechanical properties of Inconel 718 samples with HSA heat treatment are analyzed. It lays a foundation for the formulation of a heat treatment recipe suitable for Inconel 718 alloy fabricated via L-PBF. The research strategy in this paper is illustrated in Figure 1. This research can provide guidance and reference for the microstructural control as well as the TMP parameters design of the additive manufactured alloys.
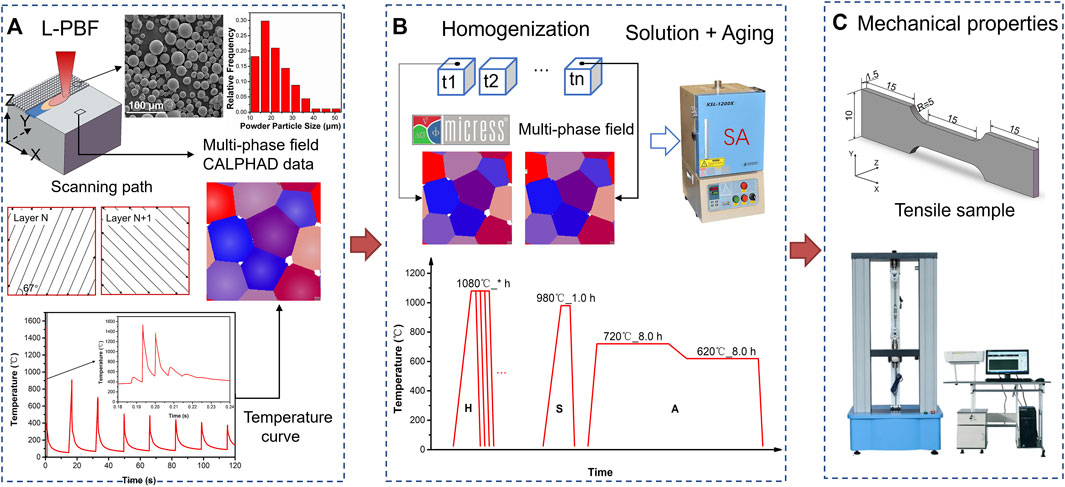
FIGURE 1. The research strategy of the L-PBF and subsequent homogenization heat treatment of Inconel 718 alloy, (A) phase-field modeling of the microstructure of as-built samples, (B) phase-field modeling under different homogenization time, and parameters of subsequent solution and double aging process, (C) mechanical properties.
2 Phase field modeling
2.1 Multiphase-field model
Phase field method is a microstructure-level simulation technique often used in the ICME approach to materials design. The multiphase-field model, as implemented in the commercial phase field software MICRESS (Access e.V. Aachen, Germany) (Steinbach et al., 1996; Eiken et al., 2006; Steinbach, 2009), is adopted in this paper. The evolution of multiphase field variables
The bracket
In addition, molar Gibbs free energy densities are employed to evaluate the chemical contribution combined with CALculation of PHase Diagram (CALPHAD) databases. With the assumption of all interface widths being the same, the multi-phase field equations are derived for general multi-phase transformations according to the principle of minimizing free energy (Eiken et al., 2006).
Here,
In the model, the interfacial energy
Here
2.2 Model parameters
The thermodynamic and kinetic data, such as
According to the preliminary experimental results, the secondary phases of the as-built samples are a large amount of white Laves and a small amount of bright white NbC phase. On the basis of the standard heat treatment of AMS5383 for casting Inconel 718, the homogenized temperature is determined as 1,080°C. Therefore, the NbC phase with a dissolution temperature of 1,265°C will not be dissolved in the homogenization process. In addition, the area fraction of the NbC phase is lower. Therefore, we mainly take the Laves phase as the research target phase and analyze its evolution during the homogenization process. According to the element content and the main constituent elements of the Laves phase, the chemical composition of Inconel 718 is simplified for simulation, as shown in Table 1.

TABLE 1. Simplified composition of Inconel 718 alloy in multiphase-field model.
In L-PBF process, the powders are melted through the laser beam and then solidified into components. Taking the cellular structure of the XY plane (perpendicular to the building direction Z), as shown in Figure 1A, as the simulation domain, the evolution of Laves phase and solute distribution during L-PBF process of Inconel 718 alloy are simulated. Five SEM images along the scanning track, are analyzed to obtain the cellular substructure size and its number density. The average diameter of the cellular substructure is 0.8 μm and the number density is about 2.18/μm2. Therefore, nine nucleation seeds of γ phase are placed in simulation domain with the size of 2 μm × 2 μm, and the grid size is set to 0.01 μm. Laves phase nucleates in the undercooling model at the interface of liquid/γ, which is set as an anisotropic interface with the cubic crystal structure. All boundaries are set as periodic boundary conditions. The numerical parameters such as interface thickness, minimum phase fraction, and average factor of driving force are adjusted to correct the effect of non-equilibrium solute trapping. The appropriate values are determined based on whether the solidification is completed and the distribution law of the discrete distribution of the laves phase along with the substructure as the evaluation criteria. The calculated the microstructure results of -Inconel 718 samples fabricated via L-PBF are extracted as initial parameters for the simulation of microstructure evolution in the homogenization process. The parameters adopted in reference (Kumara et al., 2019) and the final simulation parameters of this study are shown in Table 2.

TABLE 2. Parameters in multiphase-field model.
3 Experiment
3.1 L-PBF process and homogenization
The spherical powders of Inconel 718 with the size range of 15–53 μm are prepared by gas atomization technology as shown in Figure 1A, and their chemical compositions are listed in Table 3. The powders are dried at 100°C for 8 h and then deposited on a 304 L stainless steel substrate with a size of 250 mm × 250 mm for L-PBF. As-built Inconel 718 samples are fabricated on a BLT A300 equipped with a maximum 500 W fiber laser with a Gaussian intensity distribution and spot size (1/e2) of 76 μm. The process is carried out under a flow of ultra-high purity Ar gas (99.999%) to reduce the oxygen content below 200 ppm. The parameters applied in our work are the results of AM equipment manufacturer’s recommendation and our own lab practices for Inconel 718 alloy. The zigzag scan is selected, the scanning path as shown in Figure 1A. The other parameters are as follows, laser power of 275 W, scanning speed of 960 mm/s, the powder layer thickness of 40 μm, scanning spacing of 100 μm.

TABLE 3. Nominal chemical composition of the gas atomized Inconel 718 powder.
The heat treatment experiments are carried out with a muffle furnace (KSL-1200X). According to the HSA standard heat treatment, i.e., homogenization treatment at 1,080°C for 1.5 h/AC, solution treatment at 980°C for 1 h/AC and then double aging at 720°C for 8 h/FC at 50°C/h to 620°C for 8 h, AC, proposed for casting Inconel 718, the homogenization temperature is set at 1,080°C. The microstructure evolution with different holding times (0.5 h–4.0 h) is analyzed. The subsequent heat treatments (Solution treatment at 980°C for 1 h/AC and then double Aging at 720°C for 8 h/FC at 50°C/h to 620°C for 8 h, AC) of HSA heat treatment (AMS 5383) are carried out to investigate the effect of homogenization time on microstructure and mechanical properties of Inconel 718 samples fabricated via L-PBF.
3.2 Microstructural observation and properties
To reveal the microstructure of XY planes, the polished samples are etched for 20 s using Kalling’s reagent (HCl (100 ml) +CuCl2 (5 g) + C2H5OH (100 ml)). A ZEISS Gemini SEM 500 scanning electron microscope (SEM) and a Mira 3 LMH SEM equipped with electron backscatter diffraction (EBSD) from Oxford Instrument are employed to examine the microstructure. The area fractions of Laves phase and NbC phase are measured by ImageJ according to the different grayscale values of the phases from fifteen SEM - SE (secondary electron) images. To resolve the secondary phase boundaries, SEM images of etched samples are employed for area fraction measurement. The contrast and brightness of all pictures are adjusted to ensure that the gray values of the matrix phases in the pictures are consistent. ImageJ software is used to get area fractions of Laves phase and NbC phase from the different grayscale values of the phases.
The grain morphology, size, orientation of the samples, and polar diagrams are obtained by channel 5 software. Electron Probe Micro Analysis (EPMA) (JXA-8230) is used to analyze the solutes segregation in the cellular substructure of finely polished samples. Three rectangular regions with a size of 4 × 8 points are randomly selected in the cellular substructure of samples, and the point spacing is set to about 0.1 μm. A Titan ETEM G2 transmission electron microscope (TEM) is applied to investigate the solute distribution and precipitation particles distribution of deposited and HSA heat treatment samples, prepared by double jet technology. TEM samples etched in 90% C2H5OH+10% HClO4 solution at −25°C and 20 V using a dual jet system.
The size of tensile samples at room temperature is shown in Figure 1C, with a thickness of 1.5 mm. According to the standard of GB/T2281-2010, mechanical properties are measured by a CTM2500 microcomputer controlled electronic universal testing machine equipped with an extensometer.
4 Results and discussion
4.1 Microstructure of as-built inconel 718 samples fabricated via L-PBF
Figures 2A, B shows EBSD images of the microstructure on XZ plane, parallel to building direction Z, and XY plane, perpendicular to building direction Z, of as-built Inconel 718 sample with columnar dendritic morphology. During the laser scanning in L-PBF process, the partially remelting of the solidified part of the lower layer leads to the epitaxial growth to form columnar dendritic morphology. The microstructure shows stronger texture on the (Zhang et al., 2019) crystallographic plane than that on XY plane. Strip-shaped grains are arranged in parallel across the width of the melt channel, and there are some fine grains at the edge of the scanning track. In order to analyze the distribution of solutes along the center to the edge of substructures, the XY plane has be chosen to show the entire surface of substructures. Along the substructure from center to edge, the XY plane should be choice to display the whole surface of the substructure. Therefore, the microstructure characteristics and solute distribution behavior on XY plane of the Inconel 718 samples in the L-PBF process are analyzed in the current work.
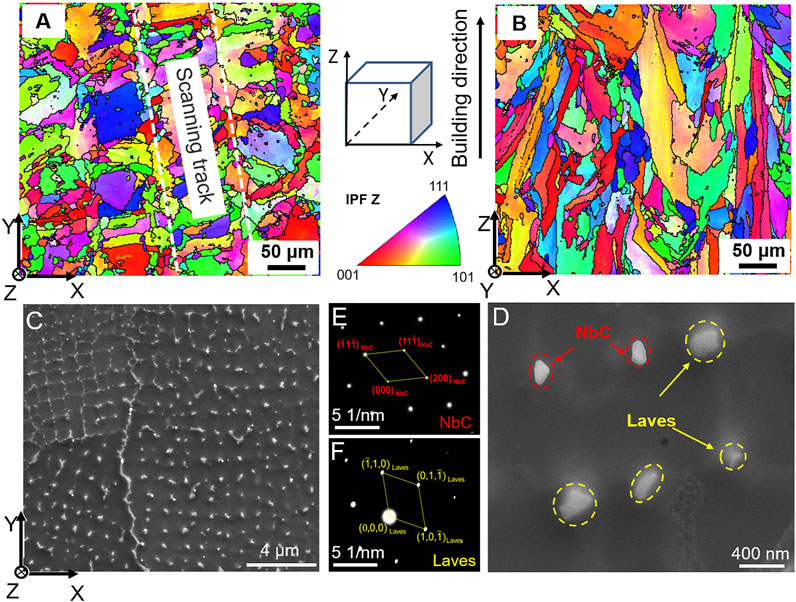
FIGURE 2. EBSD maps of as-built Inconel 718 samples, (A) IPF Z color mappings on XY plane, (B) IPF Z color mappings on XZ plane, SEM images on XY plane, (C) lower magnification, (D) higher magnification, (E,F) electron diffractions of Laves phase and NbC phase.
The high cooling rate and cyclic temperature profile are the main reasons for the formation of columnar grains, which exhibit as cellular substructures in the range of 0.5–1.5 μm on the XY plane of Inconel 718 alloy fabricated by L-PBF, as shown in Figure 2C. The main secondary phase of as-built Inconel 718 is the fine white Laves phase and a little amount of bright NbC phase, according to Figure 2D–F. The results indicate that the dispersed Laves phase and NbC phase are mainly distributed on cellular substructure boundaries. The area fractions of Laves phase and NbC phase are 2.24% ± 0.25, and 0.23% ± 0.06, respectively. During the L-PBF process, the molten metal is solidified after laser scanning, and solutes at the solid/liquid (S/L) interface are redistributed. With the movement of the S/L interface, solutes (Nb, Mo, Ti, Al) are accumulated at the front of the interface, and most of the solutes are partitioned to the residual liquid phase. Due to insufficient back diffusion, significant solute segregation was observed in the solid. The solutes remaining in the residual liquid diffuse and enrich between the dendrites. Therefore, NbC phase with higher melting points and Laves phase with lower melting points are precipitated from the residual liquid phase, which consumes a large number of the Nb elements required by the formation of γ′ and γ″ strengthening phases. The amount of strengthening phases precipitated in aging is reduced, which is unfavorable to the mechanical properties. The microstructure evolution of solute distribution and secondary phase (Laves) of Inconel 718 alloy during L-PBF process and homogenization are analyzed.
4.2 Solidified microstructure model established by phase field
The several cellular substructures of as-built Inconel 718 fabricated via the L-PBF are simulated to describe its characteristics in the MICRESS software with the multiphase-field model. The solute trapping and secondary phases in the L-PBF solidification microstructure are analyzed. The simulation results of cellular substructure and Laves phase distribution on XY plane are shown in Table 4; Figure 3A. The white Laves phases are distributed on the boundary of cellular substructure, and its area fraction is about 2.19%, which is much coincided with the experimental measurement results (area fraction of 2.24% ± 0.25). Figure 3B shows that, in the as-built Inconel 718 sample, the solutes with equilibrium partition coefficients (obtain from Thermo-Calc) less than 1, such as Mo, Nb, Ti, and Al, are segregated between cellular substructures, and the segregation of Nb is the most significant. The solutes with equilibrium partition coefficient greater than 1, such as Cr and Fe, are segregated in cellular substructures. The SEM-EDS maps of solute distribution are shown in Figure 4, which qualitatively verifies the segregation of each element in the simulated results. As shown in Figure 3C, the calculation results (dashed lines) agree well with the overall trends of EPMA measurement results (solid lines), which shows that the multiphase-field model can effectively calculate the solute distribution in the rapid solidification. Nb element is an important component of γ′ and γ″ strengthening phases of Inconel 718 alloy, and its concentration and distribution in the matrix directly determine the strengthening effect. Therefore, the evolution of the Nb element is used as one of the important indicators for measuring the homogenization effect in current work.
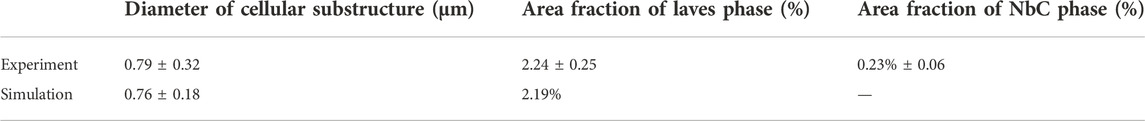
TABLE 4. Experiment and simulation of microstructural characteristics.
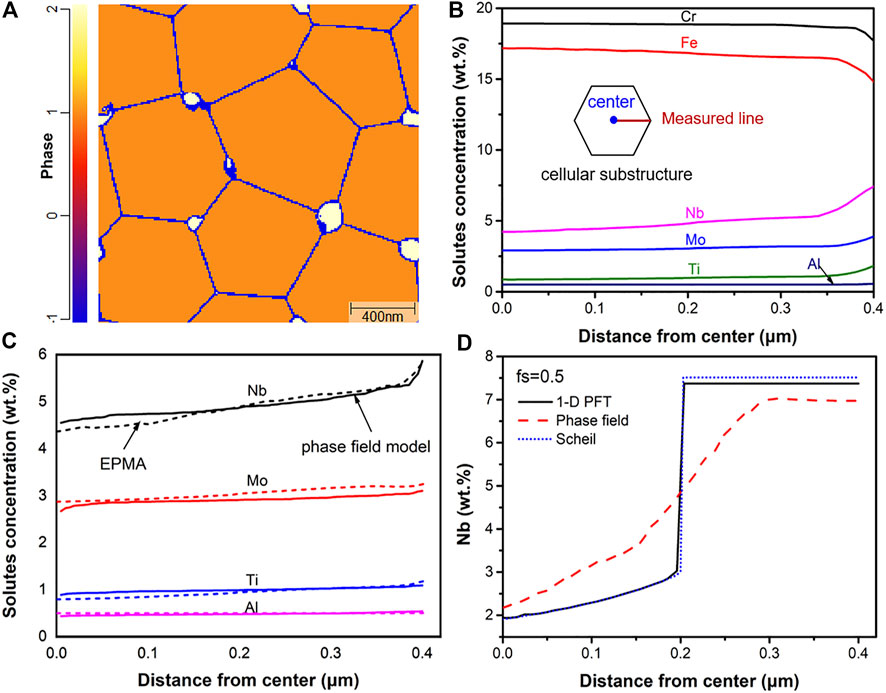
FIGURE 3. Simulation results of (A) cellular substructure and Laves phase distribution, (B) solute distribution curves from center to edge in cellular substructure. Solutes distribution curves, (C) EPMA measurements and multiphase-field model simulation results, (D) Nb distribution calculated by 1-D PFT model, multiphase-field model, and Scheil model when fs = 0.5.
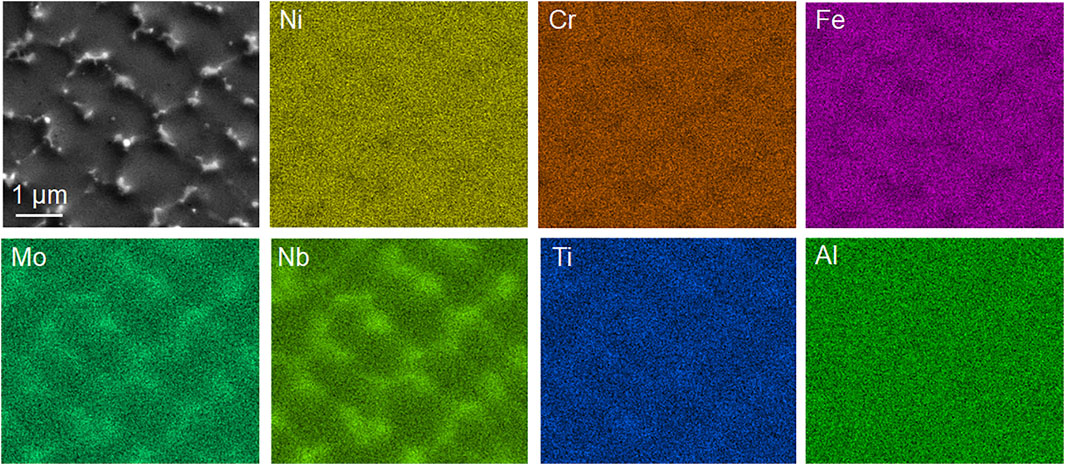
FIGURE 4. SEM-EDS maps of solutes in cellular substructures of as-built Inconel 718 sample.
The solute trapping effect in the solute distribution process is the main feature that distinguishes the L-PBF process from other conventional casting processes. To confirm the solute trapping effect in the calculated results by multiphase-field model, the solutes partition behavior is compared with that calculated by Scheil model and Pseudo Front Tracking (PFT) model (Du and Jacot, 2005), as shown in Figure 3D. Scheil is a classic model of non-equilibrium solidification, in where there is no diffusion in solid phase and infinite diffusion in liquid phase. The PFT model is a sharp interface model developed by (Jacot and Rappaz. (2002); Du and Jacot. (2005); Du et al. (2007), which considers the limited diffusion in solid and liquid phases. The 1-D PFT model is based on the assumption of local equilibrium at S/L interface, which is suitable for microstructure simulation in sub rapid solidification process without solute trapping. The quasi-equilibrium is assumed at the interface on the multiphase-field model, which make it possible to capture solute trapping. The solute concentration in primary phase gradually increases from the center to the edge of the cellular substructure under the effect of local equilibrium at S/L interface and back diffusion in the primary phase. Therefore, the solute concentration in solid calculated by Scheil is higher than that in the 1-D PFT model due to the absence of diffusion in primary phase. The S/L interface of the multiphase-field model is a dispersion interface with a certain thickness, and no obvious solid/liquid boundary in the calculation results of Nb solute distribution showing an increasing trend as a whole. As shown in Figure 3D that in the solidified matrix phase, the Nb solute concentration calculated via the multiphase-field model is higher than that calculated by PFT model. The higher part is the difference of Nb concentration calculated by PFT and multiphase-field models due to the solute trapping in the rapid solidification, which proves that multiphase-field simulation can effectively capture solute trapping. The phase filed model provides the possibility for the accurate simulation of solidification microstructure characteristics, which is an essential foundation for optimizing the subsequent heat treatment process.
4.3 Effect of homogenization time on microstructure and mechanical properties
Based on the simulated results of as-built Inconel 718 samples, the evolution of microstructure in subsequent homogenization process is carried out to analyze the effect of homogenization time on its microstructure evolution and mechanical properties. As shown in Figures 5A, B, the solute fields of Nb and phase field in the cellular substructure are simulated at the homogenization temperature of 1,080°C for 0.5–4.0 h by phase-field method. The results indicate that the solute distribution gradually tends to be uniform, and the fraction of Laves phase is significantly reduced during the homogenization process. Under the same conditions, the experimental results are also shown in Figure 5C, which also indicate the reduction of Laves phase particles in size and number density. Since the NbC phase will not dissolve in the homogenization process, it is ignored in the phase field calculation. Therefore, compared with the calculated results, it seems that there are more second phases in the experimental results. Some solutes, such as Nb, Ti, Al, required for strengthening phase are contained in brittle Laves phase, which would result in initiation and propagation of cracks. Therefore, one of the purposes of homogenization is to dissolve Laves phase particles as many as possible, so as to release the solutes required for strengthening phases and improve the effect of subsequent aging strengthening.
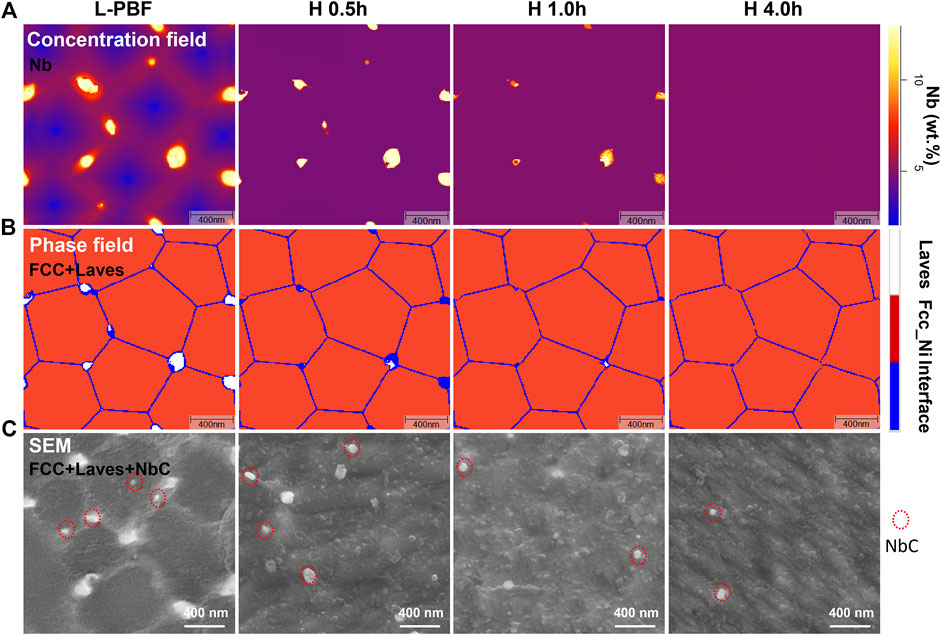
FIGURE 5. (A) Simulated concentration fields of Nb, (B) phase field, and (C) SEM images at the homogenization temperature of 1,080°C for 0–4.0 h.
The area fractions of Laves phase and homogenization time in the simulation and experimental results show a nonlinear relationship as shown in Figure 6A. The distribution trend of the calculated results agrees with the experimental results, which proves the reliability of the calculated results. Although the measurement method has been standardized as much as possible, it will inevitably lead to measurement error and hinder its validation of the simulation results. However, it does not affect the analysis of the microstructure evolution during the homogenization process. During the short-time homogenization process (less than 1.0 h), the area fraction of Laves decreases rapidly with the increase of homogenization time. However, with the increase of the homogenization time, the Laves area fraction decreases slightly during a longer homogenization time (above 1.0 h). According to Figure 6B, the solute diffusion is promoted by high concentration gradient of as-built Inconel 718 samples at the beginning of homogenization, and the dissolution rate of the secondary phase (Laves phase) is higher. The solutes in the substructure have been evenly distributed at the homogenization time of 0.5 h. With the increase of homogenization time (more than 0.5 h), the solute concentration distribution in the substructure becomes uniform, so that solutes diffusion rate decreases, and dissolution rate of the secondary phase decreases.
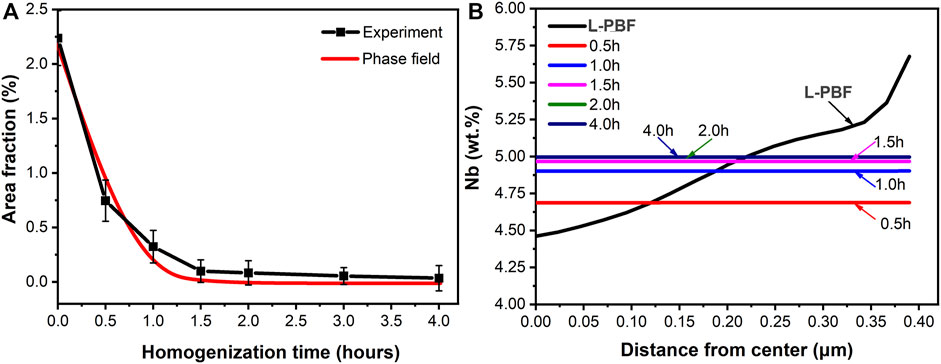
FIGURE 6. At the homogenization temperature of 1,080°C for 0.5–4.0 h, (A) area fractions of Laves phase in simulation and experimental results, (B) distribution curves of Nb element along the radius of cellular substructure simulated by phase-field.
The grain orientation evolution under conditions with different homogenization times (0.5 h–4.0 h) at 1,080°C was analyzed by EBSD maps, as shown in Figures 7A–D, and twin grain boundaries are marked by black lines. With the increase of the homogenization time, the morphology of the strip-shaped grains on the XY plane no longer exhibit the regularity of parallel arrangement gradually. The grains are merged and keep growing, and the average grain radius increase from 4.9 μm of the as-built sample to 13.5 μm of the homogenized sample at 1,080°C for 4.0 h, as shown in Figure 8A. There are about 67% area fraction of the Laves phase generated during L-PBF process are dissolved at homogenization time of 0.5 h. After a longer time (more than 1.0 h) of homogenization, the twins grow significantly. The area fractions of twins under the homogenization conditions of 1.5 h, 2.0 h, and 4.0 h are 22.43%, 27.78%, and 46.41%, respectively. The subsequent solid solution (S: 980 °C/1 h) and double aging (A: 720°C/8 h + 620°C/8 h) treatments are carried out for the samples homogenized with different time to analyze the effect of homogenization time on the final mechanical properties of Inconel 718 samples fabricated via L-PBF. The evolution of the microstructure during homogenization process will also affect the microstructure characteristics and mechanical properties of the final aged samples.
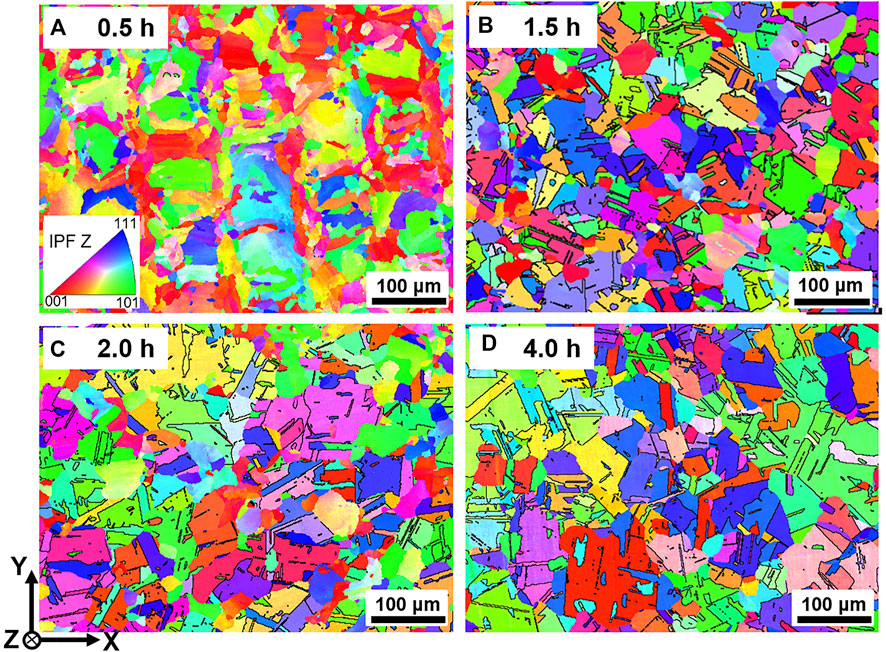
FIGURE 7. EBSD IPF images of Inconel 718 samples fabricated via the L-PBF at homogenization temperature of 1,080°C for different times (A) 0.5 h, (B) 1.5 h, (C) 2.0 h, and (D) 4.0 h.
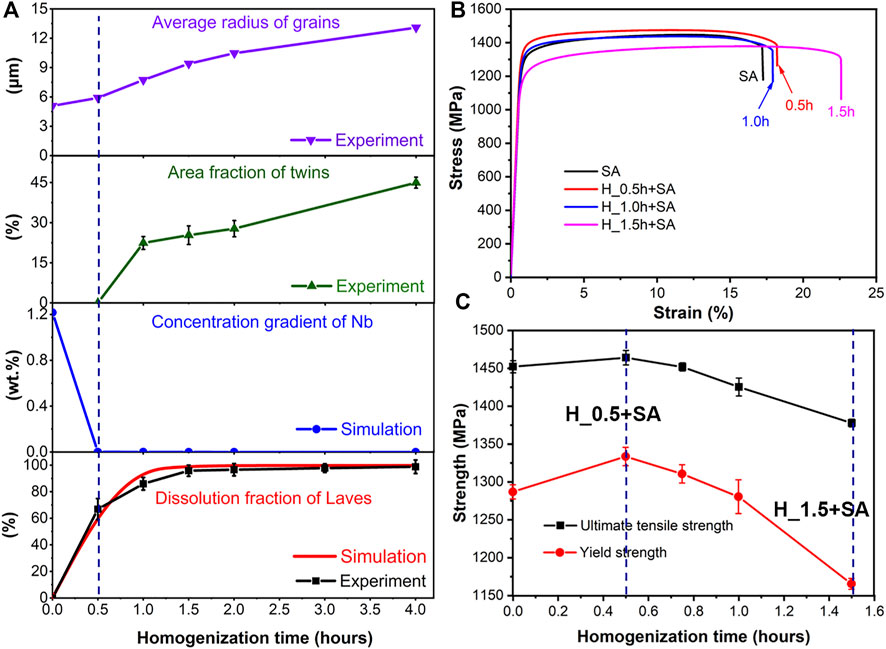
FIGURE 8. (A) Average grain size, area fraction of twins, simulated concentration gradient of Nb, and area fraction of laves phase at homogenization temperature of 1,080°C for different times, (B,C) ultimate tensile strength and yield strength of HSA heated Inconel 718 samples at different homogenization time.
Figures 8B, C shows stress-strain curves, ultimate tensile strength and yield strength of the aging-heat-treated Inconel 718 samples. The results indicates that with the increase of homogenization time, the strength also increases initially and then decreases, reaching the maximum at homogenization time of 0.5 h. The ultimate tensile strength is 1,465 ± 9 MPa, which is about 6% higher than that of 1,378 ± 5 MPa at the homogenization time of 1.5 h. The yield strength is 1,334 ± 12 MPa, which is 14% higher than that of 1,165 ± 7 MPa when the homogenization time is 1.5 h. However, the elongation of the final aging-heat-treated Inconel 718 samples under the condition of homogenization time of 0.5 h decreased from 23.6 ± 0.8% to 17.9 ± 0.5% in reference to the condition of homogenization time of 0.5 h. Although the ductility at the homogenization time of 0.5 h is significantly reduced, it is still higher than the minimum value of 12% specified in the AMS5663 M (for Inconel 718 components, ultimate tensile strength and the yield strength are 1,276 MPa and 1,034 MPa respectively).
The distribution and electron diffraction patterns of strengthening phases (γ′, γ″) along the [011] and [
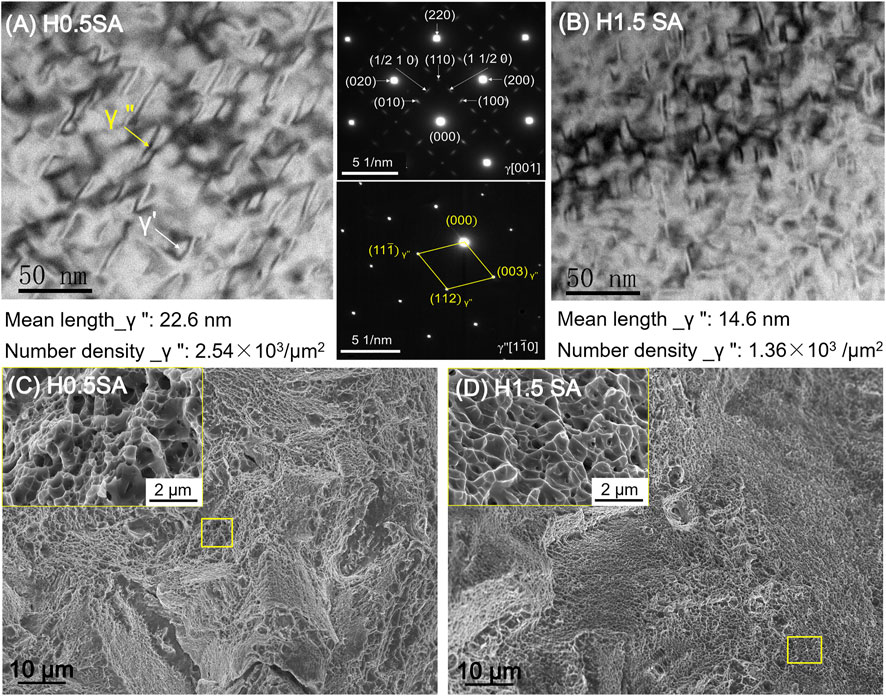
FIGURE 9. (A,B) Bright-field TEM micrographs and electron diffraction patterns of strengthening phases (γ′, γ″) along the [001] and [
The simulation and experimental results show that a large number of Laves phase particles at cellular substructure and grain boundaries are dissolved. When the homogenization time increases to 0.5 h, the solutes, such as Mo and Nb, Ti, are greatly increased and evenly distributed gradually. The increase and uniform distribution of solutes in the matrix phase are beneficial to achieve high yield strength. Therefore, strength increase as the homogenization time increases when the homogenized time is less than 0.5 h, as shown in Figure 8C. However, when the homogenized time is greater than 1.0 h, the strength of the aged Inconel 718 samples decreases with the increase of homogenization time. One reason is that many annealing twins are generated and growth. The other reason is that the grains grow significantly as the homogenization time increases, which also adversely affects the strength. According to the simulated results in the homogenization, a large number of Laves phase particles have been dissolved and the solutes have been distributed evenly at the homogenization time of 0.5 h. In addition, when the homogenization time is 0.5 h, there is no obvious grain evolution according to experimental results. Therefore, under the combined effects of solute concentration evolution, secondary phase dissolution, annealing twin evolution, and grain growth, the strength shows non-monotonic trends. They increase initially and then decrease with the increase of homogenization time, reaching the maximum at the homogenization time of 0.5 h.
Based on the homogenization simulation results, δ phase (Ni3(Nb, Ti)) and strengthening phases (γ″, γ′) precipitated in solution and double aging heat treatments with different process parameters will be modeled in our future study. The δ phase precipitated at the grain boundaries during the solid solution can strengthen grain boundaries, but it also consumes the solutes required for strengthening phases. Microstructure simulation method are useful to study the precipitation and evolution of δ phase under different solution parameters to balance the effects of grain boundary strengthening and aging strengthening. According to the precipitation strengthening mechanism and mechanical property test results, the effects of size and volume fraction of precipitate phases on mechanical properties are valuable for obtaining the most suitable heat treatment parameters.
5 Conclusion
In this paper, based on the solidified microstructure model established by multiphase field simulation, the effects of homogenization time on microstructural evolution and mechanical properties are analyzed and optimized. The following conclusions are obtained:
1) Considering the solute trapping in the solidified microstructure model, the simulated results are consistent with the experimental results, such as solute distribution and area fraction of the secondary phase (Laves). The advantages of the multiphase-field model in calculating solutes distribution in L-PBF printed Inconel 718 are demonstrated.
2) Combining phase field simulations and experimental studies, it is found that when the homogenization time is 0.5 h, 67% area fraction of the laves phase are dissolved and the concentration gradient of Nb along the radius of the cellular substructure decreases from the initial 1.217 wt% to 0.001 wt%, which have achieved the homogenization purpose.
3) Under the condition of homogenization time of 0.5 h optimized by phase filed simulation, the yield strength (YS) is 1,334 ± 12 MPa, and the ultimate tensile strength (UTS) is 1,465 ± 9 MPa. Compared with that at the homogenization time of 1.5 h, i.e., standard HSA heat treatment (AMS 5383), the YS and UTS are increased by 14% and 6%, respectively.
Data availability statement
The original contributions presented in the study are included in the article/supplementary material, further inquiries can be directed to the corresponding authors.
Author contributions
MC: Investigation, Conceptualization, Methodology, Writing—original draft. QD: Conceptualization, Methodology, Supervision, Resources, Writing—review and editing. RS: Supervision, Resources, Writing—review and editing. HF: Supervision, Resources, Writing—review and editing. ZL: Supervision, Resources, Writing—review and editing. JX: Supervision, Resources, Writing—review and editing, Funding acquisition, Project administration.
Funding
This work was supported by the following fund projects: National Natural Science Foundation of China (Nos. 52090041, 52022011), National Major Science and Technology Projects of China (No. J2019-VI-0009-0123), and Key-area Research and Development Program of Guangdong Province (No. 2019b010943001).
Conflict of interest
The authors declare that the research was conducted in the absence of any commercial or financial relationships that could be construed as a potential conflict of interest.
Publisher’s note
All claims expressed in this article are solely those of the authors and do not necessarily represent those of their affiliated organizations, or those of the publisher, the editors and the reviewers. Any product that may be evaluated in this article, or claim that may be made by its manufacturer, is not guaranteed or endorsed by the publisher.
References
Blackwell, P. L. (2005). The mechanical and microstructural characteristics of LaserDeposited IN718. J. Mat. Process. Technol. 170, 240–246. doi:10.1016/j.jmatprotec.2005.05.005
Böttger, B., Eiken, J., and Steinbach, I. (2006). Phase field simulation of equiaxed solidification in technical alloys. Acta Mat. 54, 2697–2704. doi:10.1016/j.actamat.2006.02.008
Boussinot, G., Apel, M., Zielinski, J., Hecht, U., and Schleifenbaum, J. H. (2019). Strongly out-of-Equilibrium columnar solidification during laser powder-bed fusion in additive manufacturing. Phys. Rev. Appl. 11, 014025. doi:10.1103/PhysRevApplied.11.014025
Cao, M., Zhang, D. Y., Gao, Y., Chen, R. P., Huang, G. L., Feng, Z., et al. (2021). The effect of homogenization temperature on the microstructure and high temperature mechanical performance of SLM-fabricated IN718 alloy. Mater. Sci. Eng. A 801, 140427. doi:10.1016/j.msea.2020.140427
Chen, D., Chen, W., Liu, Y., and Sun, D. (2022). A two-relaxation-time lattice Boltzmann model for electron beam selective melting additive manufacturing. Front. Mat. 9. doi:10.3389/fmats.2022.885481
Chen, L. Q., and Zhao, Y. (2022). From classical thermodynamics to phase-field method. Prog. Mat. Sci. 124, 100868. doi:10.1016/j.pmatsci.2021.100868
Dai, R., Yang, S., Zhang, T., Zhong, J., Chen, L., Deng, C., et al. (2022). High-throughput screening of optimal process parameters for PVD TiN coatings with best properties through a combination of 3-D quantitative phase-field simulation and hierarchical multi-objective optimization strategy. Front. Mat. 9. doi:10.3389/fmats.2022.924294
De Bartolomeis, A., Newman, S. T., Jawahir, I. S., Biermann, D., and Shokrani, A. (2021). Future research directions in the machining of Inconel 718. J. Mat. Process. Technol. 297, 117260. doi:10.1016/j.jmatprotec.2021.117260
Du, Q., Azar, A. S., and M'Hamdi, M. (2022). Kinetic interface condition phase diagram for the rapid solidification of multi-component alloys with an application to additive manufacturing. Calphad 76, 102365. doi:10.1016/j.calphad.2021.102365
Du, Q., Eskin, D., Jacot, A., and Katgerman, L. (2007). Two-dimensional modelling and experimental study on microsegregation during solidification of an Al-Cu binary alloy. Acta Mat. 55, 1523–1532. doi:10.1016/j.actamat.2006.10.035
Du, Q., and Jacot, A. (2005). A two-dimensional microsegregation model for the description of microstructure formation during solidification in multicomponent alloys: Formulation and behaviour of the model. Acta Mat. 53, 3479–3493. doi:10.1016/j.actamat.2005.04.004
Du, Q., Tang, K., Marioara, C. D., Andersen, S. J., Holmedal, B., and Holmestad, R. (2017). Modeling over-ageing in Al-Mg-Si alloys by a multi-phase CALPHAD-coupled kampmann-wagner numerical model. Acta Mat. 122, 178–186. doi:10.1016/j.actamat.2016.09.052
Eiken, J., Bottger, B., and Steinbach, I. (2006). Multiphase-field approach for multicomponent alloys with extrapolation scheme for numerical application. Phys. Rev. E 73, 066122. doi:10.1103/PhysRevE.73.066122
Hosseini, E., and Popovich, V. A. (2019). A review of mechanical properties of additively manufactured Inconel 718. Addit. Manuf. 30, 100877. doi:10.1016/j.addma.2019.100877
Hu, Y. S., Wang, G., Ji, Y. Z., Wang, L. P., Rong, Y. M., and Chen, L. Q. (2019). Study of θ’ precipitation behavior in Al-Cu-Cd alloys by phase-field modeling. Mater. Sci. Eng. A 746, 105–114. doi:10.1016/j.msea.2019.01.012
Jacot, A., and Rappaz, M. (2002). A pseudo-front tracking technique for the modelling of solidification microstructures in multi-component alloys. Acta Mat. 50, 1909–1926. doi:10.1016/S1359-6454(01)00442-6
Karma, A. (2001). Phase-field formulation for quantitative modeling of alloy solidification. Phys. Rev. Lett. 87, 115701. doi:10.1103/physrevlett.87.115701
Kumara, C., Balachandramurthi, A. R., Goel, S., Hanning, F., and Moverare, J. (2020). Toward a better understanding of phase transformations in additive manufacturing of alloy 718. Materialia 13, 100862. doi:10.1016/j.mtla.2020.100862
Kumara, C., Segerstark, A., Hanning, F., Dixit, N., Joshi, S., Moverare, J., et al. (2019). Microstructure modelling of laser metal powder directed energy deposition of alloy 718. Addit. Manuf. 25, 357–364. doi:10.1016/j.addma.2018.11.024
Luo, Z. b., and Zhao, Y. y. (2019). Efficient thermal finite element modeling of selective laser melting of Inconel 718. Comput. Mech. 65, 763–787. doi:10.1007/s00466-019-01794-0
Luu, D. N., Zhou, W., and Nai, S. M. L. (2022). Mitigation of liquation cracking in selective laser melted Inconel 718 through optimization of layer thickness and laser energy density. J. Mat. Process. Technol. 299, 117374. doi:10.1016/j.jmatprotec.2021.117374
Nabavizadeh, S. A., Eshraghi, M., and Felicelli, S. D. (2020). Three-dimensional phase field modeling of columnar to equiaxed transition in directional solidification of Inconel 718 alloy. J. Cryst. Growth 549, 125879. doi:10.1016/j.jcrysgro.2020.125879
Nandy, J., Sarangi, H., and Sahoo, S. (2019). A review on direct metal laser sintering: Process features and microstructure modeling. Lasers Manuf. Mat. Process. 6, 280–316. doi:10.1007/s40516-019-00094-y
Park, J., Kang, J. H., and Oh, C. S. (2020a). Phase-field simulations and microstructural analysis of epitaxial growth during rapid solidification of additively manufactured AlSi10Mg alloy. Mat. Des. 195, 108985. doi:10.1016/j.matdes.2020.108985
Park, J., Oh, C. S., Kang, J. H., Jung, J. G., and Lee, J. M. (2020b). Solidification and precipitation microstructure simulation of a hypereutectic Al-Mn-Fe-Si alloy in semi-quantitative phase-field modeling with experimental aid. Metals 10, 1325. doi:10.3390/met10101325
Paturi, U. M. R., Vidhya, D. B., and Reddy, N. S. (2021). Progress of machinability on the machining of Inconel 718: A comprehensive review on the perception of cleaner machining. Clean. Eng. Technol. 5, 100323. doi:10.1016/j.clet.2021.100323
Rahul, M. R., Samal, S., and Phanikumar, G. (2020). Metastable microstructures in the solidification of undercooled high entropy alloys. J. Alloys Compd. 821, 153488. doi:10.1016/j.jallcom.2019.153488
Rao, G. A., Kumar, M., Srinivas, M., and Sarma, D. S. (2003). Effect of standard heat treatment on the microstructure and mechanical properties of hot isostatically pressed superalloy Inconel 718. Mater. Sci. Eng. A 355, 114–125. doi:10.1016/s0921-5093(03)00079-0
Reed, R. C. (2006). The superalloys: Fundamentals and applications. Cambridge: Cambridge University Press.
Sahoo, S., and Chou, K. (2016). Phase-field simulation of microstructure evolution of Ti-6Al-4V in electron beam additive manufacturing process. Addit. Manuf. 9, 14–24. doi:10.1016/j.addma.2015.12.005
Sahoo, S., and Chou, K. (2014). “Review on phase-field modeling of microstructure evolutions: Application to electron beam additive manufacturing,” in ASME 2014 int. Manuf. Sci. Eng. Conf., proc. MSEC2014-3901, V002T02A020, 9. doi:10.1115/MSEC2014-3901
Sahoo, S. (2022). Prognostication of microstructure evolution during laser powder bed fusion of aluminum alloy using phase-field method. J. Laser Appl. 34, 022014. doi:10.2351/7.0000658
Seiz, M., and Nestler, B. (2021). Modelling and simulation of the freeze casting process with the phase-field method. Comput. Mat. Sci. 193, 110410. doi:10.1016/j.commatsci.2021.110410
Steinbach, I., Pezzolla, F., Nestler, B., Seeßelberg, M., Prieler, R., Schmitz, G. J., et al. (1996). A phase field concept for multiphase systems. Phys. D. Nonlinear Phenom. 94, 135–147. doi:10.1016/0167-2789(95)00298-7
Steinbach, I. (2009). Phase-field models in materials science. Model. Simul. Mat. Sci. Eng. 17, 073001. doi:10.1088/0965-0393/17/7/073001
Sui, S., Chen, J., Fan, E. X., Yang, H. O., Lin, X., and Huang, W. (2017). The influence of laves phases on the high-cycle fatigue behavior of laser additive manufactured Inconel 718. Mater. Sci. Eng. A 695, 6–13. doi:10.1016/j.msea.2017.03.098
Trosch, T., Strößner, J., Völkl, R., and Glatzel, U. (2016). Microstructure and mechanical properties of selective laser melted Inconel 718 compared to forging and casting. Mat. Lett. 164, 428–431. doi:10.1016/j.matlet.2015.10.136
Wang, X. Q., and Chou, K. (2018). Microstructure simulations of Inconel 718 during selective laser melting using a phase field model. Int. J. Adv. Manuf. Technol. 100, 2147–2162. doi:10.1007/s00170-018-2814-z
Xiao, W. J., Li, S. M., Wang, C. S., Shi, Y., Mazumder, J., Xing, H., et al. (2019). Multi-scale simulation of dendrite growth for direct energy deposition of nickel-based superalloys. Mat. Des. 164, 107553. doi:10.1016/j.matdes.2018.107553
Yuan, K. B., Guo, W. G., Li, P. H., Wang, J., Su, Y., Lin, X., et al. (2018). Influence of process parameters and heat treatments on the microstructures and dynamic mechanical behaviors of Inconel 718 superalloy manufactured by laser metal deposition. Mater. Sci. Eng. A 721, 215–225. doi:10.1016/j.msea.2018.02.014
Zeng, Y., Mittnacht, T., Werner, W., Du, Y., Schneider, D., and Nestler, B. (2021). Gibbs energy and phase-field modeling of ferromagnetic ferrite (α)→ paramagnetic austenite (γ) transformation in Fe-C alloys under an external magnetic field. Acta Mat. 225, 117595. doi:10.1016/j.actamat.2021.117595
Zhang, D. Y., Niu, W., Cao, X. Y., and Liu, Z. (2015). Effect of standard heat treatment on the microstructure and mechanical properties of selective laser melting manufactured Inconel 718 superalloy. Mater. Sci. Eng. A 644, 32–40. doi:10.1016/j.msea.2015.06.021
Zhang, M., Wang, J., Han, J., Sui, H., Huang, H., Jin, K., et al. (2019). Optimization of heat treatment process of Al-Mg-Si cast alloys with Zn additions by simulation and experimental investigations. Calphad 67, 101684. doi:10.1016/j.calphad.2019.101684
Zhao, X. M., Chen, J., Lin, X., and Huang, W. D. (2008). Study on microstructure and mechanical properties of laser rapid forming Inconel 718. Mater. Sci. Eng. A 478, 119–124. doi:10.1016/j.msea.2007.05.079
Keywords: phase field, Inconel 718, laser powder bed fusion, laves phase, mechanical properties
Citation: Chen M, Du Q, Shi R, Fu H, Liu Z and Xie J (2022) Phase field simulation of microstructure evolution and process optimization during homogenization of additively manufactured Inconel 718 alloy. Front. Mater. 9:1043249. doi: 10.3389/fmats.2022.1043249
Received: 13 September 2022; Accepted: 28 November 2022;
Published: 06 December 2022.
Edited by:
Benjamin Klusemann, Leuphana University Lüneburg, GermanyReviewed by:
Seshadev Sahoo, Siksha O Anusandhan University, IndiaLijun Zhang, Central South University, China
Copyright © 2022 Chen, Du, Shi, Fu, Liu and Xie. This is an open-access article distributed under the terms of the Creative Commons Attribution License (CC BY). The use, distribution or reproduction in other forums is permitted, provided the original author(s) and the copyright owner(s) are credited and that the original publication in this journal is cited, in accordance with accepted academic practice. No use, distribution or reproduction is permitted which does not comply with these terms.
*Correspondence: Qiang Du, cWlhbmcuZHVAc2ludGVmLm5v; Renhai Shi, cmVuaGFpLnNoaS5uaWNrQGdtYWlsLmNvbQ==