 Yuxi Liu
 Yu Chen2†
- 1College of Materials and Chemical Engineering, Chuzhou University, Chuzhou, China
- 2Lianyungang Jingwei Advanced Composite Material Co. Ltd., Lianyungang, China
- 3National Key Laboratory of Science and Technology on Advanced Composites in Special Environments, Harbin Institute of Technology, Harbin, China
A flexible composite tank is developed for the storage of oil and gas. The tank is made of coated fabric, which is a thermoplastic polyurethane reinforced aramid fiber, to satisfy strength, sealing, and fluid compatibility requirements. The top and bottom areas of the tank are connected with a rod to fix the tank height during inflation. The tank deformation is studied. Experimental tests are conducted on two prototypes of 0.4 m height and a prototype of 1.7 m height in a water basin. The test for the small prototypes focuses on obtaining deformed shapes. The test for the 1.7-m height prototype focuses on obtaining strain sensor readings. The tank collapses initially from the bottom part, propagates upward, and then finally only the top part retains the initial shape when the tank is empty. The deformation process is also simulated using a finite element analysis (FEA) model. Results show that the deformation shape of the tank was simulated effectively compared with that in the experimental results. The FEA results are conservative compared with the test results, given that the tank deformation is irregular and the maximum strain was difficult to record during the test. This research provides insight into the deformation behavior of a flexible tank, and the validated FEA model can be used for future design optimization.
1 Introduction
Flexible tanks are widely used for balloons or buoyant aerobots (Cathey, 2008; Dosselaer, 2014; Zhu et al., 2019; Liao et al., 2021), and the most commonly used shape is a pumpkin balloon (Baginski et al., 2006; Wakefield, 2007; Baginski et al., 2008; Wakefield, 2009; Baginski, Brakke, 2010; Barg et al., 2011; Deng, Pellegrino, 2011; Wakefield, Bown, 2013; Saito et al., 2021). However, for the subsea storage of compressed air or oil, because the buoyancy in water is much greater than that in air, a shape with a larger height/diameter is preferred, as shown in the section presenting natural shapes, although there are several other shapes, such as droplet-shaped balloons (Cheung et al., 2012; Vasel-Be-Hagh et al., 2013; Vasel-Be-Hagh et al., 2015; Wang et al., 2019) and tubular long shapes (Mas, Rezola, 2016). Subsea flexible tanks are experiencing increasing demand from the energy storage industry, which stores stabilized crude or compressed gas underwater (Pimm, Garvey, 2009; Cheung, 2014; Jong, 2014; Pimm et al., 2014; Wang et al., 2016; Festøy, Lundal, 2017; Wang et al., 2017; Letcher, 2022). Such tanks collapse until a balance is reached between the hydrostatic pressure and the inner pressure when the volume decreases; thus, designing against seabed pressure is not required (Cheung, 2014). There are several advantages of flexible tanks compared with conventional steel tanks, such as cost saving, flexibility in size, and being re-installable, enabling the commercialized development of marginal oil fields and even replacing floating storage and offloading.
Studies on the flow structures and force characteristics of the underwater air bags/floating bags have been widely documented since first being proposed in 1987 (Laing, Laing, 1987; Pimm, 2011; Lader et al., 2017; Kurniawan et al., 2021; Mukhlas et al., 2021; Chang, Huang, 2022), mostly of fixed volume. There is still, however, a shortage of studies on the large deformation of storage tanks. The drainage and collapse of a closed flexible cage structure made of fabric have been examined using FhSim (Kristiansen et al., 2018); however, the flexible cage was hemispherical and was floating on the surface for aquaculture. In the present study, the large deformation of a submerged tank from fully-filled to almost empty status is modeled based on general finite element analysis (FEA) software, which is more convenient for the related engineering aspects.
In this study, the tank material is made of thermoplastic polyurethane (TPU)-coated aramid fabric to satisfy strength, sealing, and fluid compatibility requirements. The aramid textile is the main load-carrying structure, mainly for buoyancy, and the coating on each side is designed to prevent the fiber’s chemical degradation due to liquid exposure inside or outside, and to form a liquid-proof container. The tank profile is determined using MATLAB based on the hydrostatic equilibrium, considering the internal crude pressure and outer seawater pressure. The tank is joined together by several pieces of fabric sheets after cutting to form the 3D shape. The top flange and bottom flange are connected with a rod to fix the tank height during inflation.
2 Materials and methods
2.1 Natural tank shape
As shown in Figure 1A, the subsea flexible tank is balanced under buoyancy and gravity.
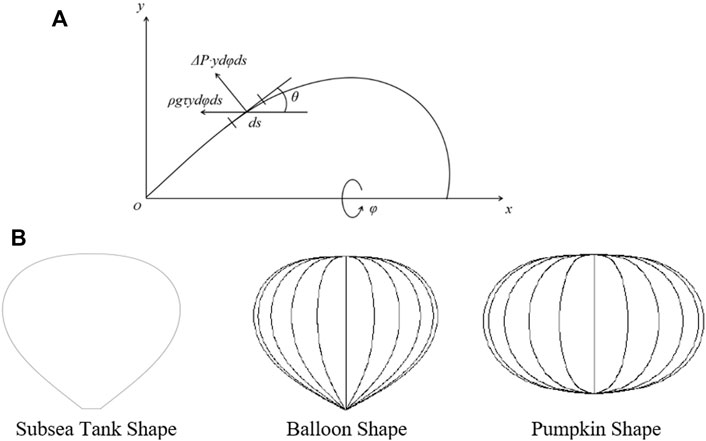
FIGURE 1. Natural tank shape of (A) the coordinate system for shape finding and (B) the profile for the balloon and the underwater tank.
In the X direction,
and in the Y direction,
where
The equations can be simplified into the following:
When
The boundary condition is as follows:
where G is the load at the tank bottom,
The aforementioned equations can be solved using MATLAB software.
For the balloon shape, the height = 0.748 (diameter), and for pumpkin shape, the height = 0.604 (diameter) (Farley, 2005), whereas for the subsea tank, height ≈ diameter, as shown in Figure 1B. The subsea tank has a larger height/ratio than the pumpkin shape and the balloon shape.
2.2 Experimental tests for the large deformation of a composite flexible tank
Three prototypes were manufactured for the test, the height for two of which is 0.4 m, and for the other is 1.7 m. Each tank is made of TPU-coated aramid fabric to satisfy strength, sealing, and fluid compatibility requirements, anchored to the seabed by a mooring line and a net covering the tank surface.
2.2.1 Experimental tests for the 0.4-m height prototypes
One key issue is the effect of the connection between the top and the bottom on the collapse process and the deformed shape of the tank when the volume decreases. Thus, two types of concepts are compared, as shown in Figure 2. For tank #1, a steel rod is placed between the top flange and the bottom, thereby restraining the relative movement between the top and bottom flange, and the flow line is connected to the bottom area. For tank #2, no connection exists between the top flange and bottom flange, and the flow line is connected to the top flange.
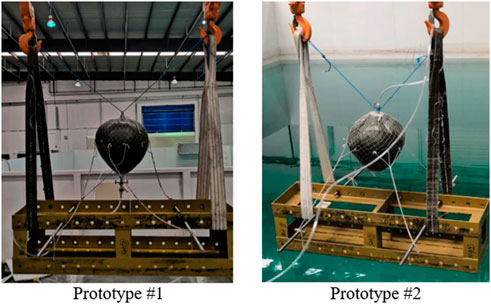
FIGURE 2. Test set-up for the 0.4 m tanks.
The tank is made of 0.7-mm TPU membrane, which is covered by a net and anchored to a clump weight by four mooring lines. The flow line size is 12.7 mm in, and the flow rate is approximately 10 L/min controlled by an air pump. Five cycles of inflation and deflation were performed for each tank. An underwater camera was set up to record the deformed shape when the volume changed.
2.2.2 Experimental tests for the 1.7-m height prototype
Six strain gauges (two channels for each strain gauge, longitudinal direction, and latitudinal direction) were attached to the membrane using glue to monitor the flexible composite tank membrane strain response. The strain gauges were placed in highly stressed areas based on the FEA results, as shown in Figure 3. A strain gauge with 5% range was used. The cable connected to the sensor was also fixed to the membrane using waterproof adhesive tape to avoid disturbance during the large deformation.
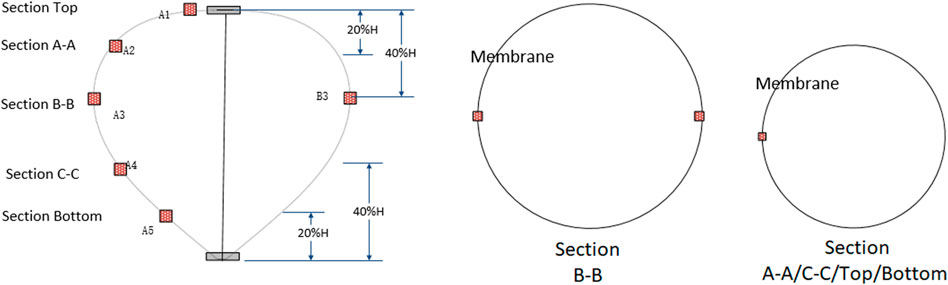
FIGURE 3. Strain gauge on the membrane.
The anti-impact layer was applied to the outer surface of the tank when all the sensors were attached to the membrane and tested in order to mitigate against accidentally dropped objects, such as the anchor. The net was finally attached to the flexible composite tank, including the mooring lines. The flow line, including the flow meter, was assembled beforehand. One end of the flow line was connected to the bottom flange, and the other end was connected to the white oil tank through the pump, which was controlled by the control cabin. The strain gauge cables were connected to the data acquisition system. After all the assembly was completed, the tank was lowered into the water basin using a crane and anchored to the bottom of the water basin, as shown in Figure 4.
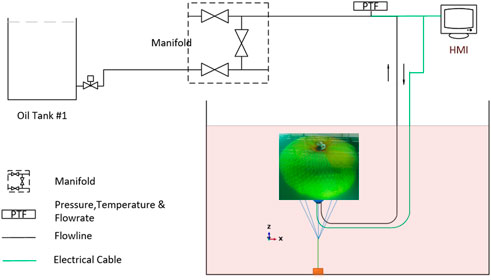
FIGURE 4. Test set-up for the 1.7-m prototype.
The loading/offloading operation was performed between a composite tank underwater and a steel oil tank on the ground. The detailed procedure is as follows:
1) Connect flow lines to steel oil tank #1 on the ground through the onshore manifold, as shown in Figure 4.
2) Connect the electrical cable to the human–machine interface (HMI), and switch on the power for inspection. All sensor reading is shown on the HMI screen, and no alarm/warnings should occur.
3) Start the pump to load oil into the composite tank underwater from steel oil tank #1 on the ground until the internal pressure increases slightly (300 Pa).
4) Hold for at least 15 min.
5) Offload the oil from the composite tank to the steel oil tank #1 on the ground.
6) Hold for at least 15 min.
7) Repeat steps 3–6 for five cycles. One complete cycle consists of loading and offloading, as shown in Figure 5.
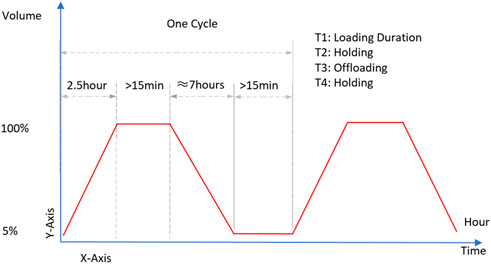
FIGURE 5. Volume–time curve for loading/offloading operation.
3 Results and discussion
3.1 Numerical simulation of the large deformation of a flexible composite tank
3.1.1 Finite element analysis (FEA) model and properties
The deformation process (see Figure 5) of the flexible composite tank under hydrostatic pressure inside and outside the tank was simulated using the general commercial FEA software ABAQUS (2019). The objective of the analysis is to determine the shape of the flexible composite tank at different volumes and the stress/strain of the membrane to verify the design. As shown in Figure 6, the flexible composite tank consists of the membrane, upper flange, lower flange, rigid connection between flanges, net, and mooring cables. The membrane was modeled using the shell element, and the property was obtained from the membrane tensile test report, as shown in Table 1. The flange was modeled using the rigid element, and the net and mooring lines were modeled using the truss element. The fluid cavity function was used to model the tank deformation, with the surface-based fluid-filled cavities modeled using standard finite elements to model the fluid-filled structure and surface definition to provide the coupling between the deformation of the fluid-filled structure and the pressure exerted by the contained fluid on the cavity boundary of the structure.
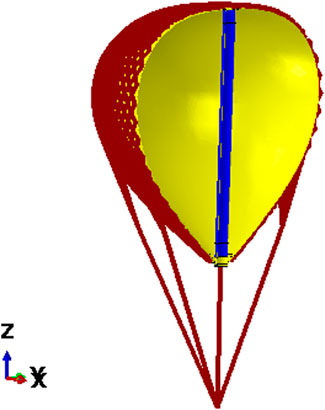
FIGURE 6. Outline of the ABAQUS model for the flexible tank.
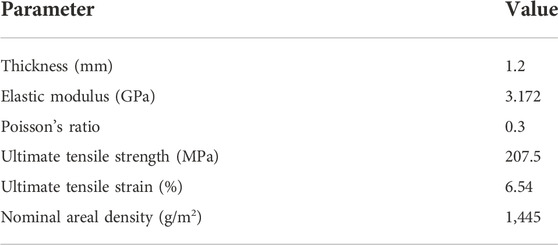
TABLE 1. Membrane specification.
3.1.2 Loading steps and boundary conditions
The explicit dynamic used as the fluid cavity function is only valid for dynamic analysis. A fluid exchange was defined to model the flow between the tank and its environment based on the mass fluid flow, as shown in Table 2. During step 1, the volume was fixed and the hydrostatic pressure was applied to the outer and inner surfaces of the tank in 1 s. Then, the tank reached an equilibrium position under the buoyancy (resulting from internal and outer pressure) and the constraints of the net during step 2. Then, during step 3, the tank volume decreased at a designed flow rate 0.2 m3/s until the tank volume decreased to 5% (1 m3). After another 5 s, the tank volume increased from 5% to 100% in the following 95 s. The analytical field was defined to model the internal pressure and outer hydrostatic pressure assuming an opening exists at the bottom flange area. The passive pressure of the seawater and the internal pressure were applied to the outer surface and inner surface, respectively, as shown in Figure 7. The end of the mooring line was fixed to model the function of the clump weight.
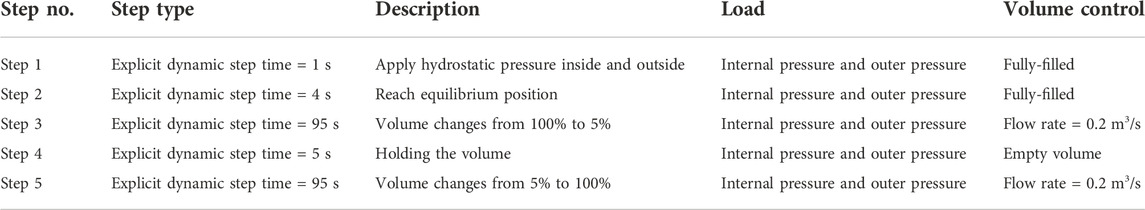
TABLE 2. Loads and volume condition.
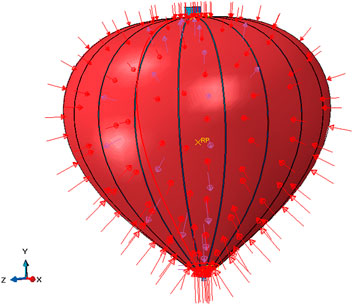
FIGURE 7. FEA model of the deformation–load analysis.
3.2 Deformed tank shape
The tank profile at different volumes from approximately 5%–95% volume is shown in Figure 8A for the tank with a rigid connection between the top/bottom flange, and in Figure 8B for the tank without a rigid connection. As shown in Figure 8A, the tank profile of FEA analysis during deformation is relatively similar to the tank profile observed during the test for the tank with rigid connection between the top and bottom flanges. When 95% of the fluid was inside, the tank was bulged and the tank profile was close to the natural profile. As the volume was reduced, the lower part of the tank collapsed initially during offloading, and then the collapse propagated upward. Finally, only the top part retained the initial shape when the tank was empty.
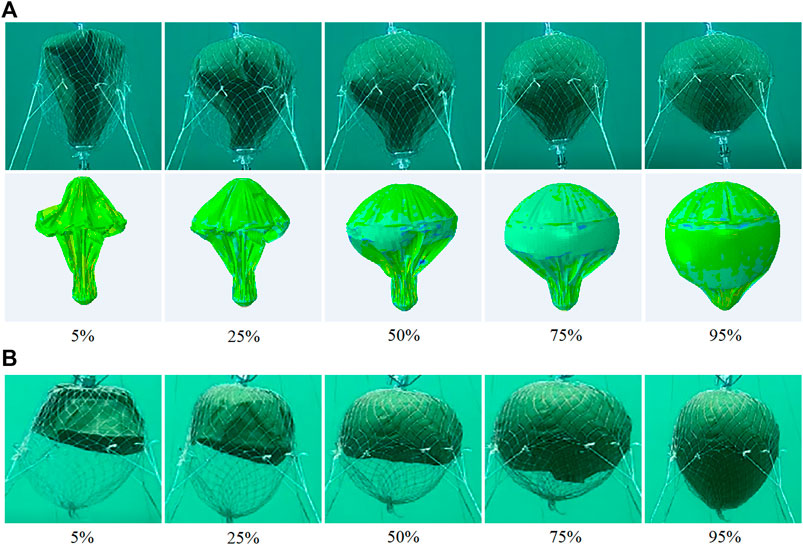
FIGURE 8. Deformed shape of the tank at different volumes: (A) with a rigid connection between the top and bottom flanges; (B) without rigid connection.
The deformed shape is due to the pressure field and the membrane stress in the fabric. According to the Young–Laplace equation, the curvature in the fabric at one point is related to the tension at that point, and the pressure is computed as follows:
where p is the differential pressure across the fabric;
When the tank is overfilled, the tank has a super-pressure status rather than a zero-pressure status, and the membrane is in a state of tension due to the internal pressure. As the volume reduces, the tank is close to a zero-pressure shape, and the latitudinal stress of the membrane is near zero. When the volume is reduced further, the bottom membrane collapses as the differential pressure leads to the inward direction. The local curvature direction changes at different points, as shown in Figure 9. The shape is a convex curve at point #1 near the outer side, whereas the shape at point #2 is a concave curve near the center line, resulting in longitudinal stress on the membrane near the bottom area. Therefore, because the tank is flexible, part of the buoyancy is transferred to the mooring line by the internal hydrostatic pressure applied on the top membrane, and part of the buoyancy is transferred to the mooring line by the rigid connection between the top flange and bottom flange. This finding can be validated by comparing the shape with/without a connection between the top and bottom flanges, as shown in Figure 8. Without a rigid connection between the top and bottom flanges, the bottom part moves upward until it touches the top side membrane; the deformed shape is similar to a jellyfish, as shown in Figure 8B.
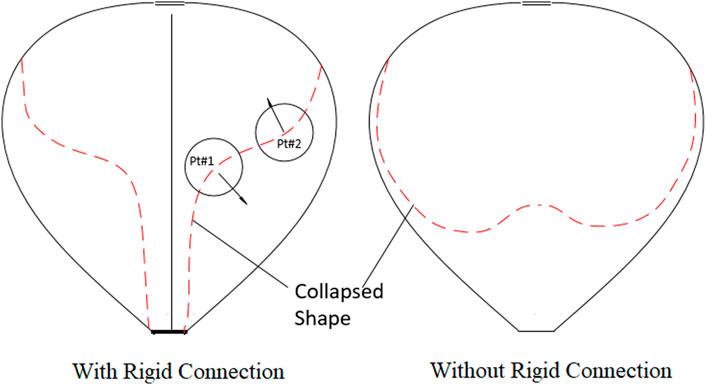
FIGURE 9. Deformed shape and local curvature.
3.3 Membrane strain
Test results for the longitudinal strain and latitudinal strain are shown in Figure 10. The corresponding FEA strain results are shown in Figure 11. For the longitudinal membrane strain, shown in Figure 10A, the strain near the bottom (black line) increases when volume increases slightly from empty (less than 30% volume) as the buoyancy increases. Then, the strain decreases when the volume increases further. As the tank gradually expands and increases the contact surface with the mooring net from the top part, the pressure difference (buoyancy) acts on the top mooring net directly. Meanwhile, the internal pressure and outer pressure tend to balance near the bottom area. Then, the membrane is in a free state when the tank is full. The trend of the strain reverses as the volume becomes smaller from fully filled to empty. The strain trend is consistent with the deformation shown in Figure 8A. The strains in the middle and top also have a similar trend of initially increasing and then decreasing during the process with the volume changing from empty to full. However, the transition point has a larger volume, such that for the top membrane strain, the transition point is approximately 60% volume.
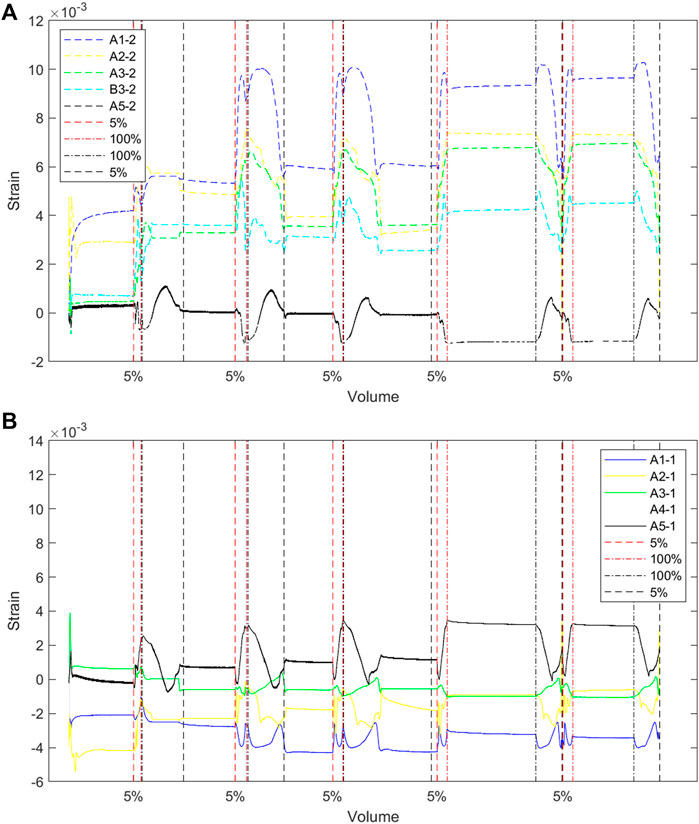
FIGURE 10. Strain of the sensor on the membrane: (A) longitudinal direction; (B) latitudinal direction.
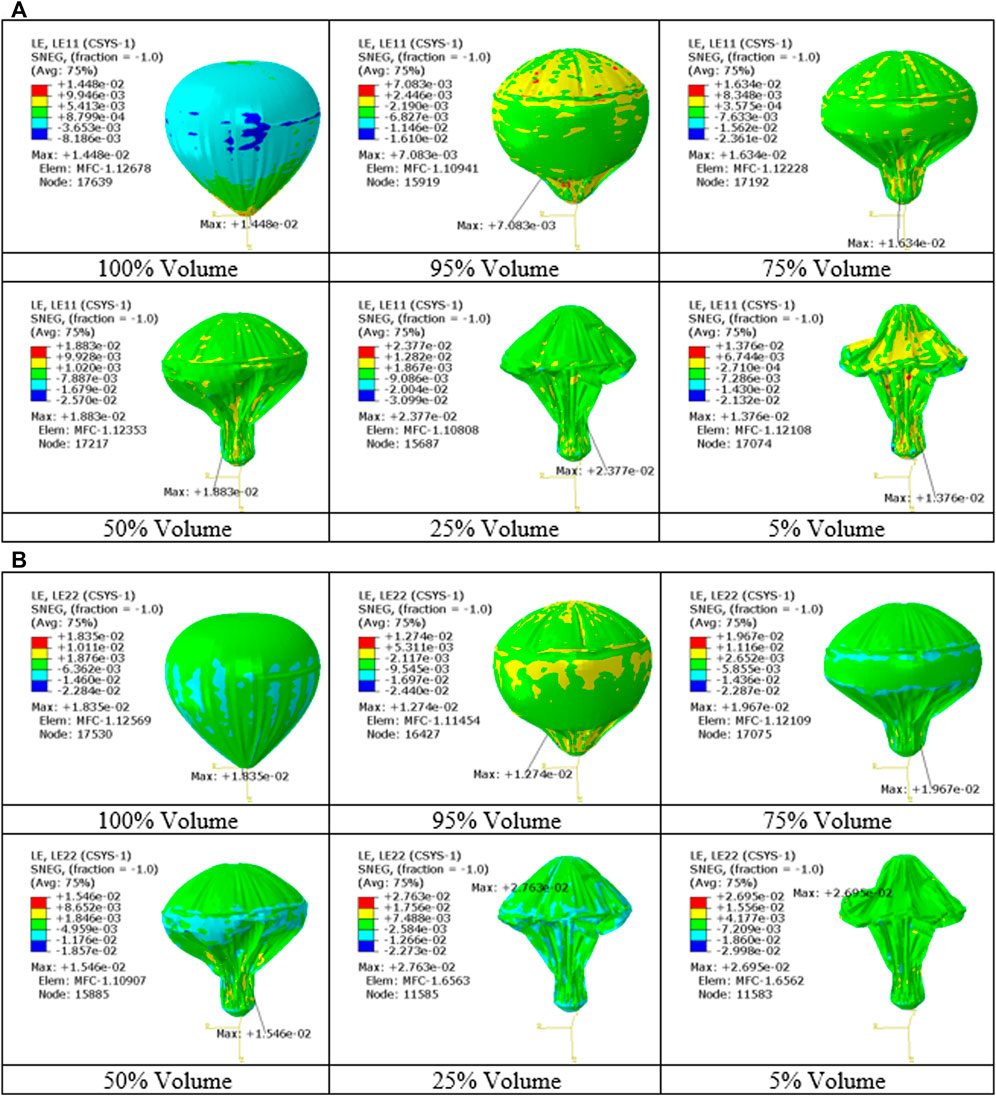
FIGURE 11. Membrane strain at different volumes: (A) longitudinal direction; (B) latitudinal direction.
For the latitudinal membrane strain, shown in Figure 10B, an opposite trend can be found for the strain near the bottom area; it decreases initially and increases again when the volume increases from the empty to the full condition. The strain, when empty, is due to the local collapse deformation; then, the lower tank gradually expands when the volume increases, and the latitudinal strain decreases accordingly. A similar trend applies to the latitudinal strain at the middle and top areas. Unlike the trend of the longitudinal strain, the latitudinal strain near the top part is in a compressed state due to the constraints of the mooring net.
FEA results for the longitudinal strain are shown in Figure 11A and Table 3. The longitudinal strain is 0.71% at 95% volume, and it gradually increases to 2.38% when the volume decreases to 25%. Then, it increases to 1.38% when the volume further decreases to 5%. The longitudinal strain is less when the volume is empty or full compared with 25% volume, which is inconsistent with the trend observed during the test.

TABLE 3. Membrane strain during deformation.
The maximum latitudinal strain located at the bottom area due to the local collapse is shown in Figure 11B. It is slightly larger than the longitudinal strain. However, it is less important because the composite membrane has no fatigue issues, and the membrane has been verified by fatigue tests, including folding-compression and tensile as one cycle load.
The maximum FEA results for the latitudinal strain and longitudinal strain are 2.76% and 2.38%, respectively, and the maximum test results for the latitudinal strain and longitudinal strain are 1.35% and 1.02%, respectively. The FEA results are conservative compared with the test results because the tank deformation is irregular, and the maximum strain is difficult to record during testing.
4 Conclusion
The deformed shape of the tank was studied by the FEA method on a prototype of a 1.7 m model covered by net and mooring lines. The FEA deformed shape is in good agreement with the tank shape observed by the underwater camera for a small-scale prototype. The tank collapses from the bottom part, and then propagates upward until a mushroom head shape is formed when the height is fixed by a rod between the top and bottom flanges. Without the rod, the bottom membrane moves upward until the top membrane is touched. The longitudinal strains have a trend of initially increasing and then decreasing during the process of the volume changing from empty to full due to the pressure and local curve, and the transition point is related to the position. For the top area, the transition point is approximately 60% volume, whereas for the bottom area, the transition point is approximately 30%. Recording the maximum strain during testing is extremely difficult due to the irregular deformation of the tank. The FEA method provides insights into the deformation behavior of the flexible tank, and the validated FEA model can be used for future design optimization. The pressure difference across the membrane is extremely useful to understand the mechanism of deformation. Thus, pressure sensors inside/outside the tank should be equipped for testing in the future.
Data availability statement
The original contributions presented in the study are included in the article/Supplementary Material; further inquiries can be directed to the corresponding author.
Author contributions
YL and YC contributed equally to this work. They designed and supervised the project, wrote the article, and performed editing. ZS, QL, and GL assisted in the analysis and editing. All authors contributed to the manuscript revision, and read and approved the submitted version.
Funding
This work is supported by the “Anhui Province Outstanding Young Talents Support Plan Project” (gxyq2022099). This work is also supported by the Key Research and Development Program of Anhui Province (No. 202104b11020010) and the Science Foundation of the National Key Laboratory of Science and Technology on Advanced Composites in Special Environments (No. 6142905213114).
Conflict of interest
YC, ZS, and QL were employed by the company Lianyungang Jingwei Advanced Composite Material Co. Ltd., China.
The remaining authors declare that the research was conducted in the absence of any commercial or financial relationships that could be construed as a potential conflict of interest.
Publisher’s note
All claims expressed in this article are solely those of the authors and do not necessarily represent those of their affiliated organizations, or those of the publisher, the editors, and the reviewers. Any product that may be evaluated in this article, or claim that may be made by its manufacturer, is not guaranteed or endorsed by the publisher.
References
ABAQUS(2019). Providence. RI, USA: Dassault Systèmes, Simulia. Available at: https://www.3ds.com.
Baginski, F., Barg, M., and Collier, W. (2008). Existence theorems for tendon-reinforced thin wrinkled membranes subjected to a hydrostatic pressure load. Math. Mech. Solids 13 (6), 532–570. doi:10.1177/1081286507077256
Baginski, F., Brakke, K., and Schur, W. (2006). Cleft Formation in pumpkin balloons. Adv. Space Res. 37, 2070–2081. doi:10.1016/j.asr.2005.04.104
Baginski, F., and Brakke, K. (2010). Simulating clefts in pumpkin balloons. Adv. Space Res. 45, 473–481. doi:10.1016/j.asr.2009.10.022
Barg, M. C., Lee, J., and Baginski, F. (2011). Modeling the equilibrium configuration of a piecewise-orthotropic pneumatic envelope with applications to pumpkin-shaped balloons. SIAM J. Appl. Math. 71 (1), 20–40. doi:10.1137/100795875
Cathey, H. M. (2008). Development overview of the revised NASA ultra long duration balloon. Adv. Space Res. 42 (10), 1624–1632. doi:10.1016/j.asr.2007.03.026
Chang, C. T., and Huang, P. T. (2022). A water balloon as an innovative energy storage medium. Polymers 14, 3396. doi:10.3390/polym14163396
Cheung, B., Carriveau, R., and Ting, D. S. K. (2012). Storing energy underwater. Mech. Eng. 134 (12), 38–41. doi:10.1115/1.2012-dec-3
Cheung, B. C. (2014). Design of system Architecture and thermal management components for an underwater energy storage facility. Master’s Thesis (Windsor: University of Windsor).
Deng, X., and Pellegrino, S. “A technique to predict clefting of lobed super-pressure balloons,” in Proceedings of the 11th AIAA Aviation Technology, Integration, and Operations (ATIO) Conference, Virginia, USA, September 20–22, 2011. doi:10.2514/6.2011-6830
Dosselaer, I. V. (2014). Buoyant Aerobot design and simulation study. Master’s Thesis (Delft: Delft University of Technology).
Farley, R. E. “Balloon ascent: 3-D simulation tool for the ascent and float of high-altitude balloons,” in AIAA 5th ATIO and 16th Lighter-Than-Air System Technology and Balloon Systems Conferences, Virginia, USA, September 26–28, 2005. doi:10.2514/6.2005-7412
Festøy, S. V. D., and Lundal, V. (2017). A study of a subsea chemicals storage & injection-station. Master’s Thesis (Trondheim: Norwegian University of Science and Technology).
Jong, M. (2014). Commercial grid scaling of energy bags for underwater compressed air energy storage. Int. J. Environ. Stud. 71 (6), 804–811. doi:10.1080/00207233.2014.947726
Kristiansen, D., Su, B., and Volent, Z. (2018). Numerical and experimental study on the drainage and collapse of a floating flexible bag structure. J. Fluids Struct. 83, 429–447. doi:10.1016/j.jfluidstructs.2018.09.013
Kurniawan, A., Brown, S., Forehand, D., Wolgamot, H., and Waterway, J. (2021). Wave-structure interactions of flexible bags with elastic tendons: Application to wave energy conversion. J. Waterw. Port. Coast. Ocean. Eng. 147 (1), 04020045. doi:10.1061/(ASCE)WW.1943-5460.0000607
Lader, P., Fredriksson, D. W., Volent, Z., DeCew, J., Rosten, T., and Strand, I. M. “Wave response of closed flexible bags,” in the ASME 2016 35th International Conference on Ocean, Offshore and Arctic Engineering, Busan, South Korea, June, 2017. doi:10.1115/OMAE2016-54146
Letcher, T. M. (2022). Storing energy: With special reference to renewable energy sources. Amsterdam, Netherlands: Elsevier.
Liao, J., Yang, Z., Li, J., and Luo, S. (2021). Shape and envelope tension prediction of natural shaped high altitude balloons. Aerosp. Sci. Technol. 117 (97), 106963. doi:10.1016/j.ast.2021.106963
Mas, J., and Rezola, J. M. (2016). Tubular design for underwater compressed air energy storage. J. Energy Storage 8, 27–34. doi:10.1016/j.est.2016.08.006
Mukhlas, M., Lader, P. F., Kristiansen, D., Kristiansen, T., and Kanazawa, M. (2021). Bag and floater motions of a fabric membrane cage. J. Fluids Struct. 106, 103353. doi:10.1016/j.jfluidstructs.2021.103353
Pimm, A., and Garvey, S. (2009). Analysis of flexible fabric structures for large-scale subsea compressed air energy storage. J. Phys. Conf. Ser. 181, 012049. doi:10.1088/1742-6596/181/1/012049
Pimm, A., Garvey, S., and Jong, M. (2014). Design and testing of energy bags for underwater compressed air energy storage. Energy 66, 496–508. doi:10.1016/j.energy.2013.12.010
Pimm, A. J. (2011). Analysis of flexible fabric structures. Dissertation (Nottingham, UK: The University of Nottingham).
Saito, Y., Nakashino, K., Akita, D., and Matsuo, T. (2021). Recent developments on the super-pressure balloon with a diamond shaped net–ground inflation tests of two 2, 000 m3 balloons. Trans. JSASS Aerosp. Tech. Jpn. 19 (2), 170–175. doi:10.2322/tastj.19.170
Vasel-Be-Hagh, A. R., Carriveau, R., and Ting, D. S. K. (2015). Flow over submerged energy storage balloons in closely and widely spaced floral configurations. Ocean. Eng. 95, 59–77. doi:10.1016/j.oceaneng.2014.11.030
Vasel-Be-Hagh, A. R., Carriveau, R., and Ting, D. S. K. (2013). Numerical simulation of flow past an underwater energy storage balloon. Comput. Fluids 88, 272–286. doi:10.1016/j.compfluid.2013.09.017
Wakefield, D., and Bown, A. “Non-linear analysis of the NASA super pressure balloons: Refined modelling,” in AIAA Balloon Systems (BAL) Conference, Florida, USA, March 25–28, 2013. doi:10.2514/6.2013-1359
Wakefield, D. “Non-linear viscoelastic analysis and the design of super-pressure balloons: Stress, strain and stability,” in AIAA Balloon Systems Conferences, Washington, USA, May 4–7, 2009. doi:10.2514/6.2009-2813
Wakefield, D. “Numerical investigations of pumpkin balloon deployment stability,” in AIAA Balloon Systems Conference, Virginia, USA, May 21–24, 2007. doi:10.2514/6.2007-2604
Wang, J., Ma, L., Lu, K., Miao, S., Wang, D., and Wang, J. (2017). Current research and development trend of compressed air energy storage. Syst. Sci. Control Eng. 5 (1), 434–448. doi:10.1080/21642583.2017.1377645
Wang, Z., Ting, D. S. K., Carriveau, R., Xiong, W., and Wang, Z. (2016). Design and thermodynamic analysis of a multi-level underwater compressed air energy storage system. J. Energy Storage 5, 203–211. doi:10.1016/j.est.2016.01.002
Wang, Z., Ting, D. S. K., Carriveau, R., Xiong, W., and Wang, Z. (2019). Numerical and experimental investigation of flow around a balloon-shaped bluff body. Sustain. Energy Technol. Assessments 35, 80–88. doi:10.1016/j.seta.2019.06.005
Keywords: flexible composite tank, numerical modeling, experimental test, storage, TPU-coated aramid fabric
Citation: Liu Y, Chen Y, Shan Z, Li Q and Lin G (2022) Experimental assessment and numerical simulation of the large deformation of a flexible composite tank. Front. Mater. 9:1071509. doi: 10.3389/fmats.2022.1071509
Received: 16 October 2022; Accepted: 14 November 2022;
Published: 05 December 2022.
Edited by:
Wenliang Li, Jilin Medical University, ChinaReviewed by:
Qiang Zhang, Changchun Institute of Applied Chemistry (CAS), ChinaYang Yang, Institute of Deep-Sea Science and Engineering (CAS), China
Copyright © 2022 Liu, Chen, Shan, Li and Lin. This is an open-access article distributed under the terms of the Creative Commons Attribution License (CC BY). The use, distribution or reproduction in other forums is permitted, provided the original author(s) and the copyright owner(s) are credited and that the original publication in this journal is cited, in accordance with accepted academic practice. No use, distribution or reproduction is permitted which does not comply with these terms.
*Correspondence: Yuxi Liu, bGl1eXV4aWVtYWlsQDEyNi5jb20=
†These authors have contributed equally to this work and share first authorship