 Shaorui Wang
 Yingbin Li
- School of Civil Engineering, Chongqing Jiaotong University, Chongqing, China
In view of the limitations of the current code based on the equivalent beam-column method with the “rod mode” instead of the “arch mode” for the calculation of concrete-filled steel tube arch bridges, this paper takes the real bearing mechanism of the arch as the starting point and analyzes the different bearing mechanisms of the arch and eccentric pressurized column. The concrete-filled steel tube arch model test was carried out to analyze the deformation state and damage mode, and the geometric non-linear bending moment of the measured arch was compared with the bending moment value calculated by the eccentricity increase coefficient of the “rod mode.” The results showed that the transfer of internal force is from the axial force to the arch axis, causing the vertical reaction force and horizontal thrust. However, the eccentric compression column only produced the vertical force at the bottom and combines with the lateral deformation indirectly generated by the eccentric distance. In addition, the deformation stage of the arch is basically the same as that of the eccentric compression column. The final failure mode of the arch is 4-hinge damage, and the final failure mode of the eccentric compression column is single-hinge damage. The preliminary geometric non-linear bending moment value obtained by the two modes accords well. Therefore, the main factors for the difference in the bearing mechanism between the two modes are different force structures, force transmission routes, and sources of deformation. Due to the difference in the bearing mechanism, the final failure mode is different, and the deformation ability of the arch is weakened by using the “rod mode” instead of the “arch mode.” The geometric non-linear bending moment of the control section calculated by the eccentricity increase coefficient is conservative, but the influence of the geometric non-linearity of other sections is not considered enough.
1 Introduction
The concrete-filled steel tube (CFST) arch bridge having good span performance, superior bearing capacity, and graceful shape has been widely used. The CFST arch is restrained by the steel tube which significantly improves the compression resistance and spanning ability of the arch ribs, and the current braceless construction method of the arch bridge has matured, so the strong spanning ability, convenient construction method, and the ultra-high requirements for the foundation make the CFST arch bridge especially suitable for mountain and river canyons with treacherous terrain. However, large-span arch bridges are often affected by geometric non-linearity, and the damage rules are similar to those of eccentrically stressed columns (beam columns) due to the presence of both bending moments and axial forces in the arch cross-section. Therefore, the current specification (Ministry of Transport of the People’s Republic of China, 2015) usually equates the arch to a straight beam and column under eccentric compression for relevant calculation and takes the second-order effect of the arch into account by introducing the coefficient of the eccentricity increase coefficient to simplify the calculation. Although the eccentric compression column can basically reflect the failure law of the arch, the transverse deformation of the eccentric straight beam and column is produced by bending moment or transverse force. In contrast, the deformation of the arch is directly produced by the vertical load on the arch. The two deformation sources are different. In addition, the arch axis will generate additional internal forces including additional bending moments after compression. Also, the real internal forces of the arch are difficult to calculate, which is also different from the eccentrically compressed straight rod beam column (Chen, 2016). Therefore, several scholars have conducted the following relevant studies for the CFST arch structure with a special combination of forces:
Liu and Sun (2021) carried out six uniform load tests on CFST arches and studied the ultimate bearing capacity and deformation and failure characteristics of CFST round arch specimens. The results showed that the circular arch yields first at the inside of the arch foot, and the curvature at different positions of the specimen is no longer consistent. The steel tube at the arch foot will uplift obviously and the hoop action of the steel pipe on the concrete will fail when the CFST arches reach the ultimate bearing capacity. Li and Lei (2022) studied the influencing factors of the bearing capacity of CFST arches by numerical simulation and found that the arch had a great limitation on displacement in the elastic stage, and the ultimate bearing capacity was relatively high. The bearing capacity decreases obviously after reaching the peak value, but it showed good elongation performance. Zhao et al. (2021) used the fiber model technology to define the element bearing ratio by homogeneous generalized yield function and proposed the elastic modulus reduction method to evaluate the stable bearing capacity of the dumbbell-type CFST arch by strategically reducing the elastic modulus of the high-stress element. The results showed that stability had a significant impact on the CFST arch. The elastic modulus adjustment method has higher accuracy and efficiency than the incremental non-linear finite element method. Zhang et al. (2022) designed some concrete-filled steel tubular CFST columns and studied the influence of constraint effect coefficient and eccentricity on their mechanical properties. The results showed that the ultimate bearing capacity increases approximately linearly, and the ultimate deflection slightly decreases with the increase in the CFRP constraint effect coefficient. The ultimate bearing capacity of the specimen with large eccentricity decreases obviously, and the deflection corresponding to the ultimate bearing capacity is lower. Huo and Han (2014) compiled a program to analyze the non-linear behavior rules of five special-shaped arch bridges with their characteristics and revealed that the beam-column effect was the most critical factor affecting the essence of the arch and beam composite butterfly arch bridge. The non-linear method was used to calculate the tensile force of the cable by considering the vertical effect of the cable. Zou et al. (2023a) and Zou et al. (2023b) investigated composite and lattice web-concrete combination structures with hollow steel pipes and UHPC combinations and carried out load bearing tests on both combinations, and the results showed good load bearing performance, which can be used in pre-buried sections of CFST arch bridges to improve the load bearing capacity. Bradford and Pi (2014) investigated the effects of geometric non-linearity on the long-term in-plane performance of crown-pin CFST arches under the sustained central concentrated loading, and the analytical solutions for their non-linear response and buckling loads were derived, and the results showed that the long-term deformation predicted by the non-linear analysis resulted in a significant reduction in the serviceability limit state reserve of crown-pin CFST arches. Guo et al. (2022) deduced the calculation formula of the eccentricity increase coefficient based on the basic principle of the variational method and the interaction characteristics of the tie arch structure after deformation. The calculation results were compared with the finite element and the standard, and the results showed that the standard calculation results were large. The finite element calculation results were small, and the method calculation results adopted were moderate. Wang (2009) used the theory of the Updated Lagrangian (U.L.) finite element formulation, and the incremental equation of the virtual work of a three-dimensional (3D) beam for a geometric non-linear analysis of the space structure is established. The eccentric bearing capacity of CFST members is studied, and the results show that the larger the eccentric distance is, the lower the ultimate bearing capacity is, but with better ductility. Liu et al. (2011) and Wang and Guo (2020) studied the load carrying capacity and stability of a CFST arch bridge with fly-bird-type, calculated linear and non-linear stability coefficients, and analyzed the damage modes and load–displacement curves, and the results showed that the linear elastic buckling method does not reflect the true damage mode of this structure, and the effects of both geometric and material non-linearity cannot be ignored. Yang et al. (2020) proposed an adaptive strategy of the elastic modulus adjustment for the ultimate bearing capacity of the CFST arch, and the effectiveness of the method was proven by a large number of tests. Ye (2013) and Wu et al. (2015) studied the effects of length-to-slenderness ratio and sagittal-to-span ratio on the bearing capacity and suggested the essential difference between the arch and column. Wei et al. (2010), Wei et al. (2009), and Chen et al. (2004) used the equivalent beam-column method to calculate the ultimate bearing capacity of the CFST parabolic arch, and the comparison results with finite elements showed that this method is more accurate. Yuan et al. (2020), Jiang et al. (2018), and Zhang and Yu (2013) studied the out-of-plane stability of CFST arches, explored the effect of non-linearity on the stability coefficients, and proposed a method for calculating the correlation coefficients for stability calculations. Bradford and Pi (2014) investigated the effects of geometric non-linearity on the long-term in-plane behavior of crown-pinned circular CFST arches under a continuous central concentrated load and showed that geometric non-linearity has a significant effect on the long-term behavior of crown-pinned CFST arches.
The research on the ultimate bearing capacity and the eccentricity increase coefficient of the CFST arch is abundant, but the research foundation is still built based on the ideas of the “rod mode.” The research on the calculation pattern of the CFST arch based on the “arch effect” is deficient. In view of this, this paper discussed the differences between the bearing mechanism of the “arch mode” and the “rod mode” and proposed a new calculation model for the real geometric non-linear internal forces of the arch after force deformation. In this paper, we carried out model tests on the single-pipe arch of steel pipe concrete; analyzed the load–displacement curves, strains, and damage modes of the whole process damage of two single-point loading conditions; and verified the difference between the “arch mode” and “rod mode” damage modes. The comparison of model test and regulation was based on the equivalent beam-column method for non-linear bending moments in arch geometry, and the analysis of the differences between the two calculation results and the advantages of the calculation mode was carried out based on the arch effect. The regulation of using the “rod mode” instead of the “arch mode” in the calculation of CFST arch bridges is discussed. Based on the differences of the two modes in the bearing mechanism, this paper proposes the real internal force calculation mode of each section after the deformation of the arch. The mode provided new ideas for the future calculation mode of the bearing capacity and stability of large-span arch bridges. Also, it can help optimize the arch axis, arch rib section form, and structure.
2 The bearing mechanism of the “arch mode”
If the branch buckling mode of the unhinged arch is anti-symmetric, as shown in Figure 1A, the horizontal thrust will be generated at the support, and the axial pressure will be generated in the section under the vertical load of the arch. Therefore, the actual internal force of any section can be calculated as Formula 1, after the arch deformation reaches a new equilibrium state.
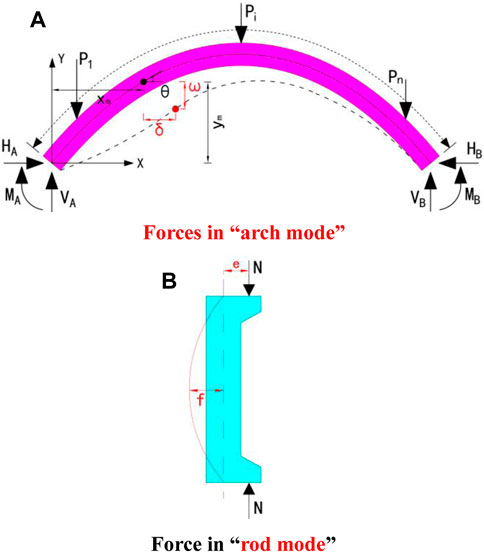
FIGURE 1. Stress characteristics of the “arch mode” and “rod mode”: (A) Forces in “arch mode”; (B) Force in “rod mode“.
According to the theory of deflection, the calculation of the axial force in the arch section can be expressed approximately as
Type:
It is not difficult to see that the presence of the horizontal thrust reduces the bending moment in the arch, and the arch axis will produce additional internal forces including the additional bending moment after compression under the action of pressure, which is
However, based on the principle of the equivalent beam-column method, the current domestic standard equates the arch ring to a simply supported eccentric compression column with a length of .36 S (S is the arc length of the arch axis), as shown in Figure 1B (Lin and Chen, 2016). The internal force of the section is as follows:
Type:
It can be found from the analysis of the real internal force of the eccentric compression column that the eccentric force transfer to the fixed end along the axis directly forms the vertical reaction force. The axial force is equal to the eccentric force. The cross-section bending moment is produced by the eccentricity, and thus it indirectly leads to lateral deformation. So, the bearing capacity of eccentric compression column destruction mainly comes from the vertical force produced by the linear bending moment and transverse deformation and eccentricity of the additional bending moment.
In view of the differences in the bearing mechanisms of the “arch mode” and “rod mode,” the load-bearing capacity model test of the CFST single-pipe arch was carried out from the real force mode of the arch. By analyzing the load–displacement state, the damage mode and the real internal force in the arch in the geometrically non-linear stage, the difference between the “arch mode” and “rod mode” is verified, and a new calculation model of the CFST arch bridge based on the arch effect is proposed.
3 Single-tube model test of the “arch mode”
3.1 Model design and production
A catenary steel tube single-tube arch bridge with a calculated span of 95 m was used as the prototype. The ratio of the sagittal span was 1/3.5, the calculated sagittal height was 27.143 m, the arch axis coefficient was 1.5, the diameter of the steel tube was 1.55 m, the wall thickness of the arch foot was 26 mm, and the rest was 22 mm, and C60 concrete was poured into the tube.
The test arch was scaled down at 1:16, with a reduced span of 5.938 m and a calculated height of 1.696 m. Due to the limitation of market steel pipe specifications, the pipe wall was too thin according to the actual scale ratio, so the full-span diameter and wall thickness of the steel pipe were set at 89 mm and 4 mm, respectively, according to the existing market specifications, as shown in Figure 2. Scale parameters and scale deviation values are shown in Tables 1, 2.
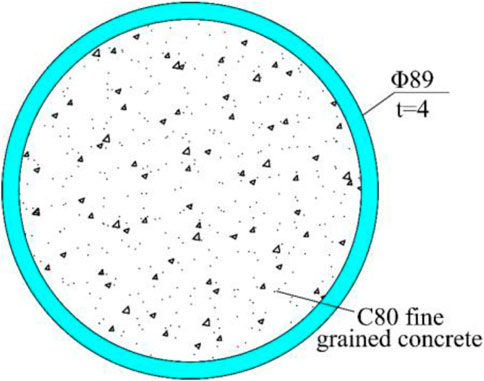
FIGURE 2. Cross-section of the arch rib.

TABLE 1. Parameters of the scaled section.
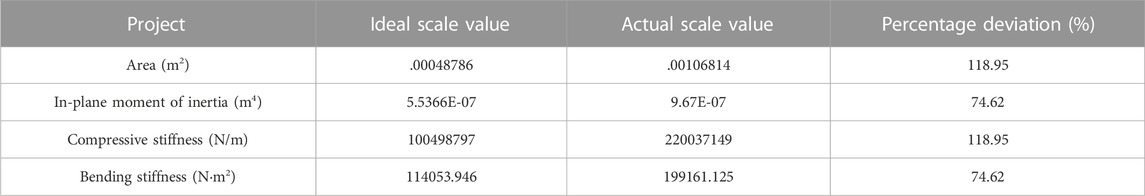
TABLE 2. Scale size deviation.
The steel pipe material was Q345, and the arch was perfused with C80 fine-grain concrete. After curing for 28 days, the compressive strength of six concrete blocks was tested. The compressive strength of the cube was 51.85 MPa, the compressive strength of the prismatic core was 32.4 MPa, and the elastic modulus was 3.4834 × 10⁴ MPa. Steel tube yield strength was 361 MPa, tensile strength was 540 MPa, and the elastic modulus was 2.1 × 10⁵ MPa.
The vault and L/4 loading conditions were designed to test the in-plane deformation state, strain distribution, and failure mode of the whole process of the arch. The overall design is shown in Figure 3.
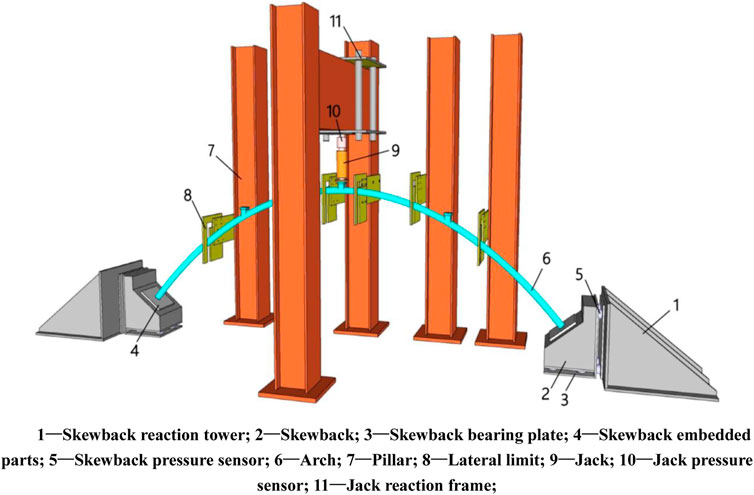
FIGURE 3. Overall diagram of the model.
3.2 Designs of the test device and measuring point
A 50-t hydraulic jack was adopted. The top of the jack was a pressure sensor, and the bottom design disk was in contact with the arch rib loading block to ensure uniform force. The skewback reaction device was a triangular steel structure. The test was mainly conducted to study the load bearing capacity of the arch under vertical load in-plane deformation. In order to avoid out-of-plane deformation causing out-of-plane instability damage to the structure, the whole arch set five transverse limits to ensure that the arch was only in-plane free deformation during the loading process. The contact surface between the limit and the arch was coated with a tetrafluoro plate to reduce friction. The main device configuration is shown in Figure 3 and Figure 4A. Percentage gauges and strain gauges were used to test the displacement and strain in the whole process. Two percentage gauges were set at each L/8 to measure the horizontal and vertical displacement, and four percentage gauges were set at each skewback to monitor whether deflection occurred, as shown in Figure 4B. Strain gauges are set at the L/8 and the section of the two arch feet. The upper and lower edges of the section are arranged in annular and longitudinal directions, respectively, while only longitudinal directions are arranged on the side. Fifty-four strain gauges are arranged in the whole arch, as shown in Figure 5.
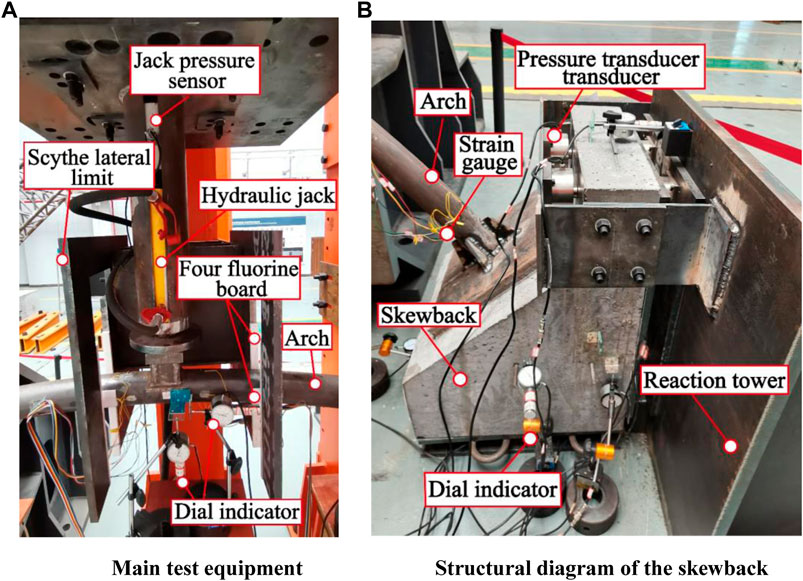
FIGURE 4. Real diagram of local construction: (A) Main test equipment; (B) Structural diagram of the skewback.
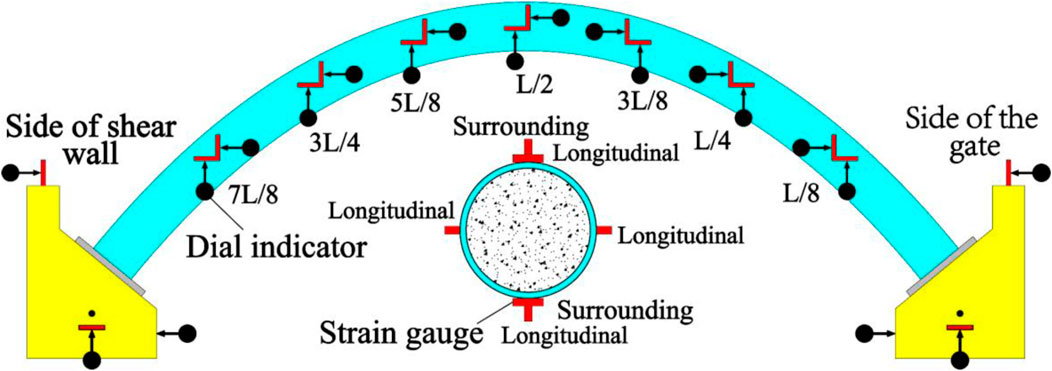
FIGURE 5. Placement of displacement and strain measurement points.
3.3 Measurement method for internal force
According to Eq. 1, the real internal forces of any section can be calculated if the internal forces of the arch foot, section displacement, and external load are known, based on the calculation principle of the real internal forces in the arch. The section displacement and external load can be directly measured by the test, while the actual measurement of the internal forces of the arch foot is difficult to measure. In this paper, the separation skewback method in Li (2012) was used to measure the internal force of the arch foot. Four sensors were installed on the back and bottom of the skewback to measure the horizontal thrust and vertical reaction force, as shown in Figure 8. Due to the effect of the arch foot bending moment, the skewback will have a trend of in-plane rotation. It was found in finite element analysis that the arch foot at both ends of the vault loading has a negative bending moment, and the skewback rotates clockwise. In four-point loading, there is a negative bending moment at the arch foot close to the loading point, and the skewback rotates clockwise, while there is a positive bending moment at the arch foot far away from the loading point, and the skewback rotates counterclockwise. To accurately measure the horizontal thrust of the arch foot and limit the rotation of the skewback, two sensors are set at the front of the top of the vault loading base (Figure 4B). Two sensors are set at the front of the top and the front of the bottom of the skewback near and far from the loading point of the four-point loading (Figure 6; Figure 4B). Then, the bending moment, horizontal reaction force, and vertical reaction force of the arch foot are calculated according to the static equivalence principle. The calculation principle is shown in Figure 7.
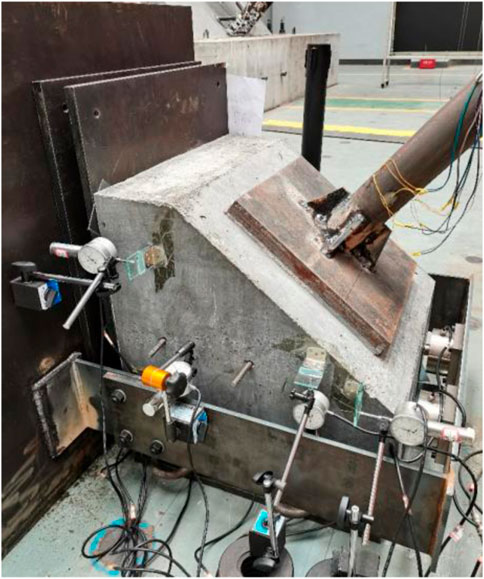
FIGURE 6. Four-point loading skewback.
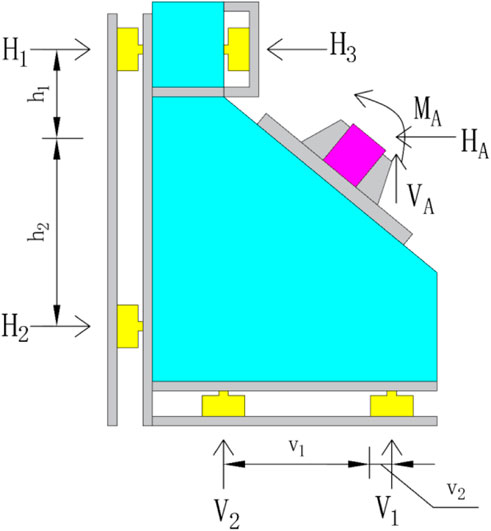
FIGURE 7. Schematic diagram of calculation of the internal force of the arch foot.
Through force analysis, the actual calculation formula of the arch foot bending moment, horizontal reaction force, and vertical reaction force can be obtained as follows:
Type:
3.4 Test steps
First, the reaction tower and skewback should be precisely positioned. It was necessary to pre-push it to eliminate the anchor hole clearance after the reaction tower was installed. Then, the arch ribs were erected and the hanging hammer was used to ensure that the arch was in a vertical state without initial transverse deviation. Finally, the loading device and test device are installed. The initial state after the preparation is shown in Figure 8. Formal loading needs to be graded according to the results of finite element ultimate bearing capacity analysis, that is, the ultimate force of 0%–3% or so average .5 kN/level, 3%–5% or so average 1 kN/level, 5%–10% or so average 2 kN/level, and 10% after the average 5 kN/level until failure, with each static loading level of 2 min after the stability of the reading. Full-arch graded loading values are shown in Table 3. The test designed two loading conditions. The arch top loading arch rib was named A-1 and 4-point loading condition arch rib was named A-2. The description of the conditions is given in Table 4 and the actual loading figure is shown in Figure 8.
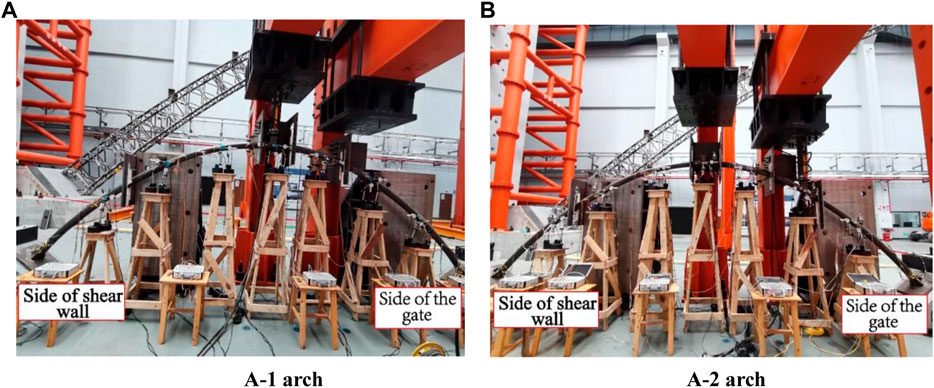
FIGURE 8. Initial state: (A) A-1 arch; (B) A-2 arch.
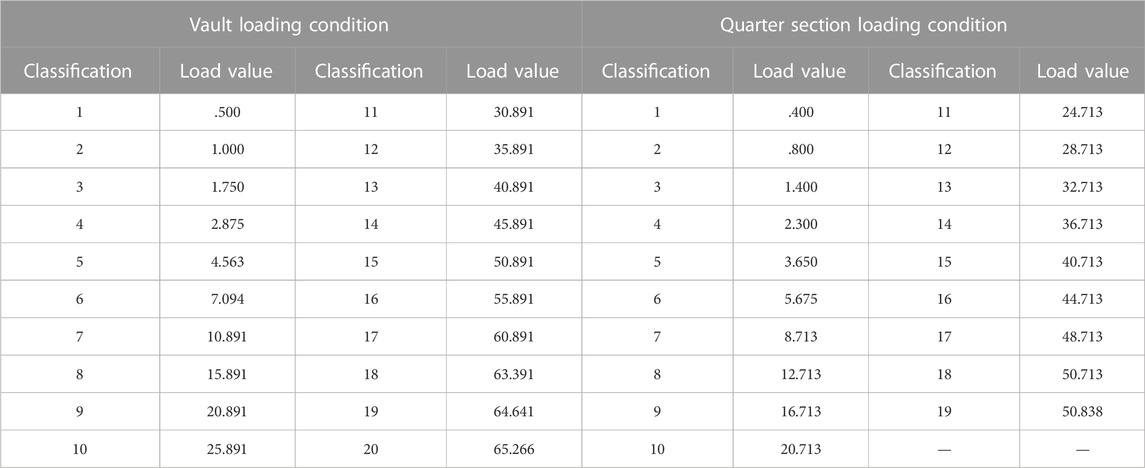
TABLE 3. Hierarchical loading value (Unit: kN).
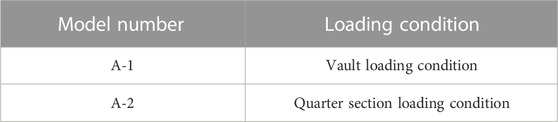
TABLE 4. Description of working conditions.
3.5 Analysis of test results
3.5.1 Load–displacement curve
According to Table 3, the load–displacement curves of each section of the A-1 arch and A-2 arch are shown in Figures 9, 10 (vertical displacement is “+” downward and horizontal displacement direction of shear wall side arch is “+”). The whole deformation process of the arch can be roughly divided into three stages:
(1) Elastic deformation stage. When the A-1 arch was loaded to 4.563 kN (.07 Pu) and the A-2 arch was loaded to 3.65 kN (.073 Pu), the load–displacement curves of each section basically changed linearly, and the arch was in the stage of linear elastic change, almost unaffected by non-linear influence.
(2) Elastic–plastic deformation stage. With the increase in the load, the slope of the curve gradually decreases, and the arch enters the stage of elastic–plastic deformation. The sections, especially the sections at loading points, are gradually affected by geometric non-linearity. At this stage, the upper critical load limit for arch A-1 was about 45.891 kN (.71 Pu), and the upper critical load limit for arch A-2 was about 40.713 kN (.81 Pu).
(3) Plastic deformation stage. With the increase in the load, the deflection of the loading point increases continuously, the slope of the curve increases faster, and the curve gradually tends to be horizontal. Under the double non-linear action, the arch has a slight change in load, a sharp increase in displacement, and a reduction in load value. The load could not be increased continuously when the A-1 and A-2 arches were added to 65.012 kN and 50.275 kN, respectively.
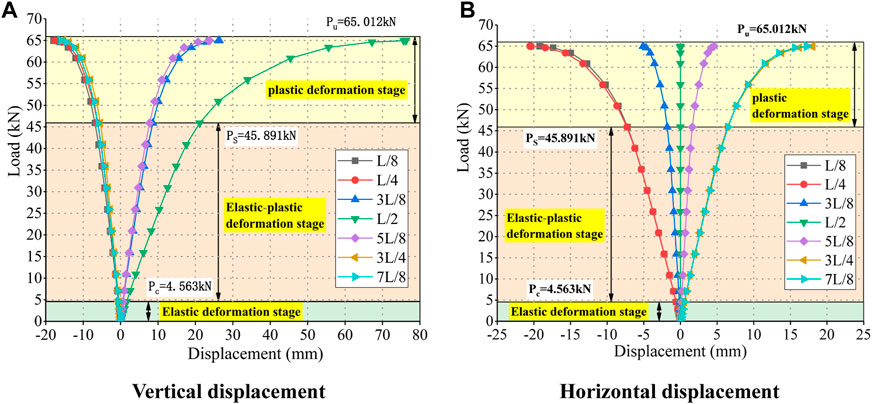
FIGURE 9. A-1 arch of the load–displacement curve: (A) Vertical displacement; (B) Horizontal displacement.
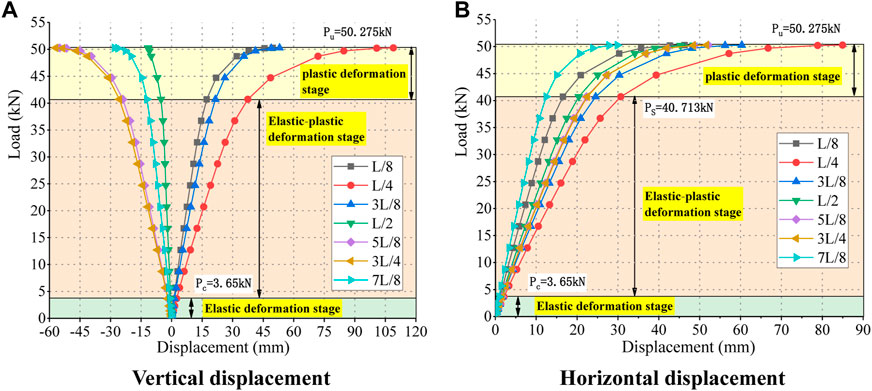
FIGURE 10. A-2 arch of the load–displacement curve: (A) Vertical displacement; (B) Horizontal displacement.
The results of failure load–displacement curves under two working conditions showed that the ultimate bearing capacity of the A-1 arch was Pu = 65.012 kN, the maximum vertical displacement of the loading point was 76.31 mm, and the maximum horizontal displacement of the L/4 section was 20.53 mm. The ultimate bearing capacity of the A-2 arch was Pu = 50.275 kN, and the maximum vertical displacement and horizontal displacement of the loading point are 108.96 mm and 84.96 mm, respectively. The comparison between the test results under the ultimate load and the preliminary FEM calculation is shown in Table 5. The comparison results showed that the difference between the test ultimate bearing capacity value and the preliminary calculation was less than 2%, and the displacement difference was about 10%. It indicated that the ultimate bearing capacity test values of the two working conditions are accurate. The real CFST arch shows superior deformation capacity compared with the theoretical calculation.
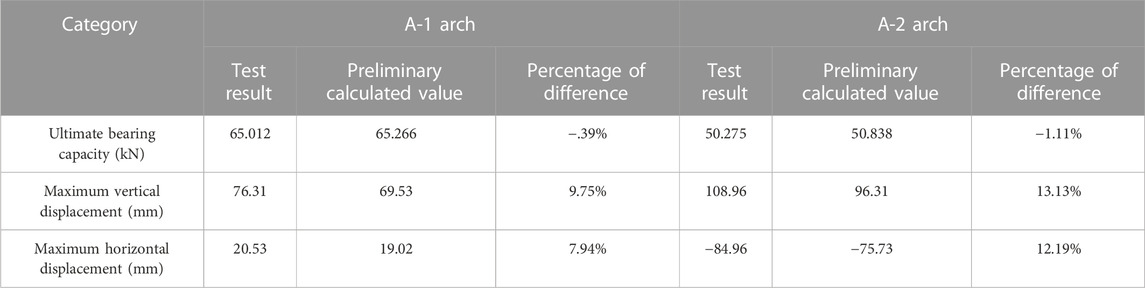
TABLE 5. Comparison between the test value and preliminary calculated value of the ultimate load.
3.5.2 The strain state under ultimate load
All steel tube surfaces in L/8 and two arch feet were decorated with a strain gauge, as shown in Figure 5. As the deformation of the test arch was mainly in-plane deformation, only the edge of the steel tube on the longitudinal strain under the ultimate load was analyzed. It is given in Section 3.1 that the measured yield strength of the steel pipe was 361 MPa, the modulus of elasticity was 2.1 × 10⁵ MPa, and the steel pipe yield strain was
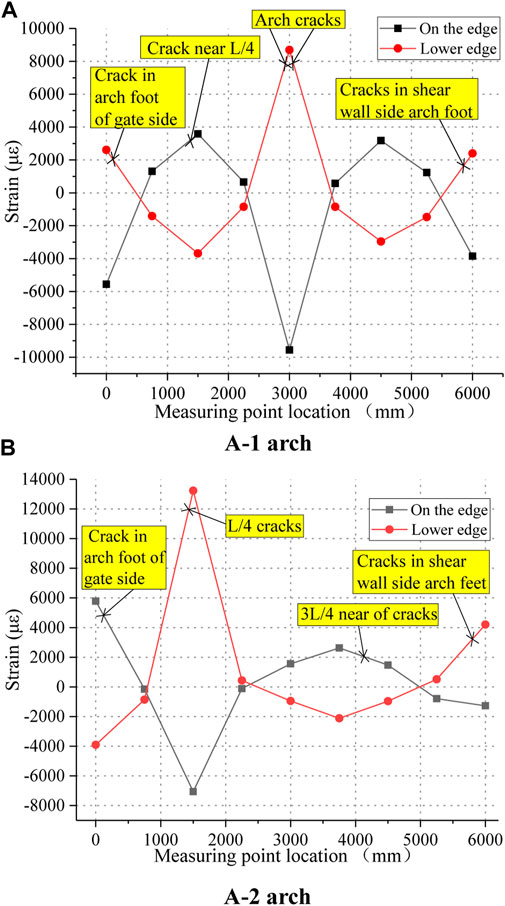
FIGURE 11. Strain and crack distribution of concrete in the tube under ultimate load: (A) A-1 arch; (B) A-2 arch.
3.5.3 Damage state
The initial state of two loading conditions and the overall deformation state under the ultimate load are shown in Figure 12. The concrete in the tube after destruction is shown in Figure 13.

FIGURE 12. State after destruction: (A) A-1 arch; (B) A-2 arch.
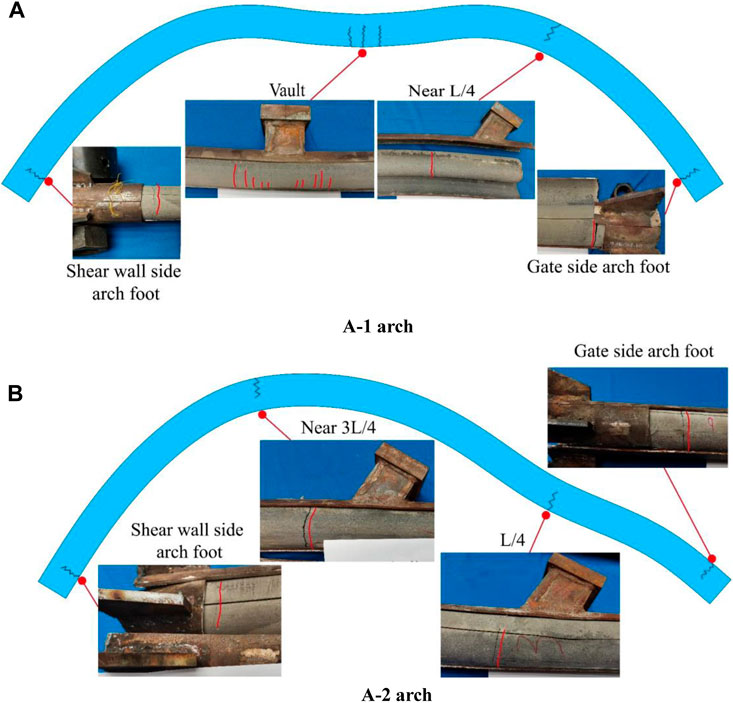
FIGURE 13. Failure state of concrete in the pipe after failure: (A) A-1 arch; (B) A-2 arch.
It can be seen that the vault has obvious vertical sag in the ultimate state of the bearing capacity of the A-1 arch. There are several small vertical micro-cracks perpendicular to the arch axis extending upward to the lower edge of the concrete in a certain area at both ends of the loading point. There was an obvious bulge near the L/4 section, and a macroscopic crack on the upper edge of the concrete extends downward perpendicular to the axis of the arch. There was a slight depression near the cross-section of the two arch feet, and a macroscopic crack on the lower edge of the concrete extends upward perpendicular to the axis of the arch.
In the ultimate state of the bearing capacity of the A-2 arch, the L/4 section was inclined to sag, and there was a macroscopic crack at the lower edge of the concrete perpendicular to the arch axis extending upward. The arch foot section of the gate side was slightly raised, and there was a macroscopic crack on the upper edge of the concrete that was perpendicular to the arch axis extending downward. There was an obvious bulge near the 3L/4 section, and a macroscopic crack on the upper edge of the concrete extends downward perpendicular to the axis of the arch. There was a slight depression near the section of the arch foot on the shear wall side, and a macroscopic crack at the lower edge of the concrete extends upward perpendicular to the arch axis.
Combined with Figure 10 and the aforementioned failure states, it can be seen that the four crack positions of the concrete in the tube after failure under the two working conditions all appear near the extreme point of the tensile strain of the steel tube, which was a tensile failure. At this time, the concrete at the crack stops working, indicating that plastic hinges are formed at the four positions in the arch and that the structure cannot continue to bear. Therefore, the failure mode of the arch was the 4-hinge failure, and the structure forms a geometrically variable system and loses the bearing capacity.
4 Comparative analysis of the “arch mode” and “rod mode”
In Section 3.5.1, the loading interval of the A-1 arch with obvious geometric non-linearity is given as 4.563 kN–45.891 kN, and that of the A-2 arch is 3.65 kN–40.713 kN. The calculation section of the A-1 and A-2 arches and the selection of loads outside the geometric non-linear loading interval are listed in Table 6. The geometric non-linear bending moment values of the two calculation modes are compared under the corresponding external load.
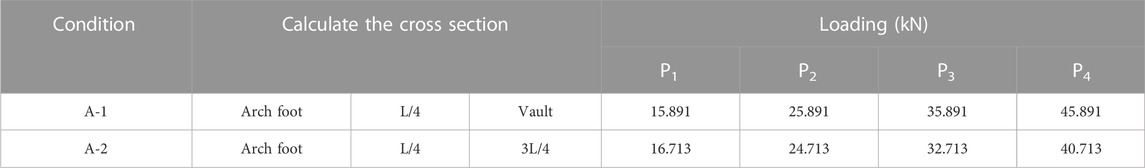
TABLE 6. Selection of calculation parameters.
4.1 Calculated geometric non-linear bending moment values for the regulation
In the current JTG/TD65-06-2015 code (concrete-filled steel tube arch bridge design code) (Ministry of Transport of the People’s Republic of China, 2015), the eccentricity increasing coefficient
Type:
According to the section-related parameters of the test arch provided in Section 3.1, the Eulerian critical force NE = 304.3 kN can be calculated. The first-order linear axial force and bending moment can be calculated by finite elements as recommended in the regulation. So, the first-order linear axial force and bending moment of the test arch were calculated by Midas/civil, as shown in Table 7.
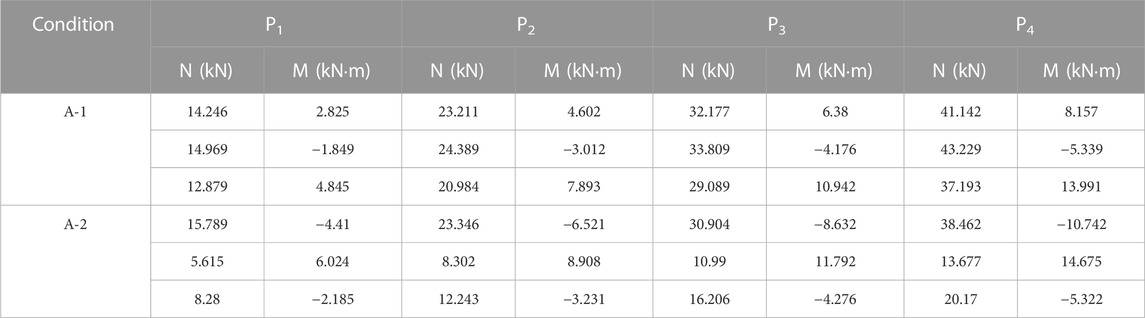
TABLE 7. First-order linear axial forces (N) and bending moments (M) calculated by finite elements.
The Eulerian critical force and the first-order axial force and bending moment values corresponding to the external loads P1∼P4 in Table 7 are substituted into Eqs 6, 7, obtaining the eccentricity increasing coefficient
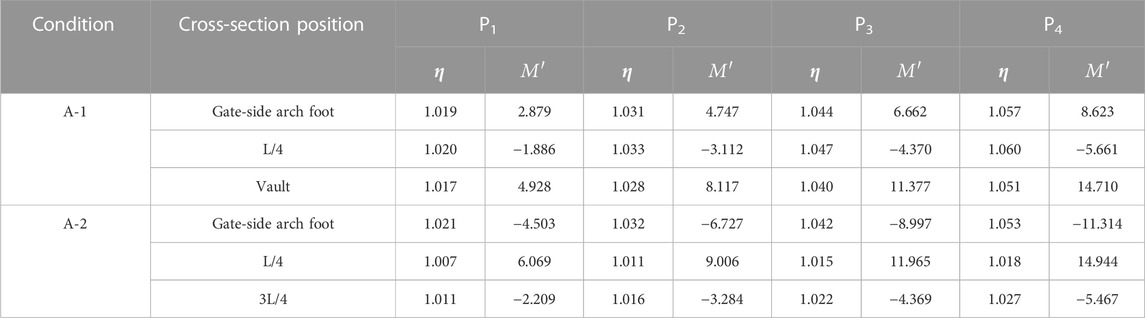
TABLE 8. Geometric non-linear bending moment values calculated by the regulation (unit: kN).
4.2 Measured geometric non-linear bending moment values based on the arch effect calculation model
According to the geometric non-linear internal force calculation model based on the arch effect proposed in this paper according to Eq. (1), the real geometric non-linear bending moment in the arch can be calculated by substituting the measured load–displacement results and the coordinate position of the cross-section. The cross-section positions and the measured external loads P1∼P4 correspond to the horizontal displacement δ and vertical displacement ω (arch foot displacement is 0), as shown in Tables 9, 10.
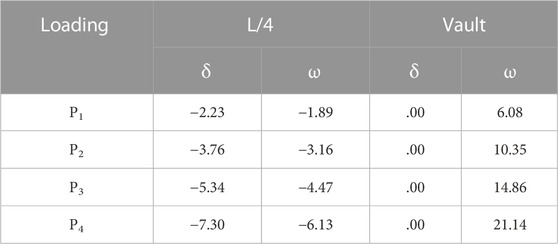
TABLE 9. A-1 arch P1∼P4 measured displacement (unit: mm).
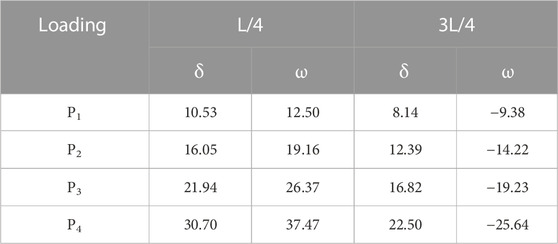
TABLE 10. A-2 arch P1∼P4 measured displacement (unit: mm).
The measured values of horizontal thrust HA, vertical reaction VA, bending moment MA, and other cross-section geometric non-linear bending moment values Mg in the arch foot of the gate side are shown in Table 11.
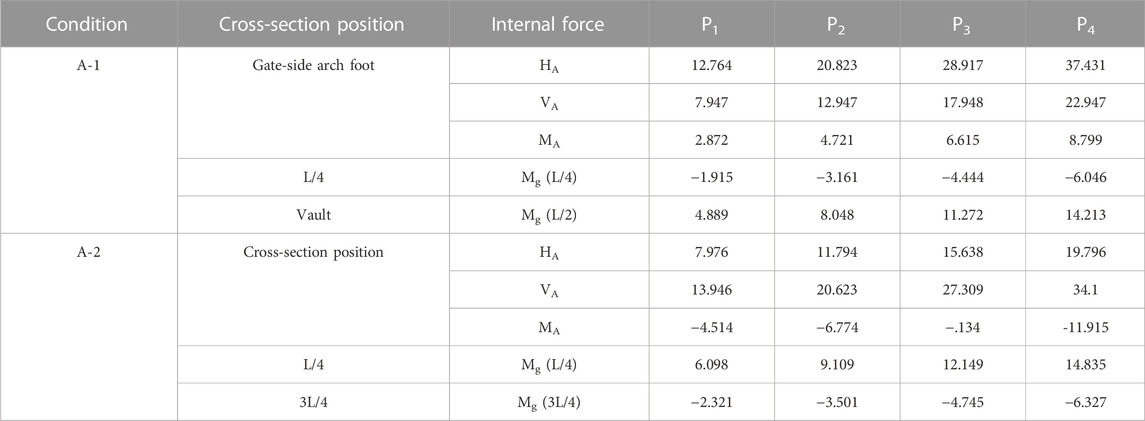
TABLE 11. Measured values of geometric non-linear internal forces (unit: kN m).
4.3 Comparative analysis
The geometric non-linear moment values calculated by the regulation in Table 8 are compared with the real geometric non-linear moment values of the CFST arch measured in Table 11, as shown in Table 12 and Figure 14.

TABLE 12. Comparison of regulation values and measured values (unit: kN m).
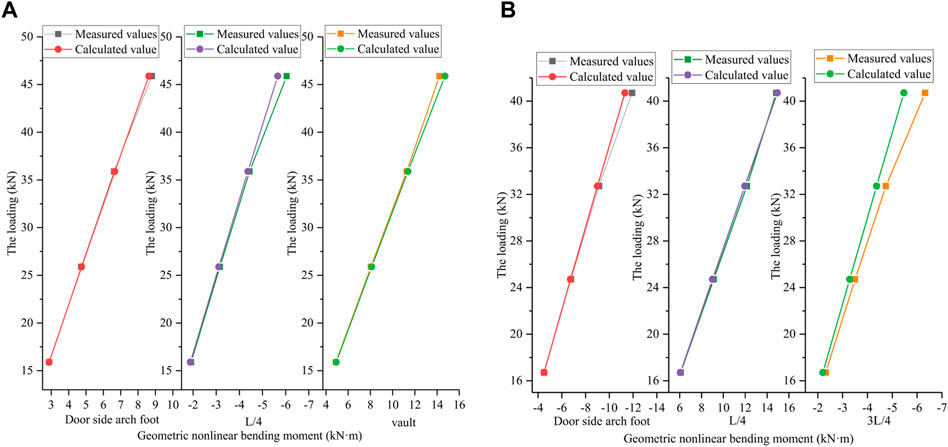
FIGURE 14. Comparison of geometric non-linear bending moment values between the “arch mode” and “rod mode”: (A) A-1 arch;(B) A-2 arch.
The comparison results show that the results of the two modes at the beginning of the geometric non-linearity of the A-1 and A-2 arches are in good agreement. As the load was increased, the geometric non-linearity has the greatest effect under the critical external load P4 at the end of the elasto-plastic phase. At this time, the measured value of the arch foot section of the A-1 arch is 2.04% larger than the regulation calculation value, the measured value of the L/4 section is about 6.81% larger than the regulation calculation value, and the measured value of the arch top section is about 3.38% smaller than the regulation calculation value. The measured value of the arch foot section of the A-2 arch is about 5.31% larger than the regulation calculated value, the measured value of the L/4 section is about .73% smaller than the regulation calculated value, and the measured value of the 3L/4 section is about 15.73% larger than the regulation calculated value. It shows that the geometric non-linear moment value of the control section of the CFST arch calculated by the eccentricity increase coefficient in the regulation is conservative, but the influence of geometric non-linearity of other sections is not considered enough, and the local damage of other sections may occur before the control section under the action of the large vertical load, which also shows that the calculation mode of the regulation, considering the whole arch affected by geometric non-linearity due to the eccentricity increase coefficient, is not reasonable.
5 Conclusion
The specific results of the analysis are as follows:
(1) The failure of the arch mainly comes from the linear bending moment generated by the internal force of the arch foot and the external load and the non-linear bending moment directly generated by the external load after deformation. In contrast, the eccentric compression column mainly comes from the linear bending moment generated by the eccentric force and the non-linear bending moment generated by the transverse deformation or transverse force. These two modes have different force structures, force transmission routes, and deformation sources, which lead to different bearing mechanisms.
(2) The deformation state of the arch in the whole process is divided into three stages: elastic deformation, elastic–plastic deformation, and plastic deformation. Similar to the eccentric compression column, its failure mode is also a hinge failure. However, the experimental phenomenon showed that due to different bearing mechanisms of the two modes, the final failure state of the arch exhibits 4-hinge failure and has strong plastic deformation ability. In contrast, the eccentric compression column exhibits single-hinge failure, which indicates that the deformation ability of the arch is inevitably reduced after the arch is equivalent to a column of considerable length.
(3) The initial geometric non-linear moments measured based on the “arch mode” are in good agreement with the calculated results of the “rod mode.” However, the increase in load increased the proportion of geometric non-linear effects, and the geometric non-linear moments calculated by the eccentricity increase coefficient are conservative. In the complex force environment, there is a high possibility of local damage of other sections before the control section, which indicates that the calculation mode of the regulation considering the full arch affected by geometric non-linearity through the eccentricity increase coefficient is not good.
(4) This paper proposes a new calculation model for CFST arch bridges considering geometric non-linear internal forces, which can provide a new idea for the future large-span arch bridge bearing capacity and stability and other verification models. It can help optimize the arch axis and arch rib section form and structure and enhance the arch bridge span.
Data availability statement
The original contributions presented in the study are included in the article/Supplementary Material; further inquiries can be directed to the corresponding author.
Author contributions
SW mainly provided key ideas and insights. YL authored the paper. ZL and TC assisted with the paper.
Funding
This work was supported by Science and Technology Innovation Project of Chongqing Education Commission “Construction of Twin Cities Economic Circle in Chengdu-Chongqing Region” (KJCXZD2020032), Natural Science Foundation of Chongqing (cstc2021jcyj-msxm2491), Guangxi Key Research and Development Program (GuikeAB22036007-8), Chongqing Technology Innovation and Application Development Special Key Project (CSTB2022TIAD-KPX0205). This support is gratefully acknowledged.
Conflict of interest
The authors declare that the research was conducted in the absence of any commercial or financial relationships that could be construed as a potential conflict of interest.
Publisher’s note
All claims expressed in this article are solely those of the authors and do not necessarily represent those of their affiliated organizations, or those of the publisher, the editors, and the reviewers. Any product that may be evaluated in this article, or claim that may be made by its manufacturer, is not guaranteed or endorsed by the publisher.
References
Bradford, M. A., and Pi, Y-L. (2014). Geometric nonlinearity and long-term behavior of crown-pinned CFST arches. J. Struct. Eng. 141 (8), 04014190. doi:10.1061/(asce)st.1943-541x.0001163
Chen, B. C. (2016). Concrete filled steel tube Arch Bridge. Beijing: People's Communications Publishing House, 276–277. [In Chinese].
Chen, B. C., Qin, Z. B., and Chen, Y. J. (2004). “Equivalent beam and column method for simplified calculation of ultimate bearing capacity of concrete-filled steel tubular arch,” in Proceedings of the 16th National Bridge Conference 2, Changsha, China, 9–14. [In Chinese].
Guo, F., Li, P. F., and Mao, J. Y. (2022). Dong yanzhao. Calculation method for increasing coefficient of arch rib eccentricity of long-span arch bridge. J. Jilin Univ. Eng. Technol. Ed. 52 (06), 1404–1412. [In Chinese]. doi:10.13229/j.cnki.jdxbgxb20220147
Huo, X. J., and Han, L. Z. (2014). Analysis of geometric nonlinearity of special-shaped arch bridges. J. Highw. Transp. Res. Dev. Engl. Ed. 8 (3), 37–45. doi:10.1061/jhtrcq.0000395
Jiang, W., Wang, L., and Li, Y. J. (2018). Out-plane stability safety factors of CFST arches using inverse finite element reliability method. IOP Conf. Ser. Mater. Sci. Eng. 392 (2), 022035. doi:10.1088/1757-899X/392/2/022035
Li, J. (2012). Study on the increase coefficient of bending moment of reinforced concrete arch bridge. Sichuan, China: Southwest Jiaotong University. [In Chinese].
Li, L., and Lei, K. (2022). Research on influence factors of bearing capacity of concrete-filled steel tubular arch for traffic tunnel. Symmetry 14 (1), 167. doi:10.3390/SYM14010167
Lin, S. S., and Chen, B. C. (2016). Calculation of bearing capacity of reinforced concrete arch by equivalent beam-column method. J. Fuzhou Univ. Nat. Sci. Ed. 44 (01), 110–114. [In Chinese].
Liu, K. M., and Sun, X. Z. (2021). Bearing capacity of concrete filled steel tube circular arch under the six-point uniformly distributed loading and its engineering application. Adv. Mater. Sci. Eng. 2021, 2021–2113. doi:10.1155/2021/8288648
Liu, Y., Wang, D., and Zhu, Y. Z. (2011). Analysis of ultimate load-bearing capacity of long-span CFST arch bridges. Appl. Mech. Mater. 1446, 1149–1156. doi:10.4028/www.scientific.net/amm.90-93.1149
Ministry of Transport of the People's Republic of China (2015). Code for design of concrete filled steel tube arch bridge for highway. Beijing, China. (JTG/T D65-06-2015) [In Chinese].
Wang, J. Z., and Guo, J. F. (2020). Analysis of influence factors and stability of concrete-filled steel tube arch bridge. IOP Conf. Ser. Mater. Sci. Eng. 768 (3), 032053. doi:10.1088/1757-899X/768/3/032053
Wang, W. (2009). “Ultimate capacity analysis of concrete-filled steel tubular structure under eccentric compression,” in International Conference on Transportation Engineering, Chengdu, China, 1481–1486.
Wei, J. G., Chen, B. C., and Wu, Q. X. (2010). Equivalent beam-column method for calculation of nonlinear critical Load of concrete-filled steel tube flexural arch. Eng. Mech. 27 (10), 104–109. [In Chinese].
Wei, J. G., Chen, B. C., and Wu, Q. X. (2009). Equivalent beam-column method for calculation of ultimate bearing capacity of bending steel pipe. Chin. J. Comput. Mech. 26 (01), 87–93. [In Chinese].
Wu, X. R., Liu, C. Y., Wang, W., and Wang, Y. Y. (2015). In-plane strength and design of fixed concrete-filled steel tubular parabolic arches. J. Bridge Eng. 20 (12). doi:10.1061/(ASCE)BE.1943-5592.0000766
Yang, L. F., Xie, W. W., Zhao, Y. F., and Zheng, J. (2020). Linear elastic iteration technique for ultimate bearing capacity of circular CFST arches. J. Constr. Steel Res. 172, 106135. doi:10.1016/j.jcsr.2020.106135
Ye, S. (2013). Parameter analysis on ultimate load-carrying capacity of CFST arch rib with new-type dumbbell-shaped section. Adv. Mater. Res. 2203, 634–638. doi:10.4028/www.scientific.net/AMR.634-638.3825
Yuan, C. C., Hu, Q., Wang, Y. Y., and Liu, C. (2020). Out-of-plane stability of fixed concrete-filled steel tubular arches under uniformly distributed loads. Mag. Concr. Res. 73 (18), 945–957. doi:10.1680/jmacr.19.00526
Zhang, Y. F., Guo, D. L., and Mei, B. R. (2022). Numerical analysis of eccentric compression performance of CFRP-confined concrete-filled steel tube (CFST) columns. J. Institution Eng. (India) Ser. A 103 (2), 543–555. doi:10.1007/S40030-022-00638-0
Zhang, Y. Y., and Yu, C. L. (2013). Nonlinear stability impact of concrete-filled steel tube arch bridge. Adv. Mater. Res. 2605, 1168–1171. doi:10.4028/www.scientific.net/amr.785-786.1168
Zhao, Y. F., Xie, W. W., and Yang, L. F. (2021). Elastic modulus reduction method for stable bearing capacity analysis of dumbbell-shaped CFST arches. J. Phys. Conf. Ser. 2044 (1), 012163. doi:10.1088/1742-6596/2044/1/012163
Zou, Y., Yu, K., Heng, J., Zhang, Z., Peng, H., Wu, C., et al. (2023). Feasibility study of new GFRP grid web - concrete composite beam. Compos Struct. 305, 116527. doi:10.1016/j.compstruct.2022.116527
Keywords: concrete-filled steel tube arch, arch mode, geometric non-linearity, coefficient of eccentricity increase, equivalent beam and column method, eccentric compression column
Citation: Wang S, Li Y, Liu Z and Cheng T (2023) Calculation model of concrete-filled steel tube arch bridges based on the “arch effect”. Front. Mater. 9:1084999. doi: 10.3389/fmats.2022.1084999
Received: 31 October 2022; Accepted: 15 December 2022;
Published: 06 January 2023.
Edited by:
Cong Zhang, Jiangnan University, ChinaReviewed by:
Amir R. Masoodi, Ferdowsi University of Mashhad, IranShao-Bo Kang, Chongqing University, China
Copyright © 2023 Wang, Li, Liu and Cheng. This is an open-access article distributed under the terms of the Creative Commons Attribution License (CC BY). The use, distribution or reproduction in other forums is permitted, provided the original author(s) and the copyright owner(s) are credited and that the original publication in this journal is cited, in accordance with accepted academic practice. No use, distribution or reproduction is permitted which does not comply with these terms.
*Correspondence: Yingbin Li, MjgxNjUwNjU5QHFxLmNvbQ==