 Elmazeg Elgamli
 Fatih Anayi
 Mokhtar Shouran
- Wolfson Centre for Magnetics, School of Engineering, Cardiff University, United Kingdom
Minimising power losses and their consequences is a significant matter in electrical steel applications. Increasing the resistivity of the steel strips has been confirmed as a successful method to overcome the problem of power losses. To increase the resistivity of the strip, different effective methods have been proposed and tested. In this work, a new material has been proposed to achieve the objective of increasing the resistivity of the steel samples by adding Manganese (IV) oxide based on a diffusion technique. The surface of the samples is to be coated with the proposed Manganese oxide. This should guarantee an increase in the resistivity of the samples, which in turn reduces the power losses caused by the eddy current. The samples tested were of non-oriented electrical steels containing 2.4 wt% Si-Fe (with a thickness of 0.305 mm*300 mm*30 mm). It was measured for losses and permeability before and after treatment by a Single Strip Tester (SST) at 0.5–1.7 T using an Alternating Current magnetic properties measurement system under controlled sinusoidal at different frequencies. The obtained results revealed that the depth of Manganese oxide diffusion is inversely proportional to the increase in the temperature. It was demonstrated that the best amount of diffusion of the element into the strips was achieved at 525°C, which was 60 weight % in comparison with 700°C which was 20 wt%. Likewise, at 800°C it was 7 wt%. However, the depth of diffusion of the manganese was the same at those tested temperatures, which were equal to 200 µm deep on each of the side strips. The diffusion of the material was investigated using Scanning Electron Microscope (SEM) coupled with Energy Dispersive X-ray Spectroscopy (EDS). Furthermore, from the results, it was concluded that the power losses in the coating samples were improved by 9% as compared with uncoated samples.
1 Introduction
Electrical steel is one of the most important soft magnetic materials for mechanical systems and transformers. It can be either Non-Oriented (NO) or grain-oriented (GO) (Godec et al., 1999; Heo, 2004; Tanaka and Yashiki, 2007; Ko et al., 2013). Non-Oriented Electrical Steels (NOES) are the most frequently used core materials for electric motors, generators and alternators because of their high magnetic permeability, high magnetisation saturation, minor core loss, and low cost (Jakubovics and Chen, 1979; Moses, 1990; Cullity and Graham, 2009; Moses, 2012; Silveyra et al., 2018). NO electrical steel is a type of soft magnetic material, that is, simply magnetised and demagnetised (Nakayama et al., 1996). Such steels are pluralist approaches in Alternating Current (AC) electromagnetic fields with a frequency of 50 Hz and provide the basis for the manufacturing output of asynchronous motor cores, powerful electric rotating machines, limited generators, along with other electrical motors that transfer electrical energy to mechanical energy or vice-versa (Liu et al., 2016). Losses that contribute to the core loss of non-oriented electrical steels can be classified as the following: hysteresis loss, classical eddy-current loss and excess loss. It is recognised that the shape and behaviour of magnetic domains in external fields, in addition to the microstructure and texture of electrical steel, influence magnetic properties, namely hysteresis loss and excess loss (Mənescu et al., 2016; Kadyrzhanov et al., 2019; Kozlovskiy et al., 2019). One of the major contributors to total core losses is known as “eddy current losses,” which are induced by electrically conductive core material, producing currents. It is essential to find a mechanism to make the core more current-flow resistant while still enabling unrestricted magnetic flux flow (Leuning et al., 2018). This is accomplished in a mains transformer by adding approximately 3% silicon to the iron, increasing its resistance to 4.5
According to several previous scientific investigations, typical stress relief heat treatment improves the magnetic characteristics of punched, fully processed silicon steels (Landgraf and Emura, 2002; Paolinelli and da Cunha, 2006; Chiang et al., 2014). A similar annealing method, that is, often used in the industry involves heating at a gradual pace of 200°C per hour, then soaking for an hour at a temperature between 700°C and 800°C (Paolinelli and da Cunha, 2006). The materials are cooled down in a similar way, although much more slowly. The entire conventional process, including heating, annealing and cooling, lasts for approximately 12 h.
There have been several efforts to investigate the influence of manganese on high silicon alloyed electric steels with varying Mn contents (0.20, 0.69, and 1.38 wt%). The effect of Mn on mechanical, microstructural, and magnetic properties has been thoroughly investigated in (Schulte et al., 2018). The addition of Mn reduced grain size while also improving electrical resistance, resulting in decreased core losses at higher frequencies. It was revealed that Mn (0.3%–1.5% wt%) in electrical steel improves its magnetic characteristics. However, if the Mn concentration exceeds the range, the grains become smaller and the magnetic losses increase (Rastogi, 1977). Also; it was found that when Mn concentrations are high, core loss drops significantly, and magnetic flux density rises modestly (Liao, 1986).
The study conducted by (Moses and Thursby, 1983) has shown that using silicon as a diffusant may minimise the power loss of non-oriented silicon iron. Layer thickness is reduced when aluminium is placed unevenly across surface areas, including both in terms of content and thickness penetration. On both sides of the samples, there was evidence of a thin coating of porosity. When this method of diffusion is used, the composition changes the anisotropy constants very slightly, which is what possibly creates the right amount of internal stress (Tumanski, 2016). A significant drawback concerning this method is the creation of a permeable material on the side of the steel, the amount of diffusant that permeates the steel sheet from the paste can be regulated by means of restricting several diffusants, either by means of the structure of the paste and depth or by creating an appropriate paste to guarantee an excess of diffusant is always accessible. Prior to completely removing the remaining coating, the quantity of soft material can be modified by adjusting the duration and the heat of the fire. Additionally, by establishing a controlled resistivity gradient along the thickness of the sheet, it might be possible to increase the steel’s effectiveness in distorted magnetisation conditions. To ascertain what happens to an electrical steel sheet’s magnetic property when a distorted flux waveform is present, materials with different resistivities all the way through their thickness were made by diffusing tiny amounts of aluminium into silicon steel (Anayi et al., 2003).
This paper describes work where Manganese (IV) oxide has been coated on the surface of silicon iron and diffused into the laminations using comparable different temperature anneals. The diffusion technique and subsequent heat treatment enable the concentration of the diffused element to be varied through the thickness of the samples. The surface of the samples is to be coated with the proposed Manganese oxide. This should guarantee an increase in the resistivity of the samples, which in turn reduces the power losses caused by the eddy current. The experiment conducted for this study has two distinct stages. In the first step, the permeability and power loss of uncoated samples with Manganese (IV) oxide paste of NO electrical steel were measured. In the second step, the permeability and power loss of samples coated with Manganese (IV) oxide paste were measured and compared the uncoated samples. The term “coating” subsequently refers to applying MnO2 paste to the coated Si-Fe strips.
2 Material and experimental procedure
2.1 Materials
The material proposed in this paper is Manganese (IV) oxide (MnO2) powder activated, ∼85% (Merck Life Science United Kingdom Limited), with particle size <10 μm (as analysed by the supplier). Similarly, this study made use of Silicone oil supplied by Merck Life Science United Kingdom Limited, which was utilised as the adhesive and diluted by way of using Aston as a pure solution. The adhesives physical characteristics are listed in Table 1.

TABLE 1. Characteristic of adhesive.
2.1.1 Mixing silicone oil into MnO2 powder
Powdered Manganese (IV) oxide (MnO2) and Silicone oil solution were combined to make a paste. Silicone oil comprised 0.5 wt% of the paste composition per gramme of manganese (IV) oxide. The paste was then dried at 50°C for 1 hour to verify that the acetone had fully evaporated and the powdered Manganese had adhered sufficiently.
2.1.2 Preparation of samples without coating
The Non-Oriented Electrical Steel (NOES) “2.4 wt% Si-Fe” 30 × 0.305 × 300 mm (width × thickness × length) M330-35A was employed in this study. Table 2 demonstrates in detail the variation in the chemical properties of the grade, which further contains minimal quantities of other components that are consistent between the grades. The steel was supplied by Tata Steel/Cogent Power and punched using new tooling by Wingard & Co., Baltimore, United States. Data from Table 3. Manufacturer-provided material data for the M330-35A samples (Cogent Power, 2008; Cogent Power, 2009).
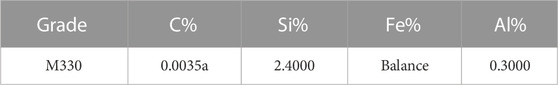
TABLE 2. Chemical composition of M330-35A samples.

TABLE 3. Manufacturer-provided material data for M330-35A samples.
Prior to coating the samples, the power loss and permeability of the non-oriented steel were tested using the Single Strip Tester (SST) at inductions of 0.5T–1.7 T and magnetising frequencies of 50, 100, 200, 400, 500 and 700 Hz up to 1 kHz.
2.2 Experimental procedure
2.2.1 Heat treatment
The samples were annealed in an argon gas atmosphere in a fired furnace at a temperature rate increase of 200°C/h to reach 800°C after 4 h and held for up to 2 h. For stress relief, annealing at 800°C was carried out downstream of the main annealing process. The temperature curve of the stress-relief annealing in relation to the recording of the furnace cycle is shown in Figure 1.
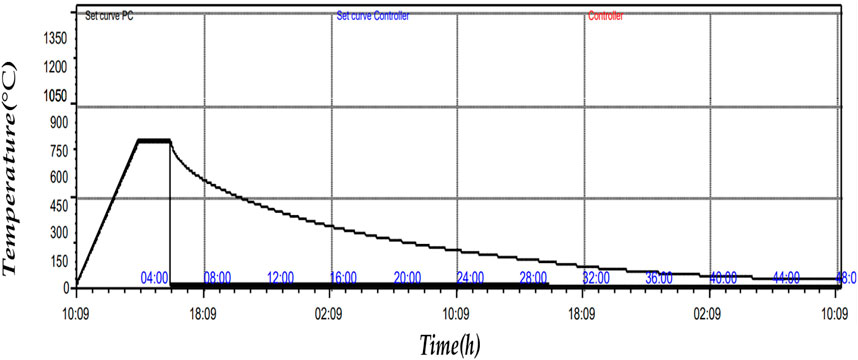
FIGURE 1. Temperature and times for the diffusion annealing process.
During the sintering process, argon gas was utilised as a protective environment. Prior to the annealing cycle, the furnace was cleansed for 30 min with an Argon gas flow of 5 L/min to remove any traces of the ambient air. The flow rate of Argon gas was set at 4 L/min throughout the duration of the heat treatment.
2.2.2 Samples coated with MnO2
Manganese (IV) oxide (MnO2) powder was made with Silicone oil solution to form a paste. The sample particles were coated with MnO2 via the surface diffusion technique, this was then coated on both sides of the non-oriented electrical steel strips.
In the next stage, the annealed samples were reheated after coating. These were then annealed at three distinct temperatures (535°C, 700°C, and 800°C) and at three different times: 180, 60 and 45 min. Subsequently, they were cooled in the furnace to room temperature.
2.3 Magnetic property measurements by SST
Single Sheet Testers (SST) or Epstein frames are regularly used to determine the characteristics of electrical steel, as recommended by IEC-Standards (IEC 404-2) (S. Standard, 1996) and (IEC 404-3) (S. Standard, 1992). The significance of this type of measurement system is specific to the permeability and power loss (W/kg) at various magnetising frequencies. The “Wolfson Centre for Magnetics” at Cardiff University developed the Single Strip Tester (SST) system, which delivers highly accurate and automatic measurements. With the exception of the frame itself, the Epstein frame system is comparable to the (SST) (Bertotti, 1987). The system is shown in Figure 2 and comprises of a PC with LabVIEW version 2019 already installed, a DAQ (data acquisition Card) from NI PCI-6120, a power of amplifier, a 1 Ω shunt resistor (Rshunt), as well as an air flux adjusted SST (Somkun, 2010; Instruments, National, 2002). According to IEC 404-3, twin vertical yokes of GO silicon steel or nickel-iron alloy are employed. Furthermore, twin vertical yokes are made of GO silicon steel or nickel-iron alloy. The main coil of 865 turns (N1) is wrapped around the secondary winding, whilst a secondary coil of 250 turns (N2) is wrapped around the plastic frame. Between the yokes is a typical Epstein strip size sheet (305) mm long and 30 mm wide. This setup provides a low reluctance path. AC tests were performed under comparable settings, with frequencies ranging from 50 to 1000 Hz.
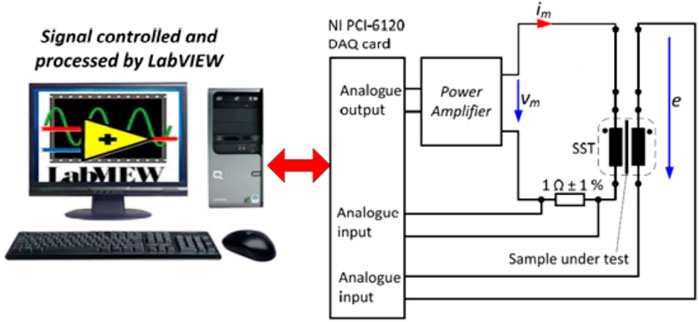
FIGURE 2. AC magnetic property measurement system.
2.4 Characterisation of microstructure
The samples were sliced and prepared (roughly 15–20 mm square) for examination under a scanning electron microscope to determine diffusion effects.
The final distribution relating to the effectiveness of the diffusion of the Manganese to both surfaces was investigated for strips of non-oriented electrical steel were tested as follows: concentration profiles measured Energy Dispersive X-ray Spectrometer (EDS) by using Scanning Electron Microscope (SEM).
Scanning Electron Microscope (SEM) was used to characterisation the sample’s composite-coated steel. Inclusions were observed by Scanning Electron Microscope (SEM) and energy-dispersive spectroscopy (EDS) for elemental analysis.
2.5 Core loss separation method
The overall loss contains both hysteresis and eddy current loss components. The per-cycle hysteresis loss is presently determined using a different method. This approach measures core loss at various frequencies. When the magnetisation frequency curves at different flux densities are extrapolated to zero frequency, the hysteresis loss per cycle, which is the hysteresis energy loss per cycle, can be determined (Mthombeni and Pillay, 2006).
The linear equation is the reason for the magnetising frequency using the maximum flux density B. Subsequently, the core loss data are applied with the aim of plotting the curves of Pc/f versus f. The curves are straight lines.
Where A = Kℎ
More information for determining these coefficients is available in (Chen and Pillay, 2002; Ionel et al., 2006; Ibrahim and Pillay, 2012).
To obtain the overall hysteresis loss, multiply the static hysteresis power by the magnetising frequency. The hysteresis power loss per cycle is frequency independent. Having this knowledge is essential when applying the extrapolation method. Nevertheless, only at low frequencies is this supposition is valid. It would result in a non-uniform magnetic field throughout the lamination at higher frequencies, which would complicate the calculation.
Consequently, at every point within the lamination, each cycle’s hysteresis loop and hysteresis power losses are distinct. On account of this, it is better to use the extrapolation method to determine the core loss separation at a low frequency; otherwise, the skin effect should indeed be considered (Boon and Robey, 1958).
2.5.1 Core loss separation
The three-term formula follows the same approaches employed to separate losses into their eddy current and hysteresis components. However, in this instance, a third term reflecting the excess loss is provided.
By dividing Eq. 3 by the magnetising frequency, we obtain Eq. 4 which represents the total power losses.
In this approach, which is similar to the two-term separation technique, the first right hand (Pℎ) represents the hysteresis loss component, the second (Pe) represents the eddy current loss component, whereas the third (Pa) represents the excess or anomalous loss component.
As the latter is influenced by micro-structural interaction, magnetic anisotropy and the non-homogeneous domestically driven eddy current (Mayergoyz and Serpico, 1999), the constant coefficients are as follows.
An alternative viable method for finding the coefficients. The core loss per cycle is shown against the square root of frequency √ f rather than the frequency f for different levels of flux density B ranging from the smallest to the highest frequency (Williams et al., 1950).
Consequently, (6) may be adjusted by
Where Pc/f is shown on the y-axis and √f is plotted on the x-axis, A, B and C may be determined using nominal curve fitting. A comparison of Eq. 4 and Eq. 6 gives
Thus, when using this approach with certain flux densities, the loss coefficients
In conclusion, Eq. 1 and Eq. 6 emphasise that the extrapolation technique is employed to determine that eddy currents cause a linear relationship between the frequency and the amount of power lost per cycle. Additionally, it is believed that hysteresis loss per cycle is frequency independent.
3 Results and discussions
3.1 Microstructure, grain size and texture
Figure 3 explains the SEM and EDS analysis of typical inclusions in the final annealed samples. The samples were coated and polished using acetone. Scanning electron microscope and EDS was performed to analyse the Manganese inclusions. The EDS analysis revealed that a significant part of the sample that contains Manganese. The inclusions containing Manganese were predominantly (<250 µm) in size. Inclusions with different Manganese contents can be seen in Figures 3–5. The results of the EDS analysis are shown in the tables in relation to each figure.
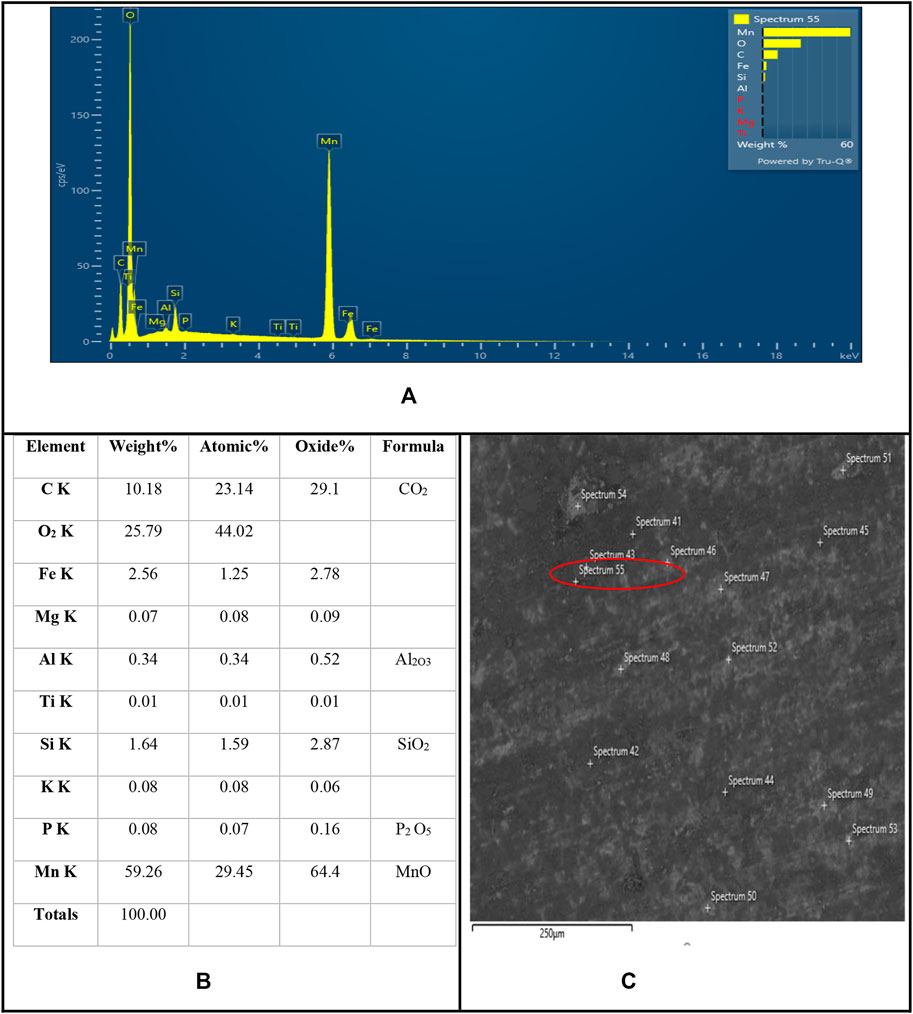
FIGURE 3. Distribution of elements after heat treatment at 525°C with Energy Dispersive System Analysis of X-rays using SEM. (A). Energy dispersive X-ray (EDX) spectra of sample, (B) Table EDS analysis of inclusions from Figure (C), (C) Complex inclusions in the sample of non-oriented electrical steel sheet containing % Mn.
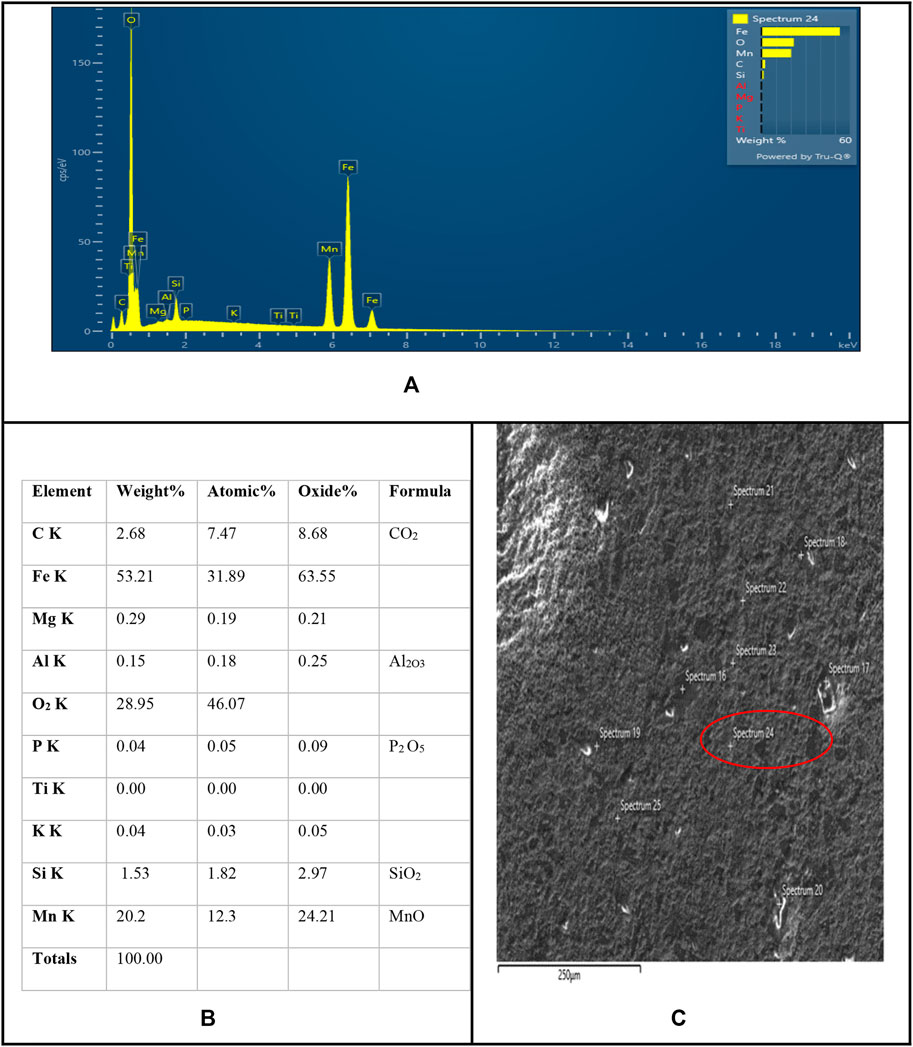
FIGURE 4. Distribution of elements after heat treatment at 700°C with Energy Dispersive System Analysis of X-rays using SEM. (A). Energy dispersive X-ray (EDX) spectra of sample, (B) Table EDS analysis of inclusions from Figure (C), (C) Complex inclusions in the sample of non-oriented electrical steel sheet containing % Mn.
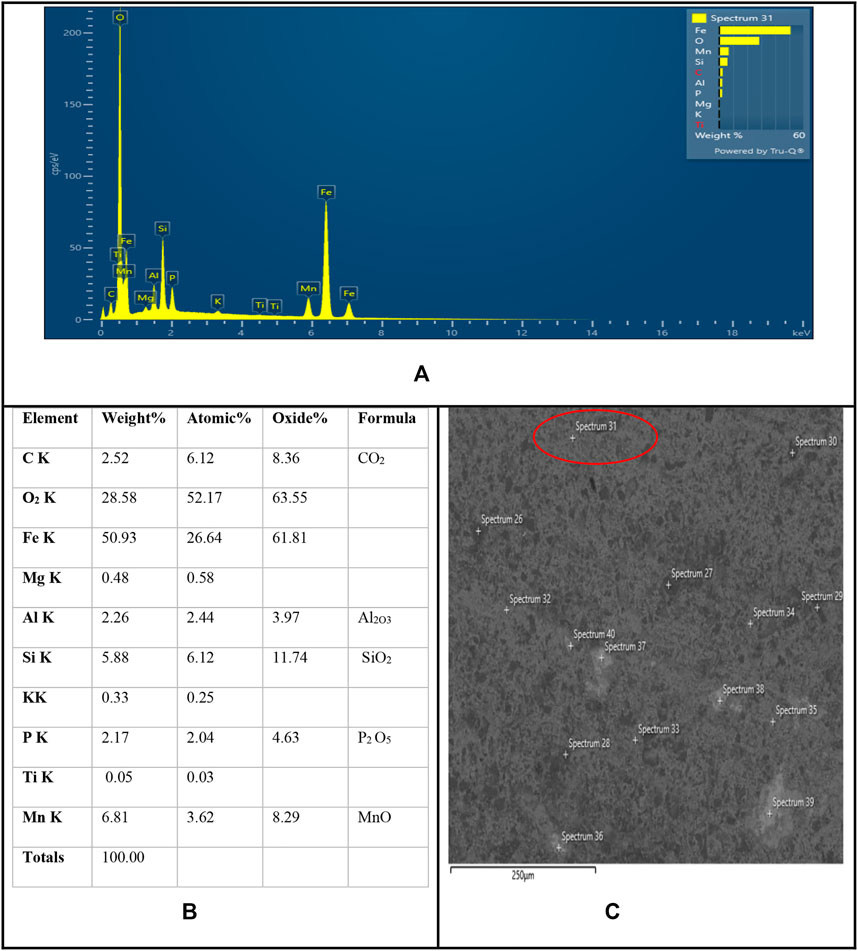
FIGURE 5. Distribution of elements after heat treatment at 800°C with Energy Dispersive System Analysis of X-rays using SEM. (A). Energy dispersive X-ray (EDX) spectra of sample, (B) Table EDS analysis of inclusions from Figure (C), (C) Complex inclusions in the sample of non-oriented electrical steel sheet containing % Mn.
In the table pertaining to Figure 5, it can be noted that the inclusions that contain small amounts of Mn are exceedingly complex. The inclusions contain even more zirconium than Manganese. The high oxygen and carbon contents of the inclusions reveal the presence of Manganese oxides.
After coating the electrical steel with MnO2, the analysis of the deep elements was performed using EDS. During the EDS measurement, different areas were focused on. Figure 3 illustrates the identical peak. All of the MnO2 can be noticed in the synthesised, nanostructures in the EDS spectrum. Where it was revealed that the major elements present were manganese, oxygen and carbon, in spectrum 55, the quantity of Mn, O2 and C were 59.2, 25.79, and 10.18 weight %, respectively. Subsequently, after heat treatment, a small amount of impurity in conjunction with the presence of reduced titanium, was observed. However, while observed in spectrum 24, the values were noted to be 20.2, 28.95, and 2.68 measured in weight % for Mn, O2 and C, respectively.
It was also observed that after mixing the Mn compound with Si oil particles followed by a heat treatment at 525°C and 700°C, the carbon amount was ascertained to increase, Similarly, the EDS graph in the figures indicates the presence of Fe that confirms the successful coating of the surface of the Mn with Si oil.
The elemental composition of the material was analysed using EDS to determine the nature of the composite, revealing that true functionalization occurred. Details of the three EDS spectra of the concentration (Mn) values measured in atomic and weight % are listed.
3.2 Effect of temperature on power losses
Figure 6 describes the impact of temperature on the characteristics of the sample in terms of power losses at 400 Hz and 1.5 T. The power losses increase linearly when the temperature of the sample increases (uncoated or coated). The effect of temperature on the samples’ properties confirms that the highest increase in power loss at 52 W/kg occurs at 700°C when the firing time was 45 min.
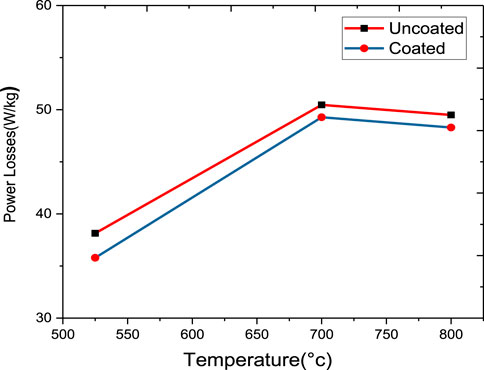
FIGURE 6. Power losses (400 Hz, 1.5 T) for coated and uncoated samples at different temperature.
At the melting point of Mn at 525°C, the following values were obtained: uncoated at 39 W/kg and coated at 35 W/kg when the firing time was 60 min. Also, from Figure 6, as can be seen, the maximum temperature of 800°C has a slight reduction in power losses to 49 W/kg when compared to 700°C. Thus, its dissolving power is maximised.
Figure 6 explains the power losses with different temperatures for the Manganese oxide sample both with and without coating whilst heating from 525°C to 800°C, respectively. In both cases, the power losses increased as the temperature increased from 525°C to 700°C. However, when the temperature reached 800°C, there was an insignificant decrease in power losses. Furthermore, the peak of power losses appeared at 700°C, indicating a significant increase in power losses, as shown in Figure 6 in both cases. Based on the results of the melting performance for manganese oxide, the annealing temperatures implemented in this study were 525°C, 700°C, and 800°C. Therefore, the fact that the melting point of manganese oxide is 525°C has contributed to improving the performance of samples and reducing power losses, is considered.
3.3 Effect of temperatures on permeability
Figure 7 demonstrates permeability at 400 Hz, 1.5 T for coated and uncoated samples with manganese oxide contents at different temperatures during sintering times of 1 hour, 45 min, and 30 min. It was observed that the permeability rose with the temperature and some of samples used (coated and uncoated). It was established that permeability decreased when the sample reached 525°C but was high when used at the same temperature without being coated. It was observed that coated specimens had less permeability than the uncoated samples at 700°C. Magnetic permeability decreases by increasing the temperature rate to 800°C. This is caused by conditions brought on by an excess of lubricant that reduced permeability. Holding the sintering time had a visible impact on magnetic permeability, which will help minimise specimen flaws. It is apparent that specimens with an hour-long holding period have greater magnetic permeability than those with a 30-min holding period.
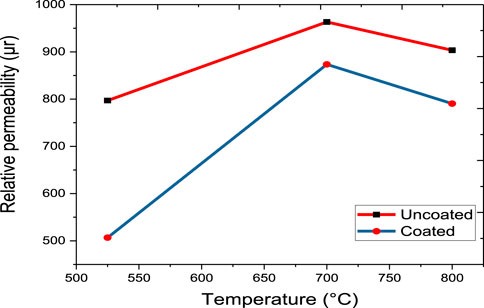
FIGURE 7. Permeability at 400 Hz, 1.5 T for coated and uncoated samples at different temperature.
Consequently, the permeability of composites increases with increasing annealing temperature, whereas power loss diminishes when the annealing temperature is increased.
3.4 Power loss components
From the results obtained by applying the following method to calculate power loss separation, the power loss of the non-oriented electrical steel samples was measured using the SST system explained in (Chen and Pillay, 2002) and (Ibrahim and Pillay, 2012), in which all power loss measurements were made.
Typically, as shown in Table 4, at a maximum flux density of 1.5 T and magnetising frequencies of 50, 100, 200, 400, 500, and 700 Hz to 1 kHz, the power loss of NO steel is calculated.
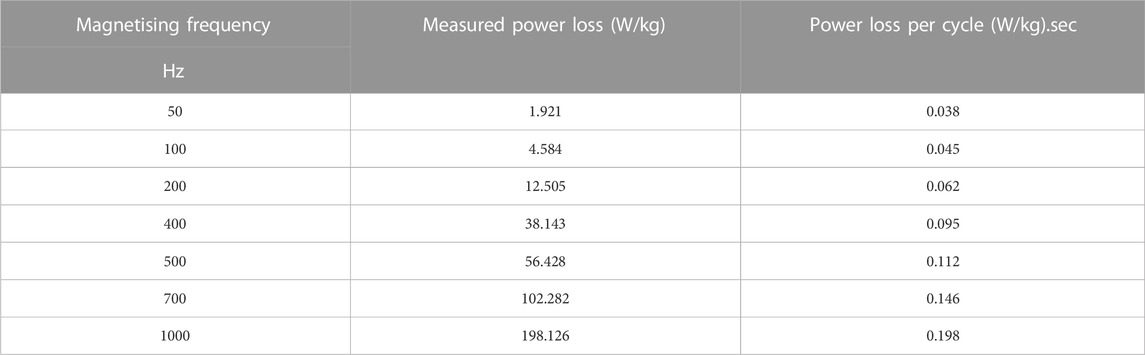
TABLE 4. Power loss of NO steel measured at various magnetising frequencies, with a total power loss per cycle uncoating at a peak flux density of 1.5 T.
Figure 8 shows the measured power loss per cycle versus the frequency’s square root. By fitting a polynomial curve to this curve in Microsoft Excel, we can find the coefficients of the power loss parts.
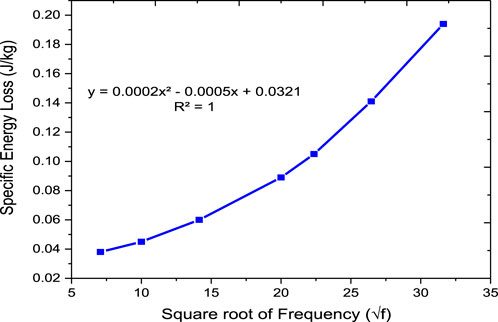
FIGURE 8. Total power loss per cycle of a magnetic sample made of non-oriented steel at a 1.5 T flux density against the square root of frequency.
The fitting equation’s residual values are often very near to unity, or
Table 5 shows the results of determining the power loss components at various frequencies using the equations from Figure 8.
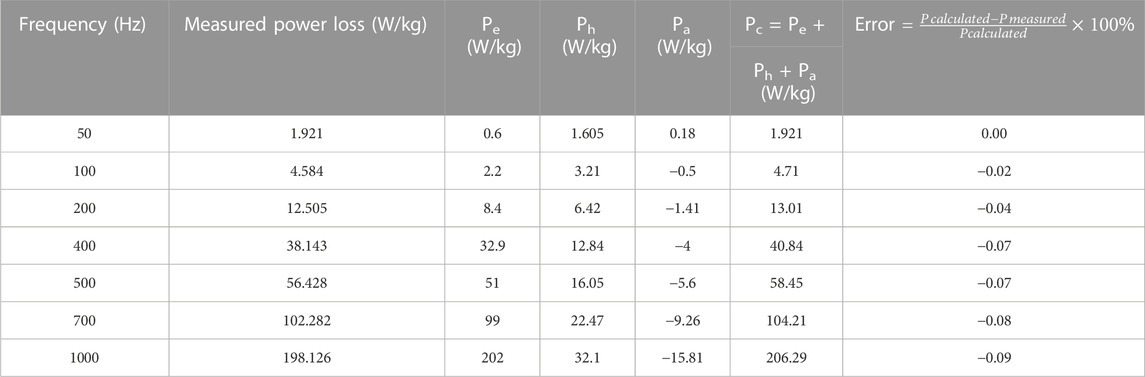
TABLE 5. Power loss components of SST of NO steel at various magnetising frequencies and a peak flux density of 1.5 (T) with uncoated samples.
The power loss components, as illustrated in Table 5, are calculated by applying these coefficients in Eq. 6. Figure 9 demonstrates the relationship between the magnetising frequency and the hysteresis power loss and eddy current power loss at 1.5 T. The static hysteresis loops are utilised to calculate hysteresis loss. However, an equation may be used to calculate eddy current power loss per cycle as a linear function of the magnetising frequency:
Where
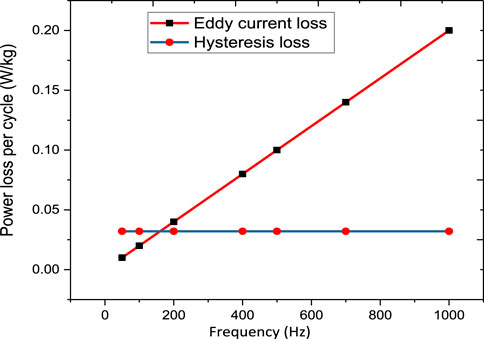
FIGURE 9. Eddy current and hysteresis loss per cycle versus frequency.
Power loss of non-oriented steel is measured at a peak flux density of 1.5 T at different magnetizing frequencies with total power loss per cycle with coating as shown in Table 6.
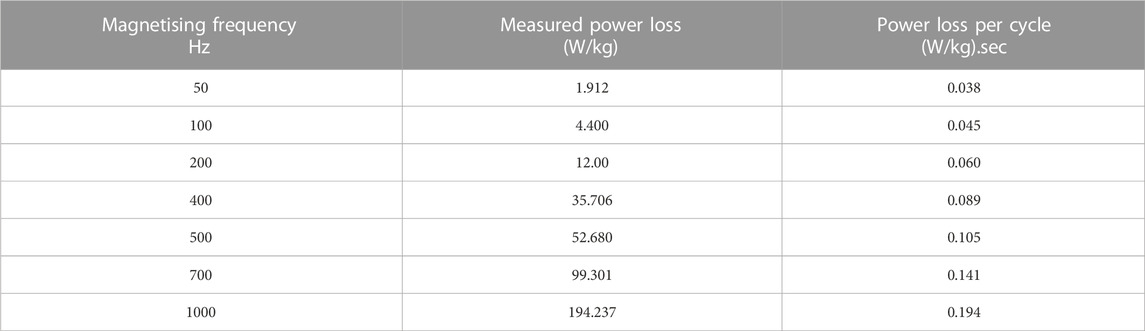
TABLE 6. Power loss of non-oriented steel is measured at a peak flux density of 1.5 T at different magnetizing frequencies with total power loss per cycle with coating.
The power loss separation findings for the same material with a coating are shown in Table 7.
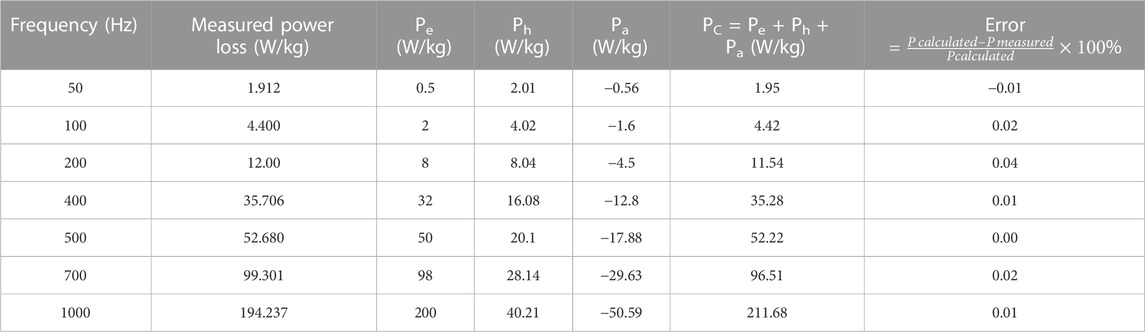
TABLE 7. Power loss components of an SST of NO steel at various magnetising frequencies and a peak flux density of 1.5 (T) with coated samples.
Figure 10 shows the measured power loss per cycle versus the frequency’s square root. By fitting a polynomial curve to this curve in Microsoft Excel, we can find the coefficients of the power loss parts with coating.
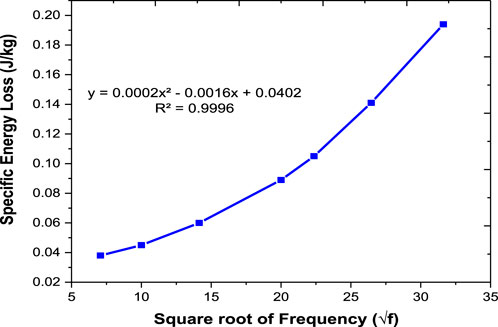
FIGURE 10. Shows the total power loss per cycle of a magnetic sample made of NO steel at a 1.5 T flux density against the square root of frequency.
Table 8 illustrates a comparison was made between the eddy current power loss obtained by the extrapolation method (experimental based) and eddy current calculated by the conventional formula (theory-based). This experiment indicated that the eddy current loss calculated in a sample at low induction and low frequency is virtually equal to that observed by the extrapolation method. Most of the extra loss changes with the frequency and strength of the field at the same eddy current power loss.
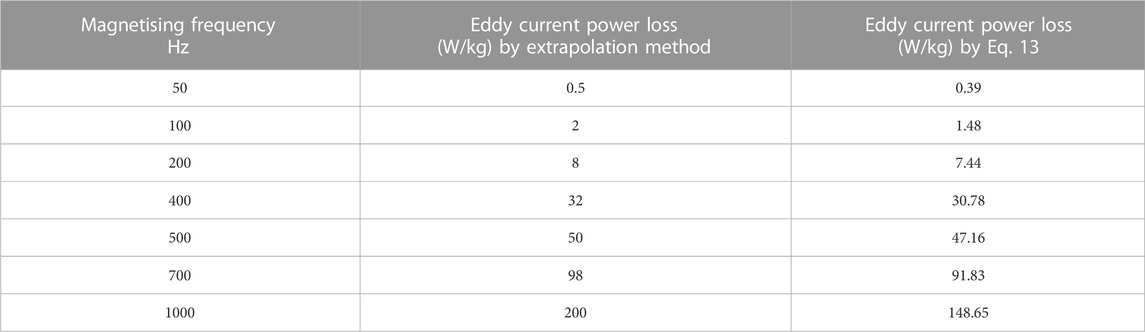
TABLE 8. Results obtained using by extrapolation method and the comparison of Eq. 13 was used to figure out the eddy current power loss of an SST with a peak flux density of 1.5 T and different frequencies.
Table 9 displays the percentage reduction in power loss for uncoated and coated samples at various frequencies and verifies that the reduction in power loss occurs at a peak flux density of 1.5 T. The diffusion of manganese (IV) oxide reduces losses by approximately 8% at 500Hz and 7% at 400 Hz at the same value flux density. Moreover, as the internal effects of the internal flux distribution are greater even when AC magnetism was used, the unequal amount of Mn causes a resistivity gradient that lowers eddy current loss.
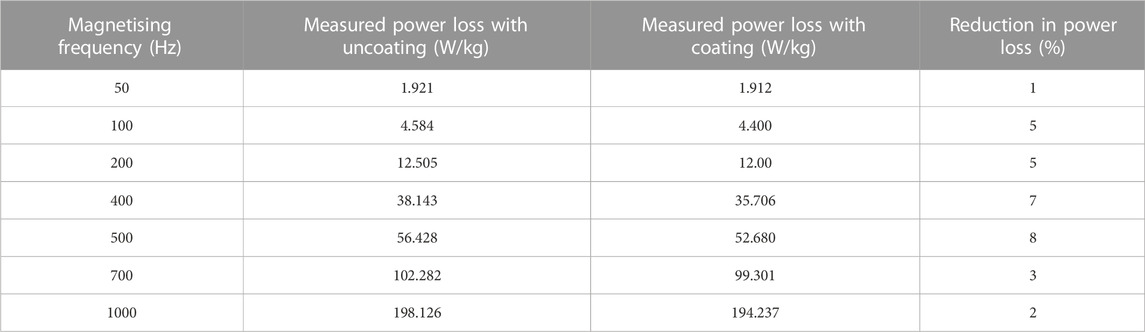
TABLE 9. Illustrates the percent decrease in power loss on uncoated and coated samples at various frequencies at 1.5 T.
Table 10 displays the percentage reduction in permeability for coated and uncoated specimens at various frequencies. In the case of the uncoated samples, it can be observed that permeability on the samples is visibly effected by increased frequencies from 100 to 700 Hz, while reducing in the case of the coated samples, which achieve higher magnetic permeability at 1 KHz with coating and the highest percent decrease in permeability at 50 Hz with coating at a peak flux density of 1.5 T. The diffusion of manganese (IV) oxide reduces magnetic permeability at the same value of flux density. By the diffusion of MnO2 into the Si-Fe strips, the texture of the material has been affected leading to a higher anisotropic coefficient, which was noticed when the relative permeability of the coating material has been reduced.
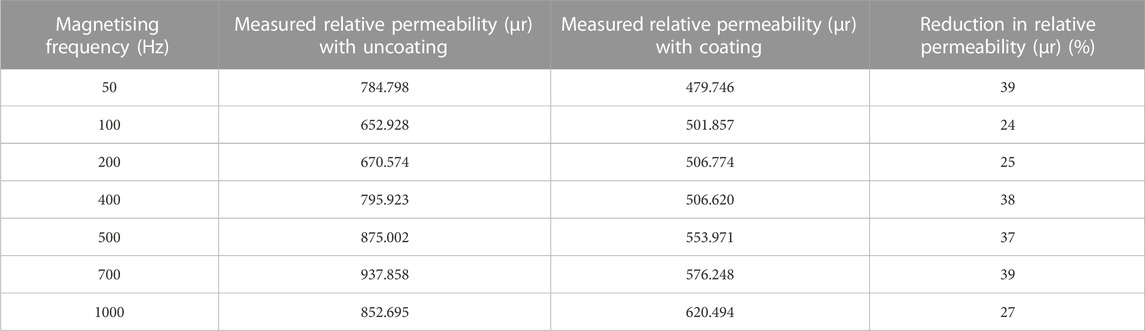
TABLE 10. Illustrates the percent decrease in permeability for coated and uncoated specimens at various frequencies at 1.5 T.
3.5 Magnetic properties
The hysteresis loop of coated and uncoated samples is shown in Figure 11. The diffusion and distribution of manganese are reflected by the size of the hysteresis loop, which is proportional to the amount of material stored in the samples. The hysteresis-loop area for coated is larger and has highest saturation flux density than the raw material. AC core losses were calculated at a frequency of 500 Hz, and steel strips were magnetised to saturation. At saturation, the 500 Hz flux density approaches 1.5 T based on the magnetising current frequency. At low frequencies, the lowest core loss is measured at 525°C, and the core loss increases gradually with increasing annealing temperature; at high frequencies, the minimum core loss is observed at 800°C, and it decreases gradually with increasing annealing temperature. Consequently, a 500 Hz and 1.5 T hysteresis loop was used to investigate the magnetic properties.
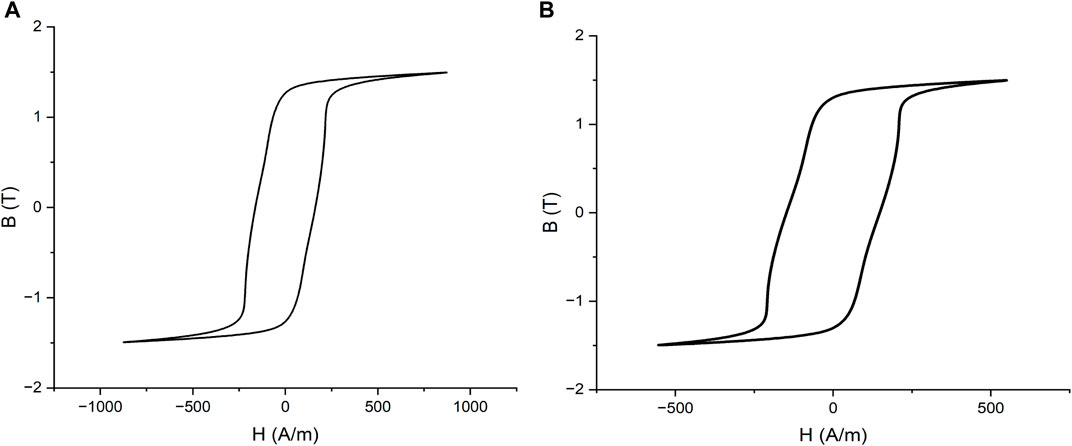
FIGURE 11. The hysteresis loop at 500 Hz and 1.5 T (A) Uncoated sample, (B) coated sample.
4 Conclusion
In this paper, a new material Manganese (IV) oxide as a paste has been proposed to increase the resistivity of Si-Fe for the sake of reducing power losses. Manganese has been demonstrated to diffuse into steel from a paste consisting of the relevant element in powder form diluted silicone oil solution. With the addition of manganese, the power loss of non-oriented 2.4 wt% silicon iron was reduced by up to 8% at 1.5 T. The reason for the reduction appears to be a straightforward resistivity increase. In case of silicon diffusion, the degree of improvement was often silicon content at the surface. This layer was probably in effect virtually nonmagnetic and therefore brought about a reduction in saturation magnetization of the whole steel. The thickness of this layer was believed to be related to the relative rates of diffusion of manganese through the paste and metal and in consequence was dependent strongly on the composition of the paste. When applied to different temperature non-oriented steel material, the results obtained from three pasted samples were considerably different, power loss reduction be achieved using manganese. The best results obtained were reduction of up to 9% at 1.5 T. Annealing achieved at 525°C, 700°C and 800°C, power loss measurement before and after annealing are performed as shown, comparisons of power losses after annealing at different temperatures, 700 C annealing sample-open annealed at 525°C for 1 h are presented in this paper.
Data availability statement
The original contributions presented in the study are included in the article/Supplementary Material, further inquiries can be directed to the corresponding author.
Author contributions
All authors listed have made a substantial, direct, and intellectual contribution to the work and approved it for publication.
Funding
This paper is part of the PhD study of the corresponding author, EE, who is sponsored by the Ministry of Higher Education and Scientific Research in Libya.
Acknowledgments
The authors would like to thank Cardiff University/School of Engineering for accepting to pay the APC towards publishing this paper.
Conflict of interest
The authors declare that the research was conducted in the absence of any commercial or financial relationships that could be construed as a potential conflict of interest.
Publisher’s note
All claims expressed in this article are solely those of the authors and do not necessarily represent those of their affiliated organizations, or those of the publisher, the editors and the reviewers. Any product that may be evaluated in this article, or claim that may be made by its manufacturer, is not guaranteed or endorsed by the publisher.
References
Anayi, F., Moses, A. J., and Jenkins, K. (2003). Effect of aluminium diffusion into electrical steel on power loss under flux distortion conditions. J. Magn. Magn. Mat. 254 (255), 36–38. doi:10.1016/S0304-8853(02)00744-8
Barros, J., Schneider, J., Verbeken, K., and Houbaert, Y. (2008). On the correlation between microstructure and magnetic losses in electrical steel. J. Magn. Magn. Mat. 320 (20), 2490–2493. doi:10.1016/j.jmmm.2008.04.056
Bertotti, G. (1987). General properties of power losses in soft ferromagnetic materials. IEEE Trans. Magn. 24 (1), 621–630. doi:10.1109/20.43994
Boon, C. R., and Robey, J. A. (1958). Effect of domain-wall motion on power loss in grain-oriented silicon-iron sheet. Proc. Inst. Electr. Eng. 105 (8), 1535–1540. doi:10.1049/piee.1968.0271
Chen, Y., and Pillay, P. (2002). An improved formula for lamination core loss calculations in machines operating with high frequency and high flux density excitation. Conf. Rec. - IAS Annu. Meet. (IEEE Ind. Appl. Soc. 2, 759–766. doi:10.1109/IAS.2002.1042645
Chiang, C. C., Knight, A. M., Hsieh, M. F., Tsai, M. G., Liu, B. H., Chen, I. G., et al. (2014). Effects of annealing on magnetic properties of electrical steel and performances of SRM after punching. IEEE Trans. Magn. 50 (11), 1–4. doi:10.1109/TMAG.2014.2329708
Cogent Power (2008). Typical data for SURA ® M250-35A datasheet. Available at: https://www.tatasteeleurope.com/sites/default/files/m250-35a.pdf.
Cogent Power, “Typical data for SURA ® M330-35A,” p. 1, 2009. Available at: https://perso.uclouvain.be/ernest.matagne/ELEC2311/T2006/NOFP.pdf.
Cullity, B. D., and Graham, C. D. (2009). Introduction to magnetic magnetic materials. Second Edition. New Jersey, USA: IEEE Pres&Wiley, 322.
Godec, M., Jenko, M., Grabke, H. J., and Mast, R. (1999). Sn segregation and its influence on electrical steel texture development. ISIJ Int. 39 (7), 742–746. doi:10.2355/isijinternational.39.742
Heo, N. H. (2004). Sulfur segregation and intergranular fracture in α-iron. Scr. Mat. 51 (4), 339–342. doi:10.1016/j.scriptamat.2004.03.037
Ibrahim, M., and Pillay, P. (2012). Advanced testing and modeling of magnetic materials including a new method of core loss separation for electrical machines. IEEE Trans. Ind. Appl. 48 (5), 1507–1515. doi:10.1109/TIA.2012.2210012
Instruments, National, “DAQ NI 6115/6120 user manual multifunction I/O devices for PCI/PXI/compactPCI bus computers,” no. 322812. 2002. Available at: https://neurophysics.ucsd.edu/Manuals/National%20Instruments/NI%206115_6120%20Manual.pdf.
Ionel, D. M., Popescu, M., Dellinger, S. J., Miller, T. J. E., Heideman, R. J., and McGilp, M. I. (2006). On the variation with flux and frequency of the core loss coefficients in electrical machines. IEEE Trans. Ind. Appl. 42 (3), 658–667. doi:10.1109/TIA.2006.872941
Jakubovics, J. P. (1979). “Magnetism and metallurgy of soft magnetic materials,”. Editor C.-W. Chen, 35, 345. doi:10.1107/s0567739479000784Acta Crystallogr. Sect. A2
Kadyrzhanov, K. K., Rusakov, V. S., Fadeev, M. S., Kiseleva, T. Y., Kozlovskiy, A. L., Kenzhina, I. E., et al. (2019). Study of magnetic properties of Fe100-xNix nanostructures using the Mössbauer spectroscopy method. Nanomaterials 9 (5), 757. doi:10.3390/nano9050757
Ko, W. S., Park, J. Y., Byun, J. Y., Lee, J. K., Kim, N. J., and Lee, B. J. (2013). Manipulation of surface energy anisotropy in iron using surface segregation of phosphorus: An atomistic simulation. Scr. Mat. 68 (5), 329–332. doi:10.1016/j.scriptamat.2012.11.005
Kozlovskiy, A., Kenzhina, I., and Zdorovets, M. (2019). Synthesis, phase composition and magnetic properties of double perovskites of A(FeM)O 4-x type (A=Ce; M=Ti). Ceram. Int. 45 (7), 8669–8676. doi:10.1016/j.ceramint.2019.01.187
Landgraf, F. J. G., and Emura, M. (2002). Losses and permeability improvement by stress relieving fully processed electrical steels with previous small deformations. J. Magn. Magn. Mat. 242, 152–156. doi:10.1016/S0304-8853(01)01184-2
Leuning, N., Steentjes, S., Stocker, A., Kawalla, R., Wei, X., Dierdorf, J., et al. (2018). Impact of the interaction of material production and mechanical processing on the magnetic properties of non-oriented electrical steel. AIP Adv. 8 (4), 047601. doi:10.1063/1.4994143
Liao, K. C. (1986). The effect of manganese and sulfur contents on the magnetic properties of cold rolled lamination steels. Metall. Trans. A 17 (8), 1259–1266. doi:10.1007/BF02650106
Liu, H. T., Liu, L. H., Wang, H., Liu, Y., Gao, F., An, L. Z., et al. (2016). Effects of initial microstructure and texture on microstructure, texture evolution and magnetic properties of non-oriented electrical steel. J. Magn. Magn. Mat. 406, 149–158. doi:10.1016/j.jmmm.2016.01.018
Mayergoyz, I., and Serpico, C. (1999). Nonlinear diffusion of electromagnetic fields and excess eddy current losses. J. Appl. Phys. 85 (8 II A), 4910–4912. doi:10.1063/1.369139
Moses, A. J. (1990). Electrical steels. Past, present and future developments. IEE Proc. A Phys. Sci. Meas. Instrum. Manag. Educ. Rev. 137 (5), 233–245. doi:10.1049/ip-a-2.1990.0039
Moses, A. J. (2012). Energy efficient electrical steels: Magnetic performance prediction and optimization. Scr. Mat. 67 (6), 560–565. doi:10.1016/j.scriptamat.2012.02.027
Moses, A. J., and Thursby, G. J. (1983). Assessment of a novel method of improving the characteristics of electrical steels by a surface diffusion technique. J. Mat. Sci. 18 (6), 1650–1656. doi:10.1007/BF00542059
Mthombeni, T. L., and Pillay, P. (2006). Physical basis for the variation of lamination core loss coefficients as a function of frequency and flux density. IECON Proc. Ind. Electron. Conf. 4, 1381–1387. doi:10.1109/IECON.2006.347545
Mənescu, V., Pəltânea, G., and Gavrilə, H. (2016). Hysteresis model and statistical interpretation of energy losses in non-oriented steels. Phys. B Condens. Matter 486, 12–16. doi:10.1016/j.physb.2015.09.004
Nakayama, T., Honjou, N., Nagai, A., and Yashiki, H. (1996). Non-oriented electrical steel sheets. Sumitomo Met. 48 (3), 39–44.
Paolinelli, S. C., and da Cunha, M. A. (2006). Effect of stress relief annealing temperature and atmosphere on the magnetic properties of silicon steel. J. Magn. Magn. Mat. 304 (2), 599–601. doi:10.1016/j.jmmm.2006.02.187
Rastogi, P. K. (1977). Effect of manganese and sulfur on the texture and magnetic properties of non-oriented steel. IEEE Trans. Magn. 13 (5), 1448–1450. doi:10.1109/TMAG.1977.1059560
Schulte, M., Steentjes, S., Leuning, N., Bleck, W., and Hameyer, K. (2018). Effect of manganese in high silicon alloyed non-oriented electrical steel sheets. J. Magn. Magn. Mat. 477, 372–381. doi:10.1016/j.jmmm.2018.07.025
Silveyra, J. M., Ferrara, E., Huber, D. L., and Monson, T. C. (2018). Soft magnetic materials for a sustainable and electrified world. Sci. (80) 362, eaao0195–6413. doi:10.1126/science.aao0195
Somkun, S. 2010, Magnetostriction and magnetic anisotropy in non-oriented electrical steels and stator core laminations. United Kingdom: Cardiff University.
S. Standard, “Magnetic materials - Part 2: Methods of measurement of the magnetic properties of electrical steel sheet and strip by means of an Epstain frame,” , no. IEC 60404-2. pp. , 1996. Available at: https://standards.iteh.ai/catalog/standards/clc/22886d1a-e6da-428d-9a19-bcfdcf78ccb8/en-60404-2-1998.
S. Standard, “Magnetic materials Methods of measurement of the magnetic properties of,” vol. 1, no. pp. 2–5, 1992.
Tanaka, I., and Yashiki, H. (2007). Magnetic properties and recrystallization texture evolutions of phosphorus-bearing non-oriented electrical steel sheets. ISIJ Int. 47 (11), 1666–1671. doi:10.2355/isijinternational.47.1666
Keywords: diffusion technique, energy-dispersive spectroscopy (EDS), Single Strip Tester (SST), power losses, different temperatures
Citation: Elgamli E, Anayi F and Shouran M (2023) Impact of manganese diffusion into non-oriented electrical steel on power loss and permeability at different temperatures. Front. Mater. 9:1108308. doi: 10.3389/fmats.2022.1108308
Received: 25 November 2022; Accepted: 21 December 2022;
Published: 10 January 2023.
Edited by:
Fuyin Ma, Xi’an Jiaotong University, ChinaReviewed by:
Xudong Fan, Nanjing University of Science and Technology, ChinaTadeusz Szumiata, Kazimierz Pułaski University of Technology and Humanities in Radom, Poland
Copyright © 2023 Elgamli, Anayi and Shouran. This is an open-access article distributed under the terms of the Creative Commons Attribution License (CC BY). The use, distribution or reproduction in other forums is permitted, provided the original author(s) and the copyright owner(s) are credited and that the original publication in this journal is cited, in accordance with accepted academic practice. No use, distribution or reproduction is permitted which does not comply with these terms.
*Correspondence: Elmazeg Elgamli, ZWxnYW1saWVzQGNhcmRpZmYuYWMudWs=