 Kenichiro Eguchi
 Timothy L. Burnett
 Dirk L. Engelberg
- 1Tubular Products and Casting Research Department, Steel Research Laboratory, JFE Steel Corporation, Tokyo, Japan
- 2NXCT, Department of Materials, The University of Manchester, Manchester, United Kingdom
- 3Department of Materials, Materials Performance Centre, Corrosion and Protection Centre, The University of Manchester, Manchester, United Kingdom
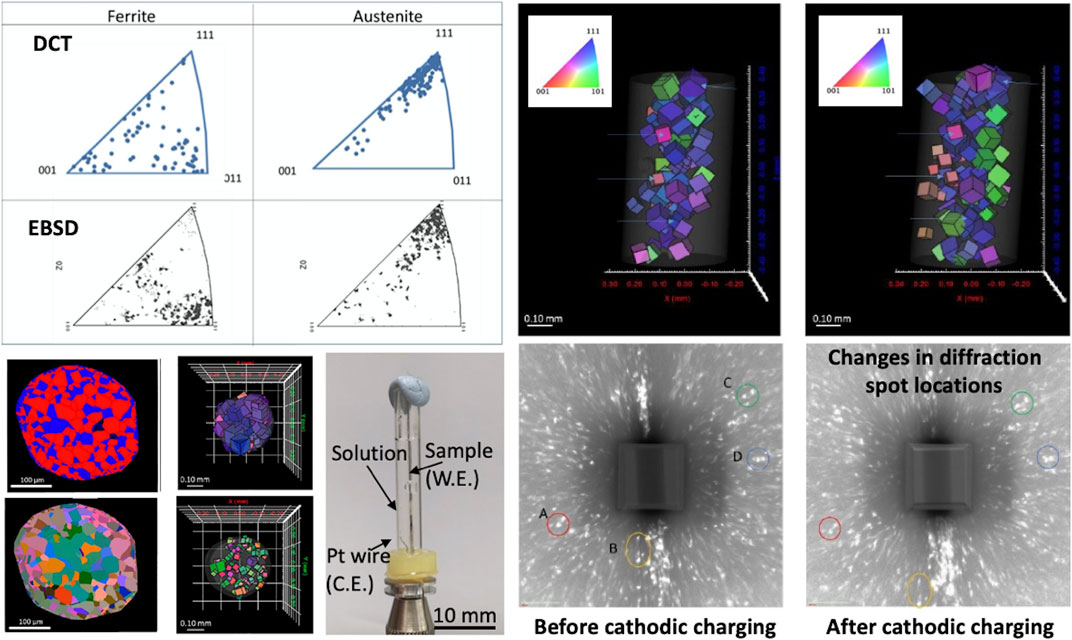
Laboratory-based diffraction contrast tomography (DCT) was applied to heat-treated lean duplex stainless steel (DSS) to observe microstructural changes by hydrogen infusion treatment. The feasibility of the DCT technique for the in situ assessment of a dual-phase material with exposure to aqueous solution was investigated, with DCT observations carried out before and after cathodic hydrogen charging. The movement of diffraction spots was observed after charging for 7 days, which cannot be explained by sample lateral movements. An experimental method to apply the DCT techniques for investigating the hydrogen–microstructure interaction is introduced here, but a more accurate experimental methodology is required to verify that the movement of diffraction spot derives from lattice parameter changes.
Introduction
In recent years, X-ray diffraction contrast tomography (DCT) techniques have been developed to allow mapping of crystal orientation in three dimensions (3D) (Johnson et al., 2008; Ludwig et al., 2009a; Ludwig et al., 2009b; Ludwig et al., 2010; Reischig et al., 2013; McDonald et al., 2015). The technique is for most parts using monochromatic X-ray beams of very high flux, typically found at synchrotron radiation sources. DCT uses a similar setup as the more conventional X-ray computed tomography (CT), with the key difference of a larger detector screen for in parallel obtaining diffraction data. These are then used to augment attenuation contrast information from X-ray CT. The sample is placed between X-ray source and detector and rotated around the vertical axis during the scan, with a series of diffraction spots gathered as a function of rotation angle. Three-dimensional grain orientation information is then reconstructed from the diffraction data by various methodologies (King et al., 2013; Ludwig et al., 2014; McDonald et al., 2015).
Because DCT enables to obtain non-destructive 3D grain information, most studies so far have focused on the observation of grain growth (Zhang et al., 2018), characterization of fatigue damage (King et al., 2011), and stress corrosion cracking (Ludwig et al., 2014). Grain growth of a 3D crystal has been observed by a series of DCT scans as a function of time, confirming that the observed grain growth in pure iron agreed well with a 3D grain growth model (MacPherson and Srolovitz, 2007). For observing damage evolution, samples have been scanned with DCT before and after exposure to environments or the application of stress/strain, with the development of damage observed, in situ. The observed damage was then correlated to 3D microstructure information, providing novel insight into real material behavior; especially, in operando or in situ testing equipment is typically interfaced with X-ray CT/DCT instruments to conduct these tests.
King et al. studied the interaction between intergranular stress corrosion cracking and microstructure for a sensitized austenitic stainless steel wire and heat-treated to produce a fully recrystallized microstructure with a mean grain size of ∼50 μm (King et al., 2008). They found several sensitization-resistant crack-bridging boundaries, and although the boundaries had special geometric characters, they were not all related to twin variant boundaries that are usually maximized during grain boundary engineering.
First attempts of laboratory DCT (LabDCT) observation were also made (King et al., 2013), with the overarching idea to improve accessibility to equipment. A large grained metastable β-titanium alloy was used, comparing grain shape and grain boundaries facilitated by phase contrast tomography. More recently, McDonald et al. applied laboratory-based X-ray DCT using a Laue focusing approach, enabling mapping of grains and their crystallographic orientation in 3D within the bulk of polycrystalline materials (McDonald et al., 2015). They measured crystallographic orientation in 3D for a β-titanium alloy and confirmed that this technique has the minimum detectable grain size of approximately 40 μm, which was validated by comparison with the electron backscatter diffraction (EBSD) analysis of a cross section of grains in the sample. The limitation of this technique is that the grain shape is not accessible. McDonald et al. also reported a fundamental study coupling the crystallographic imaging capability of LabDCT with conventional CT in a time-lapse study for the sintering of a copper powder sample at 1,050°C (Mcdonald et al., 2017). Although LabDCT was applied for single-phase material as mentioned above, there are no reports yet in the literature that the technique is able to distinguish more than a single phase.
For studying hydrogen embrittlement (HE) phenomena, X-ray diffraction techniques have generally been employed to quantitatively evaluate the local hydrogen uptake behavior in metals using collimated X-rays (Takakuwa et al., 2016; Örnek et al., 2020a; Örnek et al., 2020b). Takakuwa et al. (2016) presented that the shift of the diffraction angle in γ-Fe (2 2 0) is caused by a reactive stress against lattice expansion due to the presence of hydrogen in the lattice. Although they reported one-dimensional (1D) information about hydrogen concentration, if this approach can be applied for LabDCT, then 3D information of hydrogen distribution and the relationship with grain orientation could be expected to be analyzed. In duplex stainless steel (DSS), most studies revealed a distinct effect of hydrogen interacting with the austenite phase, resulting in an order of magnitude larger strain development compared to the ferrite phase (Örnek et al., 2020a; Örnek et al., 2020b). Örnek et al. (2020a) observed local strain change during cathodic charging by high-energy X-ray diffraction measurement in operando. They revealed that electrochemical hydrogen charging resulted in the formation of lattice tensile strain occurring more readily in austenite than ferrite grains and the tensile strains in the austenite was about double compared to the ferrite. The formation of a quasi-hydride has also been reported during operando observations (Örnek et al., 2020c).
The aim of this study is to explore and apply LabDCT techniques to characterize DSS microstructure response after hydrogen ingress. Application of the LabDCT system was first explored for setting up 3D observation and microstructure characterization of both phases present in DSS. Both phases have different character against hydrogen diffusivity and hydrogen solubility, and different response against hydrogen ingress is expected. Ferrite shows higher hydrogen diffusion coefficient and lower hydrogen storage capability, and austenite shows lower hydrogen diffusion coefficient and higher hydrogen storage capability. Here, we conducted LabDCT scans of a dual-phase material in an electrochemical cell, in situ.
Experimental Method
A grade 2202 lean DSS wire of 500 μm diameter was used in this study, with a composition of 22.5 wt% Cr, 0.12 wt% Mo, 2.7 wt% Ni, 1.32 wt% Mn, 0.02 wt% C, and 0.182 wt% N. The wire was cut into a length of 70 mm and heat-treated in a tube furnace at 1,200°C for 72 h to grow the grain size to achieve the minimum detectable grain size for DCT. A continuous flow of argon gas into the furnace was used to prevent formation of oxidization of the wire during the heat treatment. After the annealing treatment, all wires were cooled in air.
The surface of the wire was then ground from 240 to 1,200 grit to remove the thin oxidized layer that unavoidably formed despite the argon atmosphere. The material for DCT scan consists of 58% ferrite, 12% austenite, and 30% transformed martensite. Martensite was formed unintentionally, possibly due to the surface grinding process. Cr oxide particles were also observed throughout the sample. These microstructure changes derived from the applied heat treatment and the strain introduced by grinding the sample (Eguchi et al., 2021). The martensite phase exists both at the sample surface and center of the sample (Eguchi et al., 2021).
Cross-sectional EBSD observation was carried out to validate the DCT reconstructed data. The wire was embedded in an epoxy resin and then ground to 1,200 grit, followed by a colloidal silica finish. EBSD mapping was carried out with an Aztec EBSD system interfaced to a FEI Sirion scanning electron microscopy (SEM) at 15 kV. The step size was set at 0.39 μm. The surface of the wire was not ground before embedding in a resin, so strain-induced martensitic transformation is not expected for EBSD sample, unlike for the DCT sample (Eguchi et al., 2021).
Heat-treated wires were also used to evaluate hydrogen concentrations absorbed after cathodic hydrogen charging. After heat treating and grinding, all wires were first ultrasonically cleaned in acetone for 5 min to remove any contaminations on surface to avoid affecting the results. Cathodic charging was conducted in a glass beaker at 1 mA/cm2 in 0.001 M NaOH solution for durations of 24–235 h. NaOH was chosen to minimize damage to the sample surface, and cathodic charging was carried out at room temperature to simulate the experimental conditions for the DCT analysis. The hydrogen concentration was measured approximately 5 min after termination of cathodic charging, with an inert gas fusion method using an ELTRA OH 900 melt extraction analyzer with thermal conductivity sensor.
Two DCT investigations were carried out with heat-treated lean DSS wire. The first experiment (Experiment 1) was centered on comparing DCT microstructure data to cross-sectional EBSD assessment, with the aim to confirm that LabDCT can be applied to dual-phase materials. The second part (Experiment 2) then focused on in situ hydrogen charging experiments, with the wire cathodically charged and the microstructural response observed by DCT.
For Experiment 1, the purpose was to confirm if ferrite and austenite phase can be distinguished by DCT technique. The DCT measurements were conducted on a ZEISS Xradia 520 Versa instrument equipped with DCT detector combined with GrainMapper3D™ analysis software (McDonald et al., 2015). The sample was rotated and a two-dimensional (2D) diffraction pattern recorded at discrete rotation angles of 2°. A square aperture was placed to define the incident beam and avoid the overlap of the diffraction spots by reducing the number of diffraction spots. The direct X-ray beam was attenuated behind the sample to be able to collect high accuracy diffraction signals. The source–sample and sample–detector distances were both set to 16 mm, using the 1:1 distance ratio of the source and detector to benefit from the Laue focusing effect. This geometric magnification provided an effective pixel size of 1.69 μm. Accelerating voltage was set at 150 kV. For LabDCT measurements, two consecutive scans were performed. A total of 721 projections were acquired in one binning mode at ×4 optical magnifications, with an exposure time of 2.5 s for each projection for the absorption contrast scan. Then, 180 diffraction pattern images were acquired around a 360° rotation of the sample in steps of 2° with an exposure time per image of 180 s for the wire.
After the acquisition, the Xradia system was used to reconstruct the virtual slices by adjustment of center shift and beam hardening to obtain the best signal-to-noise ratio. The diffraction images were reconstructed and segmented by GrainMapper3D™ analysis software. This software only allows to select one phase for one reconstruction. Therefore, two separate phase reconstructions were carried out for ferrite and austenite phase. Only the grains with completeness (confident index for reconstruction;. Niverty et al., 2019) of a specific value or higher grains are displayed. A typical value of completeness criteria is 0.5.
For the second investigation, to be able to carry out in situ DCT experiment, a miniature electrochemical cell was first constructed, as shown in Figure 1A. The cell had dimensions of 30 mm in length, 3 mm in inner diameter, 5 mm in outer diameter, and holding a total volume of 0.2 ml and was made of plastic material. A Pt electrode was mounted at the bottom to enable in situ cathodic charging. The cell was first trialed to confirm that clear diffraction spots can be obtained when the sample is surrounded by an aqueous electrolyte (deionized water)]
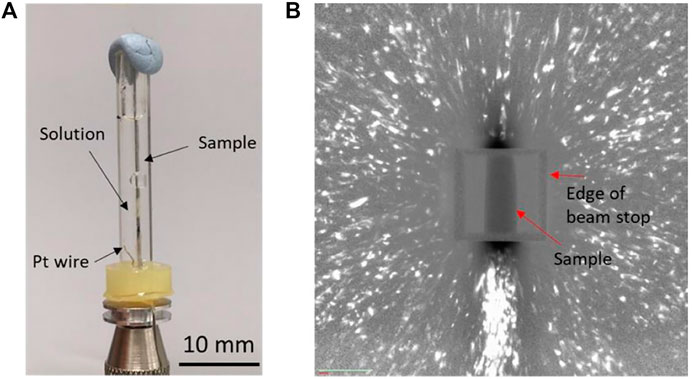
FIGURE 1. (A) Electrochemical cell for the in situ HE DCT study and (B) typical diffraction pattern of the Lean DSS wire sample.
To avoid errors introduced by sample position, a corrosion pit was first introduced into the heat-treated DSS wire via anodic polarization, to serve as a reference marker for in situ observation. The condition of the anodic polarization derives from our previous research (Eguchi et al., 2020). The anodic polarization was carried out in a beaker filled with 0.1 M HCl solution, using a scan rate of 1 mV/s until a total charge of 20 mC was reached. This was done by measuring OCP and then potentiostatic polarization with IVIUM potentiostat. The sample with pit was then removed from the beaker, dried in air, and then coated with stopping lacquer 45, leaving ca. 2.5 mm in length for exposure area. The in situ HE experiment was carried out with a heat-treated wire containing a corrosion pit. The size of the electrochemically introduced pit was 110 μm in height, 87 μm in width, and 32 μm in depth.
An in situ DCT scan (Experiment 2) was carried out before cathodic charging, to index all grains present in the material volume. Then, cathodic charging was conducted in the designed in situ cell with 1 mA/cm2 in 0.001 M NaOH solution for 24 h. The second DCT scan was then carried out, followed by another 144 h of cathodic charging. The third in situ DCT scan was carried out immediately after the cathodic charging was terminated.
For the first scan (before cathodic charging) and the third scan (after 7 days of cathodic charging), full DCT scan was carried out, whereas only four sets of diffraction spots with every 90° were obtained for the second scan. The acquisition time was set at 2.5 s for absorption contrast scan and 212 s for diffraction contrast scan to obtain the same X-ray intensity as Experiment 1. The setup provides a total of 12 h for the full scan. The other scan parameters were set to the same as in Experiment 1. No cathodic charging was performed during the DCT scan. As will be described later, because the hydrogen diffusion coefficient of the ferrite phase is high, most hydrogen may be effused after the DCT measurement. On the other hand, because the diffusion coefficient of the austenite phase is low, it is considered that the change in the amount of hydrogen after the DCT measurement for 12 h is small.
Results
DCT Microstructure Analysis of DSS
DCT data of the heat-treated DSS wire are shown in Figure 1B. The white spots correspond to diffraction spots, the dark rectangle corresponds to the sample, and the square surrounding the sample corresponds to beam stop. The size of the diffraction spots is proportional to grain size, and the brightness of the diffraction spots is proportional to grain volume in DCT (McDonald et al., 2015). Because a Laue focusing approach was employed, the information related to grain shape is not accessible in these scans. The signal-to-noise ratio of the diffraction image was quite low, and each spot was elongated radially from the center of the image compared to the ones reported in literature (McDonald et al., 2015). This difference suggests that the material used in this study had residual strain (Niverty et al., 2019), which was probably related to the sample grinding procedure during oxide scale removal.
Figure 2 provides the reconstructed 3D grain images showing orientation, centroid position, and size of grain for each phase. Only the grains with completeness of 0.5 or higher are displayed. The grain orientation is shown by Inverse Pole Figure (IPF) coloring of the cubes in longitudinal direction of the wire, and the size of the cube represents the size of the grains. For ferrite phase, the grain size is smaller than that of austenite phase, and it has more random orientation, whereas the austenite phase has more texture. The average grain size is 31 and 54 μm, respectively. The ferrite phases only exist at the center of the scanned area. This result possibly derives from diffraction spots at the upper and lower part the X-ray detector screen. Because the ferrite phase shows lower completeness than austenite, the upper and lower parts of the reconstructed ferrite phase were removed on the basis of data lying outside completeness criteria. The centroid positions of each grain were compared to each phase, and each individual grain was confirmed to be represented by either the ferrite or austenite structure, showing the first LabDCT analysis of a two-phase material. Further work is certainly required to understand the corrosion and embrittlement behavior of this microstructure.
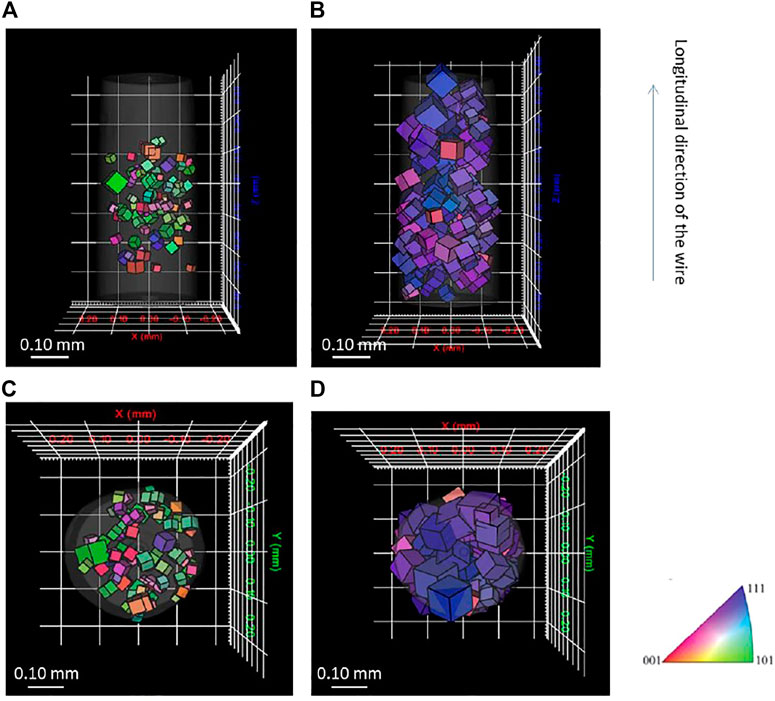
FIGURE 2. Three-dimensional grain orientation measured by laboratory DCT for (A) side view of ferrite phase, (B) side view of austenite phase, (C) top view of ferrite phase, and (D) top view of austenite phase.
Figure 3 compares cross-sectional EBSD images of the heat-treated sample using different grain and phase representation modes. The phase and IPF map reveal the dual-phase austenite and ferrite microstructure, with the abundancy of the different colors pointing toward the presence of textured grains. Most austenite grains are shown in blue, having an orientation of (111) along the longitudinal direction of the wire. Many ferrite grains are shown in green, indicating an (101) orientation. The corresponding LabDCT image is shown in Figure 2. Figure 4 gives IPF maps obtained from DCT measurement and compared with the maps obtained by EBSD. In the DCT measurement, each point corresponds to a grain orientation, whereas, in the EBSD IPF map, each point corresponds to a single pixel in 2D EBSD maps. These figures show that the distribution of grain orientation measured by DCT correlates reasonably well with the EBSD observations.
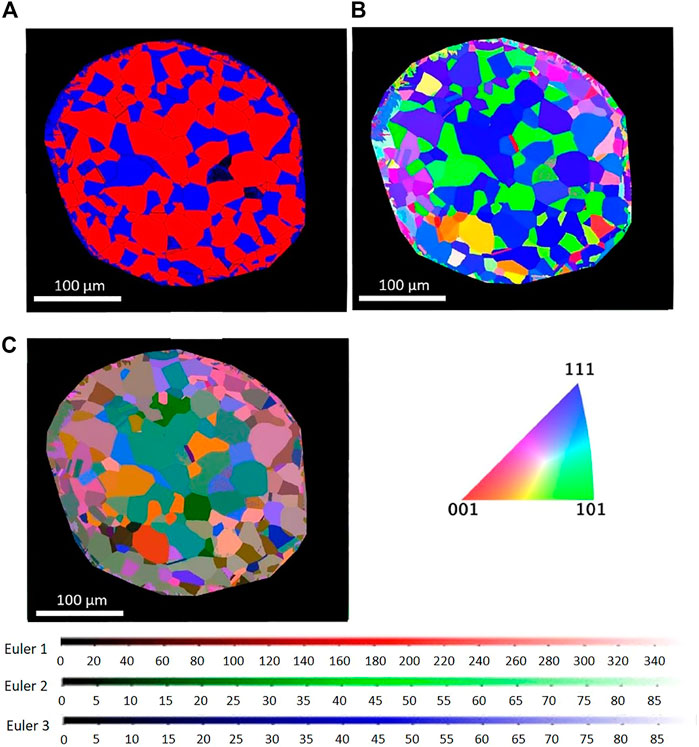
FIGURE 3. Cross-sectional EBSD image of (A) phase map (red, FCC; blue, BCC), (B) IPF map in longitudinal direction of wire, and (C) EBSD Euler color map.
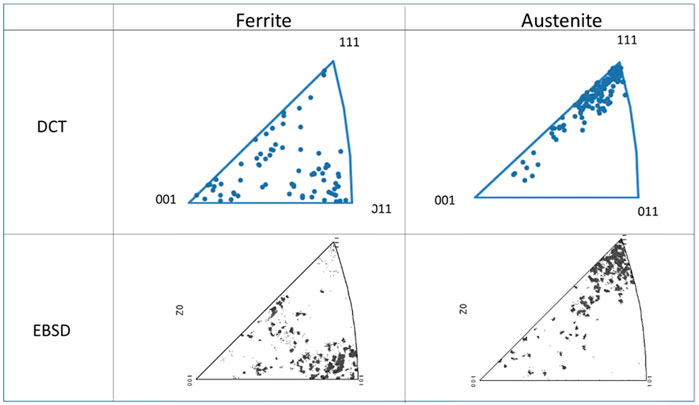
FIGURE 4. IPF maps obtained from DCT and EBSD measurements.
Figure 5 shows the distribution of grain size measured by DCT and EBSD. The result of DCT shows a lager grain size compared to the corresponding EBSD measurements. This difference most likely derives from the minimum detectable DCT grain size, which is larger than the by EBSD acquired grain size data. In Figure 5A, the minimum grain size detected by DCT was 24 μm; therefore, only the grain size measured by EBSD larger than 24 μm was shown in Figure 5C for comparison. The grain size shown in Figure 5C is still smaller than that of DCT measurement. This is possibly due to the difference of 3D volume and cross-sectioned 2D image. Assuming that the grains are the perfect spheres and cross-sectioned in 2D randomly, the grain size in 3D is going to be approximately 27% larger than that in 2D. The observed grain size for bcc in DCT was 24% greater than that in EBSD and 48% greater than for fcc, suggesting the difference in grain size can be mainly explained by the difference of 2D versus 3D. This analysis clearly shows that DCT can be applied for a dual-phase material to distinguish two phases.
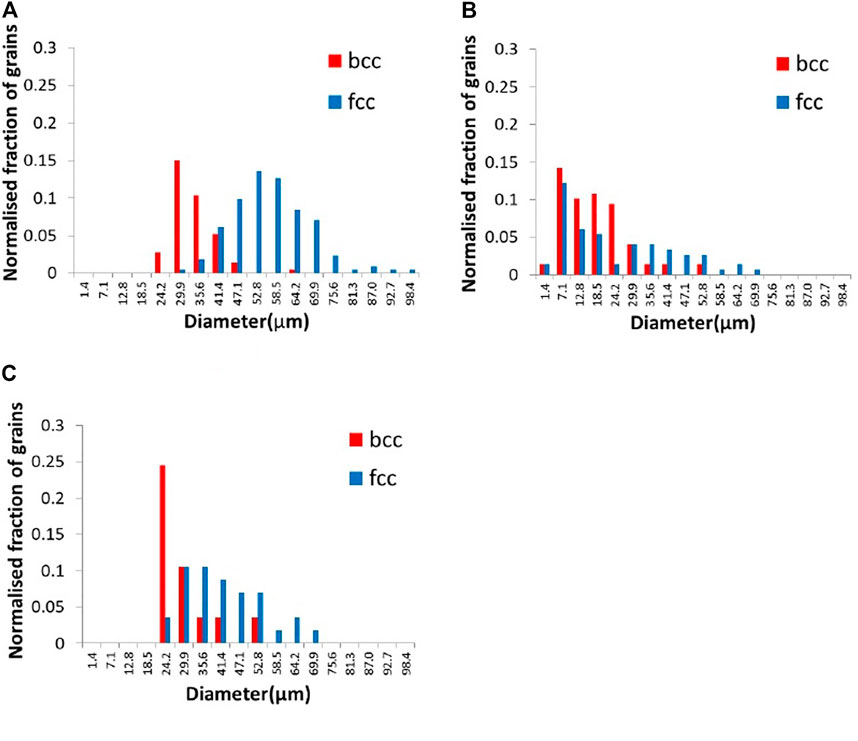
FIGURE 5. Histogram of grain size in diameter measured by (A) DCT, (B) EBSD, and (C) EBSD (over 24.2 μm of grain size only).
Development of In Situ DCT
For carrying out reference measurement of the lean DSS sample for subsequent hydrogen absorption studies, a wire sample was mounted in the in situ cell to confirm if diffraction spots are significantly affected by the cell filled with aqueous solution. The small size of the in situ DCT cell resulted in high attenuation of X-rays, with the X-ray source and the detector placed in close proximity. DI water was poured into the cell to confirm the effect of aqueous solution on the diffraction spot quality, with the acquisition time determined on the basis of the X-ray intensity of diffraction spots. Figure 6 shows the reconstructed 3D grains, indicating that DCT carried out with and without in situ cell gives similar results regarding the size and the orientation of grains. The average grain size of the austenite was in both scans 31–32 μm, with the ferrite giving an average of 29–31 μm, which is not the same sample with the ones shown in Figure 2.
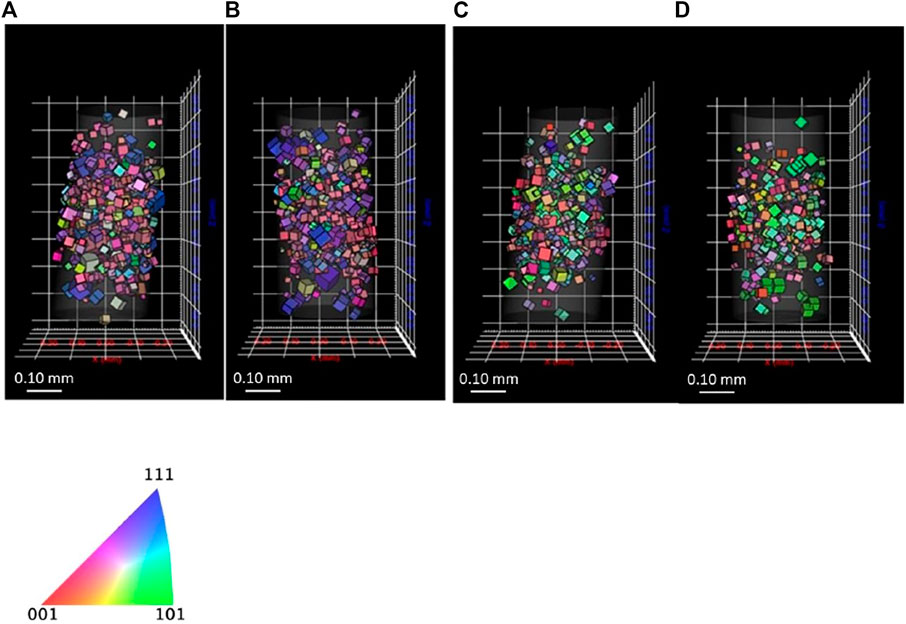
FIGURE 6. 3D reconstructed grains of (A) austenite without cell (B) austenite inside cell, (C) ferrite without cell, and (D) ferrite inside cell for lean DSS.
Figure 7 shows histogram of completeness of the sample. The frequency of both phases with lower completeness (0.60 or lower) decreased when the wire was inside the in situ cell. The diffraction spots were slightly affected by the cell attenuation, resulting in a lower completeness. Because grains with lower than 0.50 completeness are removed, the frequency of lower completeness grains decreased. This assessment shows that in situ DCT tests can be carried out, even if the sample is surrounded by a Perspex cell and water.
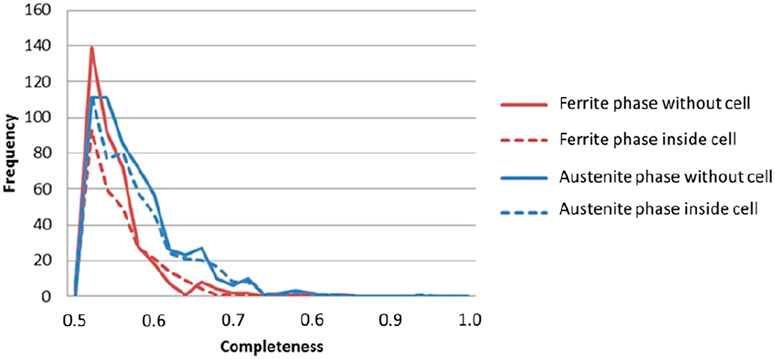
FIGURE 7. Histogram of completeness without cell and inside cell for lean DSS.
In Situ Hydrogen Embrittlement Investigation
Three sets of DCT scan were carried out, including a scan before cathodic charging, after 24 h of cathodic charging, and after 7 days of cathodic charging. Hydrogen concentration measurements of cathodically charged wires were carried out using an Eltra Hydrogen metal extraction analyzer. The hydrogen concentration of the as-received wire was assumed to be close to 0 without cathodic charging, with 32 wt. ppm measured after 1 day of cathodic charging, and with 66.3 wt. ppm after 9.8 days (235 h) of charging. Seven days of cathodic charging for the DCT sample resulted in 32–66 wt. ppm hydrogen.
It is well known that ferrite phase and austenite phase in DSS have different character with respect to hydrogen solubility and hydrogen diffusivity. Turnbull et al. reported hydrogen diffusion coefficients at 293 K of both ferrite and austenite in DSS of 6.0 × 10⁻¹² m2 s−1 and 3.3 × 10⁻¹⁶ m2s−1, respectively (Turnbull and Hutchings, 1994). The hydrogen distribution after cathodic charging in 1D was estimated by the following equation:
where Cx is hydrogen concentration at the distance of x, Cs is hydrogen concentration at the surface where hydrogen ingress, erf is error function, x is the distance from the surface, t is time, and D is effective hydrogen diffusion coefficient. Cs for ferrite phase and austenite phase were set as 1. More complicated calculation with finite element method is proposed to obtain accurate hydrogen distribution in DSS in literatures (Mente and Bollinghaus, 2012; Olden et al., 2014). However, in this study, a simple equation was adopted to obtain a general idea if ferrite and austenite phase are saturated with hydrogen.
The calculated hydrogen concentrations are shown in Figure 8. In this estimation, hydrogen is assumed to diffuse one direction, whereas hydrogen can penetrate from all the surface of the wire in the real situation. This assumption will provide underestimation of hydrogen concentration, especially at the center of the wire. In this context, for ferrite phase, the hydrogen is estimated to be saturated throughout the wire with lower concentration, whereas hydrogen in austenite phase is severely localized within 25 μm from the surface after 1 day cathodic charging and to a maximum depth of 50 μm after 7 days charging. From the above calculation, the hydrogen distribution during the DCT measurement in this study is estimated as follows. Hydrogen in the ferrite phase is saturated by hydrogen charging for 7 days. Although the diffusion coefficient of the austenite phase is small, hydrogen diffuses through the ferrite phase, so it is considered that hydrogen is also dissolved in both the austenite phase existing in the center of the specimen and the surface of the grains.
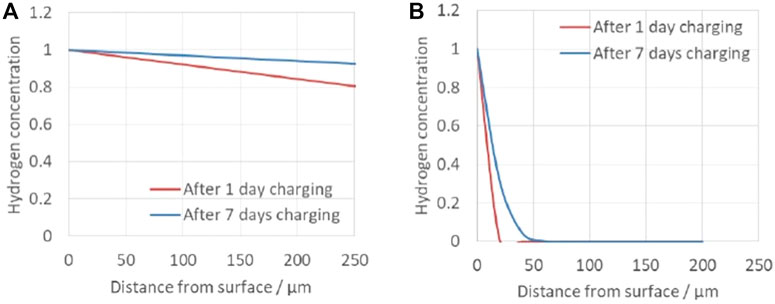
FIGURE 8. Calculated hydrogen concentration distribution (A) in ferrite phase and (B) in austenite phase.
On the other hand, during the DCT measurement (12 h), no cathodic hydrogen charging was performed, and it is expected that hydrogen effuses during this time. Because the ferrite has faster hydrogen diffusion most hydrogen would have been effused here. In contrast, the austenite phase has a lower diffusion coefficient, and hydrogen is considered to largely remain in this phase during the DCT measurement. Therefore, only the austenite phase is considered to contain hydrogen here during DCT scan.
Figure 9 shows the reconstructed volume of absorption tomography before and after 7 days charging. The pit reference marker can be seen at the side view and the virtual cross-sectional view. No difference was seen between before and after cathodic charging in the appearance of the wire (no cracks). Figure 10 shows the diffraction spots obtained from the same rotation angle before, after 1 day charging and after 7 days charging. Some spots are identical in the different scans as indicated by the circles. The relationship between the sample movement and the diffraction spots displacement was estimated. Spot A and B moved outward, whereas spot C moved inward after 7 days cathodic charging in Figure 10. Spot D did not move. These movement cannot be explained by sample movement alone.
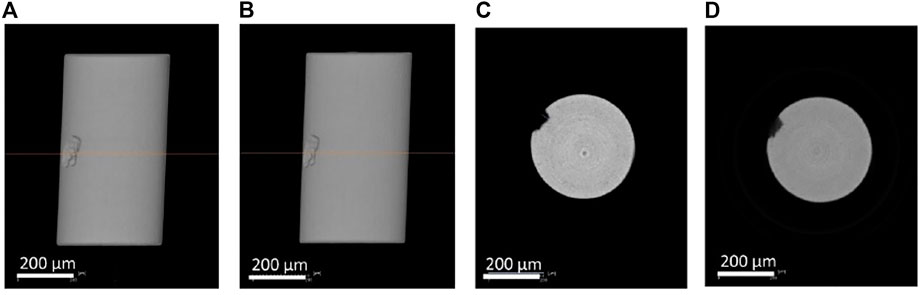
FIGURE 9. Reconstructed volume of absorption tomography (A) side view before charging, (B) side view after 7 days charging, (C) virtual cross section image before charging, and (D) virtual cross section image after 7 days charging.
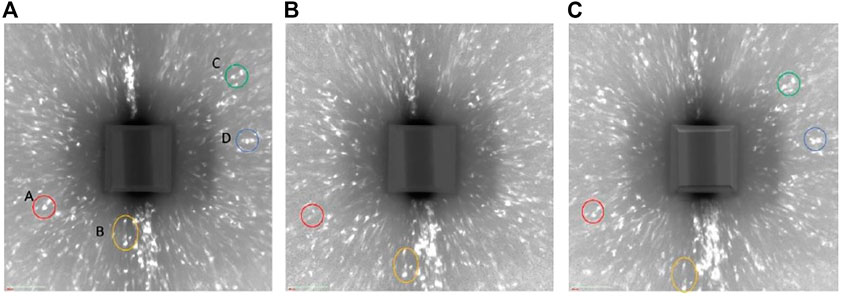
FIGURE 10. Comparison of diffraction spots with same rotation angle (A) before changing, (B) after 1 day charging, and (C) after 7 days charging.
Figures 11, 12 show the reconstructed grains for ferrite and austenite phases, respectively. Some grains are identical before and after cathodic charging as indicated by the blue arrows in both figures. Recent observations during in situ hydrogen charging of super DSS indicated the formation of a quasi-hydride and introduction of strain predominantly into the austenite phase. This would, here in our DCT scans, possibly result in a reduced number of reconstructed grains, due to grains not passing the completeness criteria due to movement or splitting of diffraction spots (Örnek et al., 2020a; Örnek et al., 2020c). Some changes in the overall distribution of reconstructed the grain distributions are apparent in both phases, with far larger changes observed in the austenite, supporting observations reported in literature (Örnek et al., 2020a; Örnek et al., 2020b).
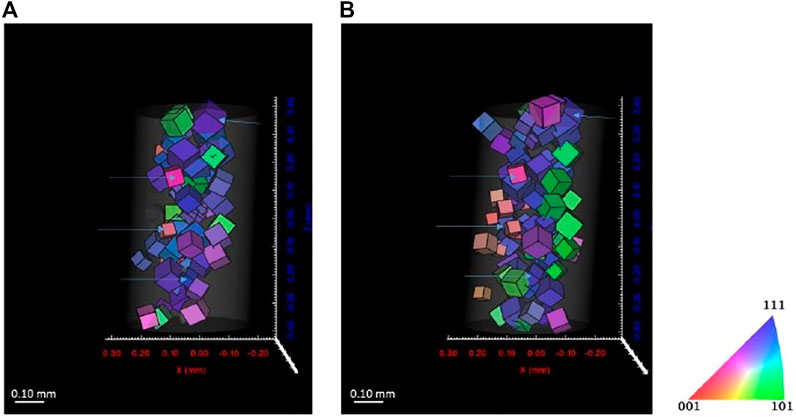
FIGURE 11. Reconstructed volume for austenite (A) before charging and (B) after 7 days charging. Threshold completeness >0.6.
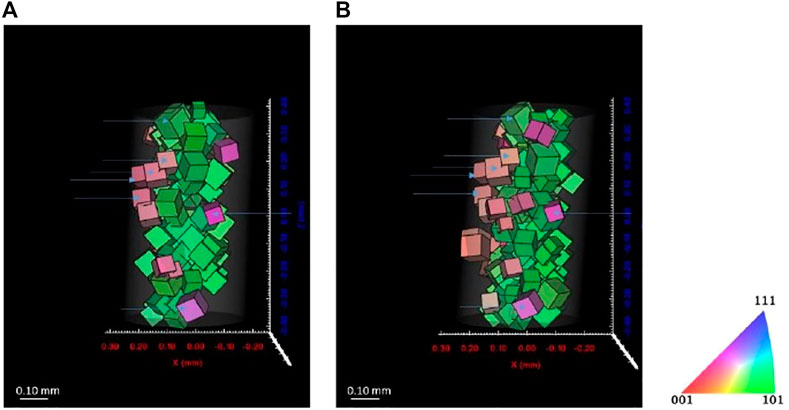
FIGURE 12. Reconstructed volume for ferrite (A) before charging and (B) after 7 days charging. Threshold completeness >0.7.
Limitations of DCT
In this study, the same diffraction spots were detected before and after hydrogen charging, and multiple identical crystal grains were confirmed after reconstruction. It has been reported that strain induced by hydrogen ingress is lower than 0.003 (Takakuwa et al., 2016). It will be difficult to detect such small change with the DCT setup used in this study. For simplicity, assuming that the incident X-rays are collimated monochromatic light, the strain introduced by hydrogen ingress is expected to correspond to a 3-μm displacement of the diffraction spot on the detector. This would correspond to two pixels in our setup.
In our study, we used pitting corrosion as a reference marker for the alignment of the sample, with the sample removed from the scanner during hydrogen charging. A more accurate sample alignment will be required to detect the expected minor changes in lattice parameter due to hydrogen ingress. For this purpose, for example, it will be necessary to keep the sample in the instrument even during hydrogen charging. In addition, the advantage of DCT to observe a large number of 3D grains at the same time will be lost, but the far-field method using parallel X-rays will provide a more accurate observation. A study reported in a literature indicates that a change of mismatch of 10−5 orders in Ni-based alloy during creep test is detectable as a change of several diffraction spots (Tréhorel et al., 2018). To apply the far-field method, a strong parallel X-ray source is required, and a synchrotron will be suitable rather than a laboratory instrument. If DCT and the far-field method can be combined with synchrotron X-ray instrument, then it may be possible to observe small changes in the crystal structure of multiple crystal grains in situ. Although there are some limitations, our study revealed that LabDCT is applicable for a dual-phase material in a plastic cell filled with electrolyte for the first time.
Conclusion
LabDCT was applied to obtain a better understanding of HE in heat-treated lean DSS, resulting in the following key achievements:
• The grain orientation for a dual-phase lean DSS was successfully obtained by LabDCT with the results cross-correlated to EBSD analysis.
• An in situ electrochemical cell setup has been designed and developed, enabling the DCT analysis of degradation and corrosion events involving aqueous environments.
• The movement of DCT diffraction spots was observed after hydrogen charging.
• More accurate methodology is required to verify if the movement of diffraction spots derives from changes of lattice parameter by hydrogen ingress.
Data Availability Statement
The raw data supporting the conclusions of this article will be made available by the authors, without undue reservation.
Author Contributions
All authors contributed to conception and design of the study. KE performed the experiment and the analysis. KE wrote the first draft of the manuscript. DE and TB contributed to manuscript revision, read, and approved the submitted version.
Funding
The experimental facilities in the Henry Royce Institute for Advanced Materials established through EPSRC funding for Henry Moseley X-ray Imaging Facility under grant nos. EP/M010619, EP/K004530, EP/F007906, EP/F001452, EP/I02249X, and EP/F028431 are acknowledged in addition to HEFCE funding through the UK Research Partnership Investment Funding (UKRPIF) Manchester RPIF Round 2 for the Multiscale Characterization Facility.
Conflict of Interest
Author KE is employed by the company JFE Steel Corporation. All experimental work reported in this manuscript was carried out at The University of Manchester in the framework of KE’s PhD project. The PhD project was funded by JFE steel.
The remaining authors declare that the research was conducted in the absence of any commercial or financial relationships that could be construed as a potential conflict of interest.
Publisher’s Note
All claims expressed in this article are solely those of the authors and do not necessarily represent those of their affiliated organizations or those of the publisher, the editors, and the reviewers. Any product that may be evaluated in this article, or claim that may be made by its manufacturer, is not guaranteed or endorsed by the publisher.
References
Eguchi, K., Burnett, T. L., and Engelberg, D. L. (2020). X-Ray Tomographic Characterisation of Pitting Corrosion in Lean Duplex Stainless Steel. Corros. Sci. 165, 108406. doi:10.1016/j.corsci.2019.108406
Eguchi, K., Burnett, T. L., and Engelberg, D. L. (2021). X-ray Tomographic Observation of Environmental Assisted Cracking in Heat-Treated Lean Duplex Stainless Steel. Corrosion Sci. 184, 109363. doi:10.1016/j.corsci.2021.109363
Johnson, G., King, A., Honnicke, M. G., Marrow, J., and Ludwig, W. (2008). X-ray Diffraction Contrast Tomography: A Novel Technique for Three-Dimensional Grain Mapping of Polycrystals. II. The Combined Case. J. Appl. Cryst. 41, 310–318. doi:10.1107/s0021889808001726
King, A., Johnson, G., Engelberg, D., Ludwig, W., and Marrow, J. (2008). Observations of Intergranular Stress Corrosion Cracking in a Grain-Mapped Polycrystal. Science 321, 382–385. doi:10.1126/science.1156211
King, A., Ludwig, W., Herbig, M., Buffière, J.-Y., Khan, A. A., Stevens, N., et al. (2011). Three-Dimensional In Situ Observations of Short Fatigue Crack Growth in Magnesium. Acta Materialia 59, 6761–6771. doi:10.1016/j.actamat.2011.07.034
King, A., Reischig, P., Adrien, J., and Ludwig, W. (2013). First Laboratory X-ray Diffraction Contrast Tomography for Grain Mapping of Polycrystals. J. Appl. Cryst. 46, 1734–1740. doi:10.1107/s0021889813022553
Ludwig, W., King, A., Herbig, M., Reischig, P., Marrow, J., Babout, L., et al. (2010). Characterization of Polycrystalline Materials Using Synchrotron X-ray Imaging and Diffraction Techniques. JOM 62, 22–28. doi:10.1007/s11837-010-0176-6
Ludwig, W., King, A., Reischig, P., Herbig, M., Lauridsen, E. M., Schmidt, S., et al. (2009). New Opportunities for 3D Materials Science of Polycrystalline Materials at the Micrometre Lengthscale by Combined Use of X-ray Diffraction and X-ray Imaging. Mater. Sci. Eng. A 524, 69–76. doi:10.1016/j.msea.2009.04.009
Ludwig, W., King, A., and Reischig, P. (2014). “Three-Dimensional X-ray Diffraction (3DXRD) Imaging Techniques,” in Strain and Dislocation Gradients from Diffraction, Spatially-Resolved Local Structure and Defects. Editors R. Barabash, and G. Ice (London: Imperial college press), 280–321. doi:10.1142/9781908979636_0008
Ludwig, W., Reischig, P., King, A., Herbig, M., Lauridsen, E. M., Johnson, G., et al. (2009). Three-Dimensional Grain Mapping by X-ray Diffraction Contrast Tomography and the Use of Friedel Pairs in Diffraction Data Analysis. Rev. Scientific Instr. 80, 033905. doi:10.1063/1.3100200
MacPherson, R. D., and Srolovitz, D. J. (2007). The von Neumann Relation Generalized to Coarsening of Three-Dimensional Microstructures. Nature 446, 1053–1055. doi:10.1038/nature05745
Mcdonald, S. A., Holzner, C., Lauridsen, E. M., Reischig, P., Merkle, A. P., and Withers, P. J. (2017). Microstructural Evolution during Sintering of Copper Particles Studied by Laboratory Diffraction Contrast Tomography (LabDCT). Sci. Rep. 7, 5251. doi:10.1038/s41598-017-04742-1
McDonald, S. A., Reischig, P., Holzner, C., Lauridsen, E. M., Withers, P. J., Merkle, A. P., et al. (2015). Non-Destructive Mapping of Grain Orientations in 3D by Laboratory X-ray Microscopy. Sci. Rep. 5, 14665. doi:10.1038/srep14665
Mente, T., and Bollinghaus, T. (2012). Modeling of Hydrogen Distributionin A Duplex Stainless Steel. Weld World 56, 66–78. doi:10.1007/bf03321397
Niverty, S., Sun, J., Williams, J., Bachmann, F., Gueninchault, N., Lauridsen, E., et al. (2019). A Forward Modeling Approach to High-Reliability Grain Mapping by Laboratory Diffraction Contrast Tomography (LabDCT). JOM 71, 2695–2704. doi:10.1007/s11837-019-03538-0
Olden, V., Saai, A., Jemblie, L., and Johnsen, R. (2014). FE Simulation of Hydrogen Diffusion in Duplex Stainless Steel. Int. J. Hydrogen Energ. 39, 1156–1163. doi:10.1016/j.ijhydene.2013.10.101
Örnek, C., Larsson, A., Harlow, G. S., Zhang, F., Kroll, R., Carlà, F., et al. (2020). Time-Resolved Grazing-Incidence X-ray Diffraction Measurement to Understand the Effect of Hydrogen on Surface Strain Development in Super Duplex Stainless Steel. Scr. Mater. 187, 63–67. doi:10.1016/j.scriptamat.2020.05.061
Örnek, C., Larsson, A., S Harlow, G., Zhang, F., Kroll, R., Carlà, F., et al. (2020). Metastable Precursor Structures in Hydrogen-Infused Super Duplex Stainless Steel Microstructure – an Operando Diffraction Experiment. Corros. Sci. 176, 109021. doi:10.1016/j.corsci.2020.109021
Örnek, C., Müller, T., Kivisäkk, U., Zhang, F., Långberg, M., Lienert, U., et al. (2020). Operando Time- and Space-Resolved High-Energy X-ray Diffraction Measurement to Understand Hydrogen-Microstructure Interactions in Duplex Stainless Steel. Corros. Sci. 175, 108899. doi:10.1016/j.corsci.2020.108899
Reischig, P., King, A., Nervo, L., Viganó, N., Guilhem, Y., Palenstijn, W. J., et al. (2013). Advances in X-ray Diffraction Contrast Tomography: Flexibility in the Setup Geometry and Application to Multiphase Materials. J. Appl. Cryst. 46, 297–311. doi:10.1107/s0021889813002604
Takakuwa, O., Fujisawa, T., and Soyama, H. (2016). Experimental Verification of the Hydrogen Concentration Around a Crack Tip Using Spot X-ray Diffraction. Int. J. Hydrogen Energ. 41, 23188–23195. doi:10.1016/j.ijhydene.2016.10.083
Tréhorel, R., Ribarik, G., Schenk, T., and Jacques, A. (2018). Real-Time Study of Transients during High-Temperature Creep of an Ni-Base Superalloy by Far-Field High-Energy Synchrotron X-ray Diffraction. J. Appl. Cryst. 51, 1274–1282. doi:10.1107/S1600576718010014
Turnbull, A., and Hutchings, R. B. (1994). Analysis of Hydrogen Atom Transport in a Two-Phase Alloy. Mater. Sci. Eng. A 177, 161–171. doi:10.1016/0921-5093(94)90488-x
Keywords: lean duplex stainless steel, diffraction contrast tomography, hydrogen embrittlement, X-ray computed tomography, cathodic charging
Citation: Eguchi K, Burnett TL and Engelberg DL (2022) X-Ray Diffraction Contrast Tomography for Probing Hydrogen Embrittlement in Heat-Treated Lean Duplex Stainless Steel. Front. Mater. 9:801198. doi: 10.3389/fmats.2022.801198
Received: 25 October 2021; Accepted: 11 January 2022;
Published: 21 March 2022.
Edited by:
VS. Raja, Indian Institute of Technology Bombay, IndiaReviewed by:
Hrishikesh Bale, Carl Zeiss Microscopy GmbH, GermanyTobias Mente, Federal Institute for Materials Research and Testing (BAM), Germany
Copyright © 2022 Eguchi, Burnett and Engelberg. This is an open-access article distributed under the terms of the Creative Commons Attribution License (CC BY). The use, distribution or reproduction in other forums is permitted, provided the original author(s) and the copyright owner(s) are credited and that the original publication in this journal is cited, in accordance with accepted academic practice. No use, distribution or reproduction is permitted which does not comply with these terms.
*Correspondence: Kenichiro Eguchi, a2UtZWd1Y2hpQGpmZS1zdGVlbC5jby5qcA==