 Xia Miao
 Nie Yimiao
 Liu Shuxian
 Wang Ling
 Wang Long
 Wang Sen
- School of Mining Engineering, North China University of Science and Technology, Tangshan, China
Preparation of mineral polymer materials with fly ash is one of the effective ways to realize the green and comprehensive utilization of fly ash. Using the sol-gel method mineral aggregate material precursor, swe tudied the different sources of silicon and aluminum, synthesis temperature, different Si/Al ratio, different dosages of ethanol, and other influence factors under the conditions of the synthesis, and the structure of the sample using the means of XRD, SEM, TG, IR on the synthesis of silica-alumina precursor sample performance and structure are analyzed. The results showed that the optimum preparation conditions were obtained when the Si/Al ratio was 10:1, the synthesis temperature was 70°C, and the sample was calcined at 850°C for 3 h with the highest synthesis rate of 81.33%. The Si-Al precursors prepared are amorphous—phase amorphous grid—space structures. The infrared analysis indicated that the synthesized sample had a Si-O-Si bond, but the absorption peak and characteristic peak were obviously different under the conditions of different synthesis temperatures, different Si/Al ratios, and different ethanol dosage. For example, at 806 cm−1 and 1,395 cm−1, they correspond to the absorption peak of Si-OH bending vibration and shear bending vibration and plane bending vibration of C-H without complete reaction respectively. SEM observation shows that the size of the synthesized Silicon aluminum precursors sample is small and the distribution is uniform. The in-depth study on the preparation process and reaction mechanism of mineral polymer precursorswill bring broad prospects for the application and development of mineral polymer precursors themselves.
Introduction
Fly ash is a particle discharged in the combustion process of pulverized coal. It has a large number of amorphous silicon and aluminum structures. It can depolymerize under the action of an alkaline activator and polymerize to form a kind of inorganic cementitious material/geopolymer under certain conditions. In the 1970s, French scholar Davidovits (1991) first proposed the concept of geopolymer. Geopolymer is a new type of green inorganic cementitious material, mainly composed of high silicon aluminum natural minerals, solid wastes, and artificial silicon and aluminum compounds through polymerization of inorganic polymer, the structure is mainly inorganic three-dimensional network cementitious (Tan and Rankin, 2006). In the study of the reaction mechanism of preparing mineral polymeric materials from fly ash, due to the different sources of various fly ash, their chemical composition and phase composition are quite different (Wu et al., 2016).
The precursor is the prototype sample of the target product (Patil Gouri et al., 2020), that is, the pre-stage product of the target product that can be realized after some steps. There are many synthetic methods of precursors, the common methods are chemical coprecipitation, solid-phase synthesis, sol-gel method, and so on. The sol-gel method, as a common preparation method of a precursor system, is to make uniform sol by fully mixing the corresponding chemical pure raw material solution, forming and drying the gel under certain temperature and conditions, and then calcination or sintering to get the required powder material (Zhu et al., 2020). There are many influencing factors in the process of synthesizing silicon-aluminum precursors, such as different raw materials, different silicon-aluminum ratios, PH value, synthesis temperature, calcination temperature, etc. The precursors of mineral polymeric materials are prepared under the influence of different factors, and the synthesized samples have different properties such as morphology and particle size, so their application is also very different.
At present, most of the existing studies (Duan et al., 2006; Liu and Zhang, 2018; Wan et al., 2008) focus on the preparation of fly ash-based, kaolin based, and slag-based polymer materials under chemical excitation conditions, while there are few studies on the precursors of synthetic mineral polymer materials. In this paper, the precursor of mineral polymer material is synthesized by the sol-gel method, and the influencing factors and the influencing rules of the synthesis of the precursor are clarified. On this basis, the precursor of mineral polymer material is prepared. XRD, TG, IR, and SEM test methods were used to study the valence bond structure in the process of synthesizing the precursor, in order to explore the changes in the existing state of silicon and aluminum before and after the synthesis of the precursor. With the optimization of the preparation process and reaction mechanism of the precursor system of mineral polymeric materials, the precise control and design of the preparation process will bring broad prospects for the application and development of the mineral polymer precursor itself.
Experiment
Experimental Materials
TEOS was used as silicon source material, aluminum chloride hexahydrate (AlCl3·6H2O) as aluminum source material, anhydrous ethanol (C₂H5OH), and distilled water as a solvent to prepare mineral polymer precursor.
Details of the main reagents and drugs required in the experiment are shown in Table 1.
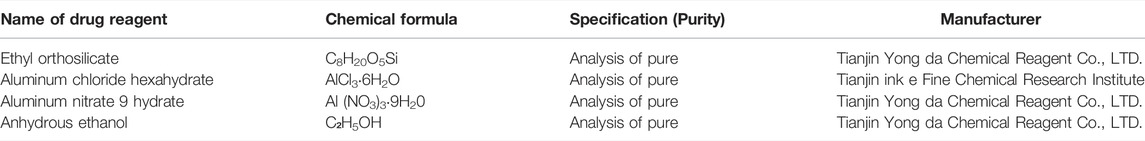
TABLE 1. Main chemical reagent.
The instruments used in the experiment are: electronic balance, magnetic mixer, electric blast dryer, HH-S type digital display constant temperature oil bath, electric furnace, Muffle furnace, X-ray diffractometer, infrared spectrum analyzer, scanning electron microscope, etc.
Preparation Process of Precursor System of Mineral Polymeric Materials
Figure 1 shows the basic technological process of preparing powder in this paper, which is mainly composed of synthesis, aging, drying, forging, and burning.
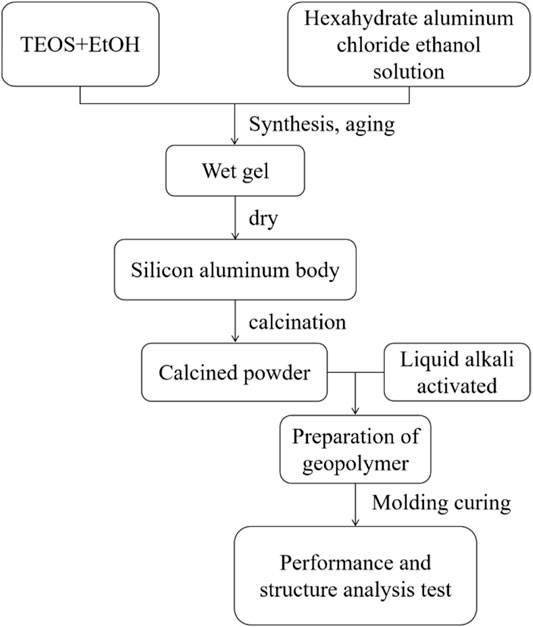
FIGURE 1. Process flow chart of preparation of mineral polymer precursor by sol-gel method.
Experimental Characterization Methods
X-ray diffractometer (XRD): The sample is ground to powder, then placed on the ground glass sheet, put into the X-ray diffractometer for crystal phase analysis of the sample. (Scanning Angle 2θ = 5°–75°, scanning speed 20°/min). The X-ray diffraction pattern of silicon aluminum precursor samples was determined. Jade Six software was used to process the diffraction pattern and analyze the crystal structure and mineral composition of the sample.
Scanning electron microscope (SEM): after spraying gold, it is put into a scanning electron microscope, and SEM is used to analyze the microscopic morphology of the sample.
Infrared spectrum analysis (IR): the sample and potassium bromide were added into a mortar at a mass ratio of 1:100 and ground into powder. The sample was pretreated by the KBr tablet method and finally put into Fourier transform infrared spectrometer for analysis, to analyze the surface group characteristics and group structure changes of the synthesized sample.
Synthetic rate of experiment and calculation: adding sample preparation by taking 3 g containing excessive ethanol (50 ml) solution in the beaker, the sample with ethanol solution mixing, filtering after dissolving a certain time, into the oven to dry after weighing, calculation before and after the dissolution of poor quality, the synthetic rate is after dissolving the sample and the percentage of the sample (3 g).
Factors Influencing the Synthesis Rate of Mineral Polymer Precursors
Taking the synthesis rate as the evaluation index, the influence factors and the influence rules of different aluminum sources, different synthesis temperatures, different Si/Al ratios, and different alcohol dosage on the synthesis of mineral polymer precursors were studied.
Influence of Different Aluminum Sources on the Synthesis Rate of Mineral Polymer Precursors
Due to the different structures of aluminum sources, the hydrolysis process and final hydrolysate, which are synthesized with different aluminum sources, are different. Common sources of aluminum are aluminum chloride hexahydrate and aluminum nitrate hexahydrate. Figure 2 shows the curves of synthesis rates of synthetic precursors under different aluminum source conditions.
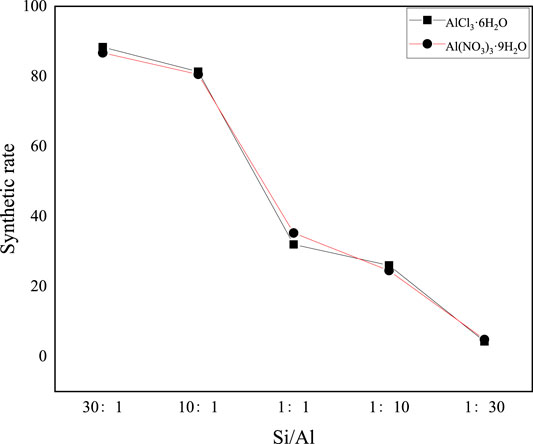
FIGURE 2. Curve of synthesis rate of synthetic precursors under different aluminum source conditions.
It can be seen from Figure 2 that the variation trend of the synthesis rate of the precursors of synthetic mineral polymeric materials with different aluminum sources is roughly the same, that is, the synthesis rate decreases greatly with the decrease of the Si/Al ratio. When the Si/Al ratio is greater than 10:1, the variation range of the synthesis rate tends to be gentle, floating in the range of 86–88%. When the Si/Al ratio is less than 10:1, the synthesis rate decreases significantly from 85 to 4.3%. Except for points 1:1 and 1:30, the synthesis rate of aluminum chloride hexahydrate as the precursor of aluminum source synthetic mineral polymeric material is higher than that of aluminum nitrate nine hydrate as the precursor of aluminum source synthetic mineral polymeric material under the same conditions.
Among them, in the preparation of mineral polymer material precursor, the mixture of two kinds of sol (aluminum sol and silicon sol) can catalyze the gelation process of sol. The amount of silica sol and the content of aluminum sol directly affect the physical properties of the gel (Zhang, 2014) and then affect the performance of the final product. It can be seen from Figure 2 that although aluminum sources are different, the variation trend of their synthesis rate does not change much, and both of them decrease with the decrease of the Si/Al ratio.
Influence of Different Ethanol Dosage on Synthesis Rate of Mineral Polymer Precursor
Generally, ethanol is selected as the solvent of TEOS and inorganic aluminum sources. The solvent effect is mainly to dissolve of reactants, the amount of alcohol can accelerate the TEOS hydrolysis reaction rate, but a glut of ethanol, inhibits the hydrolysis of TEOS (de Vos et al., 1999), because the ethanol in the sol-gel process has the effect of dispersant and inhibitor, ethanol content will affect the synthetic reaction, the amount of ethanol to determine a reasonable range. In Figure 3, the molar ratios of anhydrous ethanol and ethyl orthosilicate are 1,1.5,2,2.5 and 3, respectively.
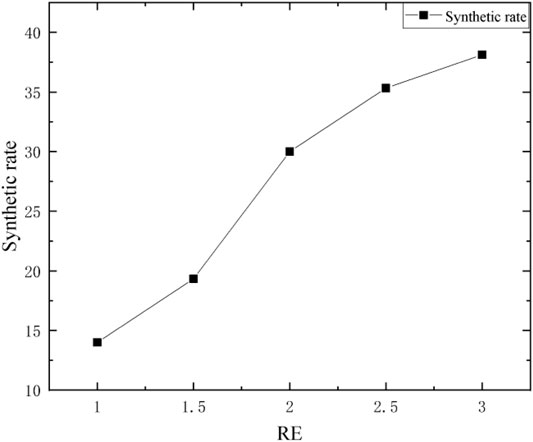
FIGURE 3. Effect of different ethanol dosage on synthesis rate of precursor.
It can be seen from Figure 3 that the influence of different ethanol dosages on the synthesis rate of the precursor increased with the increase of RE value, but the increase range was different. In general, when RE fluctuates between 1 and 3, the synthesis rate increases gradually with the increase of ethanol dosage. The increase of ethanol will improve the organic components in SiO2 sol, and reduce the inorganic components. Ethanol occupies a certain volume in the network channels, so the network formed by polymers is relatively sparse, resulting in a loose and unstable product structure (Huo et al., 2004). With the increase of RE = n (EtOH)/n (TEOS), the viscosity of sol decreases, the gel time becomes longer and shorter, and the synthesis rate increases gradually.
Structural Characterization of Mineral Polymeric Precursors
The structure of the precursor of the synthesized mineral polymeric material was characterized by XRD, TG and IR.
XRD Characterization of Synthetic Mineral Polymer Precursors Under Different Influencing Factors
XRD Characterization of Mineral Polymeric Precursors From Different Aluminum Sources
Different aluminum sources (aluminum chloride hexahydrate and aluminum nitrate nonahydrate) and TEOS were used to prepare mineral polymeric precursors by sol-gel method. Synthesis conditions are Si/Al = 1:1, synthesis temperature 70°C, aging time 12 h, drying at 105°C, and 850°C calcination. XRD patterns of mineral polymeric precursors were shown in Figure 4.
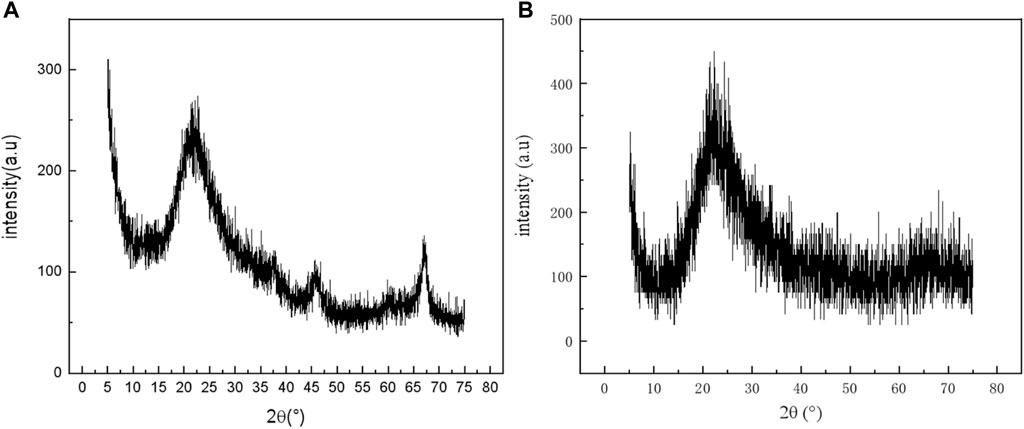
FIGURE 4. XRD patterns of mineral polymeric precursors with different aluminum sources. (A): aluminum chloride hexahydrate; (B): aluminum nitrate nonahydrate.
It can be seen from Figure 4 that the shapes of the two spectral lines are roughly the same. The spectral lines of aluminum raw material aluminum chloride hexahydrate (Figure 4A) are slender and narrow compared with that of aluminum nitrate nonahydrate (Figure 4B). Amorphous envelope peaks are formed at 2θ = 15–30°and 2θ is about 15–40°, respectively.
XRD Characterization of Mineral Polymeric Precursors With Different Si/Al Ratios
Figure 5 shows the XRD patterns of precursor aerogels with different Si/Al mole ratios after heat treatment at 850°C. It can be seen from Figure 5 that when the Si-Al ratio is 1:1 and 20:1, the spectra of Si-Al precursor form an amorphous peak with a similar shape, and both curves show an amorphous diffraction peak at 2θ = 23°, indicating that the precursor has a typical amorphous morphology. There is a wide and strong diffraction peak at the position about 20–25°(2θ), which is the diffraction peak of amorphous SiO2 (Horiuchi et al., 1999). The strongγ- Al2O3 diffraction peak appears when Si/Al is 1:10, and the weakγ-Al2O3 diffraction peak appears when Si/Al is 20:1. This phenomenon may be caused by the different Si/Al mole ratios. When Si content is high, the SiO2 network structure is mainly formed, and Al2O3 is distributed among them, making its diffraction peak difficult to observe. With the decrease of Si content, the γ-Al2O3 crystal phase can be precipitated at 850°C (Kim et al., 2007). Although the Si/Al ratio of the synthesized samples is different, the shape of each spectral line is basically the same, forming an amorphous envelope peak. It can be concluded that the powders with different Si/Al ratios are amorphous structures after heat treatment at 850°C.
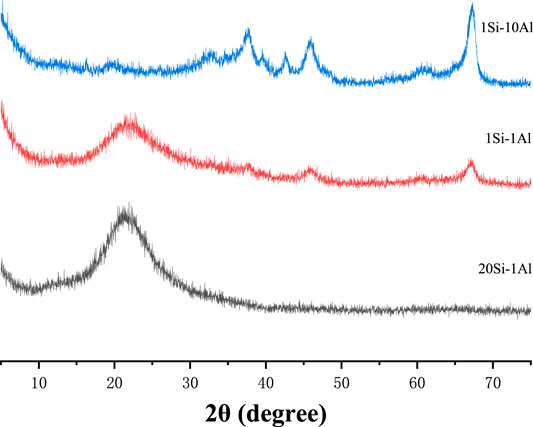
FIGURE 5. XRD patterns of Si/Al precursors with different Si/Al molar ratios after heat treatment at 850°C.
XRD Characterization of Mineral Polymer Precursors Synthesized by Different Ethanol Dosage
XRD patterns of the synthetic mineral polymer precursors with different RE are shown in Figure 6.
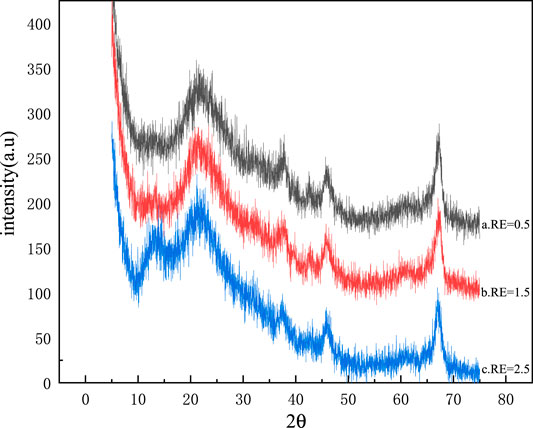
FIGURE 6. XRD patterns of mineral polymer precursors synthesized with different amounts of ethanol.
It can be seen from Figure 6 that the shapes of each spectral line are similar, forming an amorphous envelope peak with a wide and strong diffraction peak at the position of about 15–30°(2θ). When RE is 0.5 and 1.5 respectively in shape, a and b in Figure 6 are relatively similar. The amorphous envelope peaks of the spectral lines in Figures a and b are located between 15° and 30°at 2θ. The analysis shows that the XRD diffraction peaks are not greatly affected by the different amounts of ethanol.
XRD Characterization of Mineral Polymer Precursors Synthesized at Different Synthesis Temperatures
Mineral polymerization precursors were prepared at different synthesis temperatures of 50, 70, and 90°C, respectively, and their XRD patterns are shown in Figure 7.
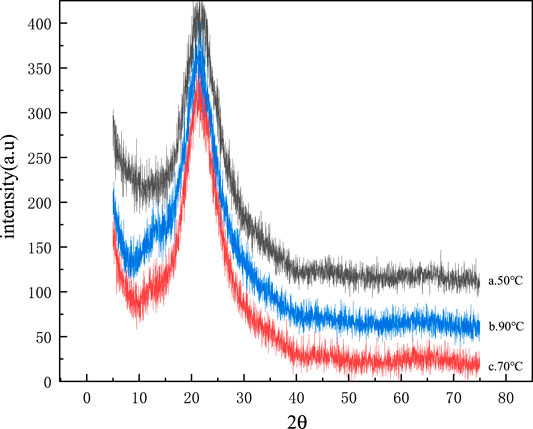
FIGURE 7. XRD patterns of mineral polymer precursors synthesized at different synthesis temperatures.
It can be seen from Figure 7 that the three particles are in the range of about 15–30°at 2θ, and all of them have an amorphous phase diffraction peak, indicating that the prepared Si-Al powder samples have typical amorphous morphology (Wu et al., 2006). The XRD patterns of Si-Al powders prepared at different synthesis temperatures have no difference. It can be preliminarily concluded that the different synthesis temperatures have no great influence on the structure of Si-Al powders.
Thermogravimetric Differential Thermal Analysis
Thermogravimetric-differential thermal curves of the precursors of mineral polymeric materials are given in Figure 8 and Figure 9 respectively, synthesized takes aluminum chloride hexahydrate as the aluminum source and ethyl orthosilicate as a silicon source, with different silicon to aluminum ratios and at the same synthesis temperature of 70°C.
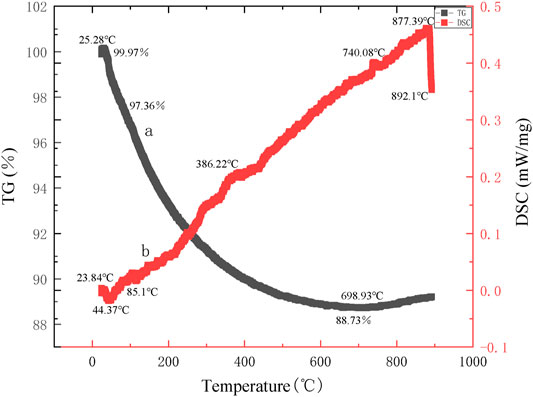
FIGURE 8. The synthesis temperature was 70°C and the Si/Al ratio was 1:1.
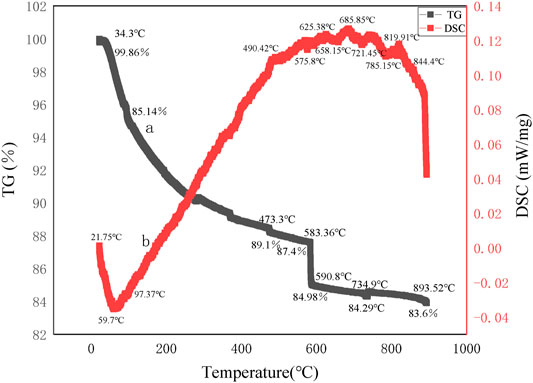
FIGURE 9. The synthesis temperature was 70°C and the Si/Al ratio was 10:1.
Figure 8 shows the TG curve of the precursor of mineral polymeric material synthesized at the synthesis temperature of 70°C with aluminum chloride hexahydrate as the aluminum source, ethyl orthosilicate as a silicon source, and silicon to aluminum ratio of 1:1.
It can be seen from the thermogravimetric curve that the total weight loss rate of the precursor of mineral polymeric material is 11.24%. From the differential thermal curve, an endothermic peak (peak temperature is 44.37°C) appears between 21.75 and 85.1°C. Meanwhile, there is an obvious weight loss on the TG curve with a weight loss rate of 2.5%, and the mass of the precursor sample decreases slightly. The reason lies in the weight loss of the gel’s physical adsorption of water (Du et al., 2016). Some physically bound water will be absorbed on the gel surface or in the pore diameter. When the temperature is slightly higher, the physically bound water will be lost first. From 220 to 698.93°C, the weight drops sharply, which is the weight loss of the organic groups in the gel. Until 900°C, the total weight becomes 88.73% of the original mass, with a weight loss of 8.63%.
Figure 9 shows the TG curve of the precursor of mineral polymeric material synthesized at 70°C with aluminum chloride hexahydrate as the aluminum source, ethyl orthosilicate as a silicon source, and silicon to aluminum ratio of 10:1.
As can be seen from the thermogravimetric curve in Figure 9, the total weight loss rate of the precursor of mineral polymeric material is 16.26%, and the weight drops sharply from room temperature to 590.8°C, about 14.88% weight loss, which is mainly caused by evaporation of residual ethanol and water on the sample pore and surface and the dispersion of the precursor. Combined with the differential heat curve, it can be seen that there is a large endothermic peak (peak temperature is 59.7°C) between 21.75 and 99.37°C, and there is an obvious weight loss on the TG curve, with a weight loss rate of 4.6%. An exothermic peak occurs between 90 and 290°C, which is the exothermic peak of C-H bond combustion. After the hydrolyzed ethyl orthosilicate in the precursor forms silica gel, there is unreacted ethanol in the surface layer, a C-H bond exists in ethanol, and an exothermic peak will be formed after combustion (Sun et al., 2010). At 490°C, there is an obvious exothermic peak, which is the exothermic peak of the C-C bond. Then the temperature continued to rise to 658°C and an exothermic peak appeared. However, in the range of 575.8–844.4°C, a small endothermic peak (peak temperature is 658.15°C) appears, which is caused by dehydration and endothermic absorption of structural water (H+ and OH−) in the amorphous structure of the precursor sample. At the same time, there is a significant weight loss on the TG curve, with a weight loss rate of 5.5%. After the temperature continues to rise to 900°C, there is no differential thermal peak. And the mass remains pretty much the same.
Infrared Spectral Analysis of Mineral Polymeric Precursors
Figure 10 shows the IR spectra of the precursors of mineral polymeric materials synthesized at different synthesis temperatures of 40, 50, 70, 80 and 90°C respectively.
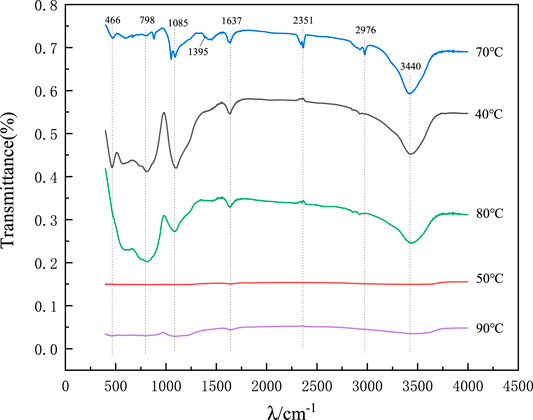
FIGURE 10. IR spectra of precursors of mineral polymeric materials synthesized at different temperatures.
According to Figure 10, in the infrared spectrum, the peaks of 3,440 and 1,637 cm−1 correspond to asymmetric stretching vibration and bending vibration of adsorbed water respectively. Peaks at 466, 798, and 1,085 cm−1 correspond to the bending vibration, symmetric stretching vibration, and antisymmetric stretching vibration of the Si-O-Si bond respectively (Aravind et al., 2006). The small absorption peaks near 1,395 cm−1 are shear bending vibration and plane bending vibration of C-H in -CH3, indicating that there is a group -CH3 on the end-branched chain of the precursor gel. The stretching vibration peak of Si-OC2H5 at 2,976 cm−1 may be caused by the incomplete hydrolysis of ethyl orthosilicate to form Si-OC2H5 on the surface of SiO2 aerogel. Under the influence of different synthesis temperatures, the absorption peaks of the precursors of the synthesized mineral polymers are obviously different, especially when the synthesis temperatures are 50 and 90°C.
Figure 11 shows the IR spectra of the precursors of synthetic mineral polymer materials at different Si/Al ratios of 20:1, 10:1, 1:1, 1:10, and 1:20.
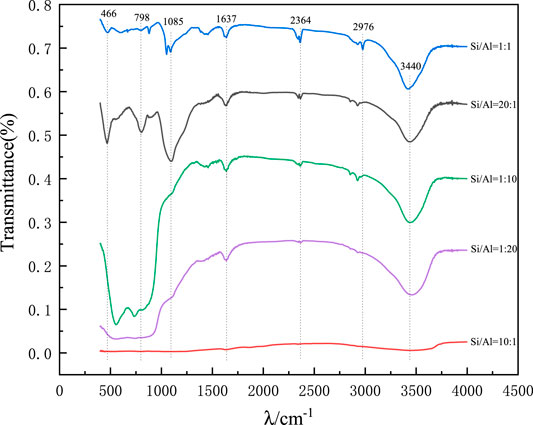
FIGURE 11. IR spectra of precursors of mineral polymeric materials synthesized by different Si/Al ratios.
In the infrared spectrum, the bending vibration of the absorption peak corresponding to H-O-H is about 1,637 cm−1, which may be related to the free water adsorbed on the surface of the mineral polymer precursor. The strong wide peak at wave number 3,440 cm−1 is the antisymmetric stretching vibration peak of -OH (Liu et al., 2012). The strong and wide peak at 1,085 cm−1 and the peaks at 806 and 466 cm−1 are the Si-O-Si antisymmetric stretching vibration peak, symmetric stretching vibration peak, and bending vibration absorption peak respectively (Horiuchi et al., 1999). The stretching vibration peak of Si-OC2H5 at 2,976 cm−1 may be caused by the incomplete hydrolysis of ethyl orthosilicate to form Si-OC2H5 on the surface of SiO2 aerogel (Liu et al., 2016). However, the peak near 847 and 953 cm−1 may be the absorption peak of Si-OH bending vibration without complete reaction. Under the influence of different Si/Al ratios, the absorption peaks of the precursors of the synthesized mineral polymers are obviously different, especially when Si/Al ratio is 10:1.
As shown in Figure 12, the IR spectra of the precursors of synthetic mineral polymeric materials were obtained under the conditions of RE = 0.5, 1, 1.5, 2.5, and 3 with different ethanol dosages.
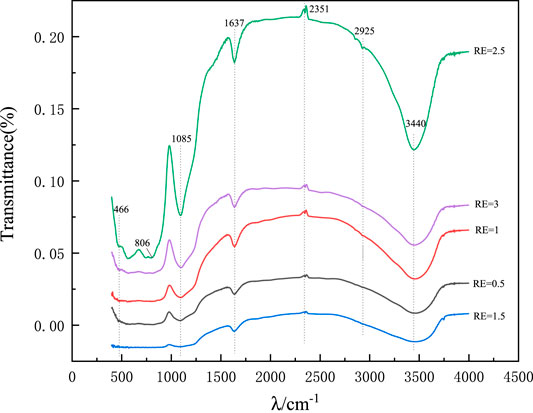
FIGURE 12. IR spectra of mineral polymer precursors synthesized by different amounts of ethanol.
In the infrared spectrograph, due to the stretching vibration of the O-H bond, there is a strong and wide absorption band at 3,440 cm−1, and there is a weak characteristic peak of H-OH at 1,637 cm−1, which is mainly due to the existence of hydroxyl group on the surface of the synthetic precursor and the absorption of water in the air. The stronger transmission peak at 1,085 cm−1 is the antisymmetric stretching vibration peak of the Si-O-Si bond (Shao et al., 2013), and the symmetric stretching vibration peak and bending vibration peak of Si-O-Si near 798, 466 cm−1 respectively, which are special absorption peaks in the gel structure of synthetic precursor (Chen et al., 2011). The anti-symmetric stretching vibration absorption peak of C-H in the precursor of mineral polymeric materials was at 2,963 cm−1, while the peak near 806 cm−1 may be the unreacted Si-OH bending vibration absorption peak (Guo, 2016). Infrared spectroscopic analysis shows that the peak value of Si-OH increases with the increase of ethanol dosage, and has a significant effect on the absorption peak of mineral polymer precursor.
Microscopic Morphology Analysis
SEM of Mineral Polymeric Precursors Synthesized From Different Aluminum Sources
Figure 13 is an SEM of the precursors of mineral polymeric materials synthesized by different aluminum sources.
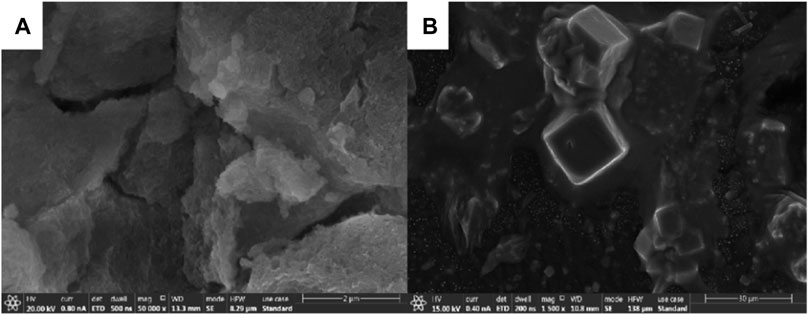
FIGURE 13. SEM images of precursors of mineral polymeric materials synthesized from different aluminum sources. (A): aluminum chloride hexahydrate; (B): aluminum nitrate nonahydrate.
It can be seen that the SEM morphology of Si-Al precursors prepared by using aluminum chloride hexahydrate and aluminum nitrate nonahydrate as the aluminum source is very different. In Figure 13 a, the pores are small and evenly distributed, the overall network skeleton is loose (Jian et al., 2009). There are large but uniform distribution pores in Figure 13B. In addition, it can be seen from the SEM figure that there is a tetrahedral shape, and the analysis shows that there is calcite.
SEM Diagram of Precursors of Synthetic Mineral Polymeric Materials With Different Si/Al Ratios
Mineral polymerization precursors were prepared at different Si/Al ratios of 10:1, 1:1, 1:10, and 1:20, respectively, SEM images are shown in Figure 14.
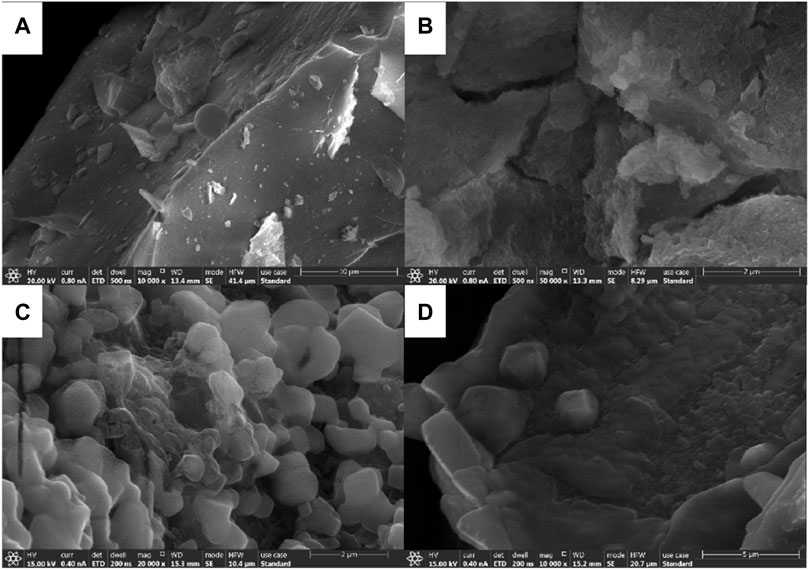
FIGURE 14. SEM images of mineral polymeric precursors with different Si/Al ratios. (A) Si/Al=10:1; (B) Si/Al=1:1; (C) Si/Al=1:10; (D) Si/Al=1:20
By observing and analyzing a, b, c, and d in Figure 14, it can be concluded that the average particle size of Si-Al precursors synthesized with different Si-Al ratios is small and the particle size distribution is uniform. In addition, it can be concluded that the sample particle size is related to Si/Al ratio, that is, with the decrease of the Si/Al ratio, the sample particle size also decreases. When the Si/Al ratio is 1:1 and 1:10 in Figures 14B and Figures 14C, the average particle size of the powder is small and the particle size distribution is more uniform. Some small particles are attached to the surface of the large lamellar particles, and their boundaries are blurred, showing obvious agglomeration and secondary growth phenomena (Chen et al., 2020). However, there is little difference between the two samples. The particle size of the synthesized powders is small, the particle size distribution is relatively uniform, and the agglomeration degree is not high. From the scanning electron microscope images of Si-Al precursors, it can be found that amorphous spherical particles are formed in the microscopic appearance, the surface is relatively smooth, and some are multiple spherical particles bonded together.
SEM Diagram of Mineral Polymer Precursors Synthesized by Different Ethanol Dosage
As shown in Figure 14, the SEM diagram of the precursor of mineral polymeric material synthesized by different ethanol dosage (RE = 0.5, 1, 2, 3) with the same raw material and other influencing factors unchanged.
It can be seen that the SEM morphology presents a spongy structure, a stepped layered structure, and a loose and complete skeleton (Zheng, 2011). In addition, the gaps of the samples in Figure 15A and Figure 15B are larger and looser than those in Figures 15C,D, but the basic morphology of the two samples is layered. Samples a and b are more porous and layered, with connections between layers, like empty nests. The samples in Figures 15C,D were almost seamless and more closely combined. Moreover, amorphous spheroidal particles are formed in the microscopic appearance (as shown in Figure 15C and Figure 15D).
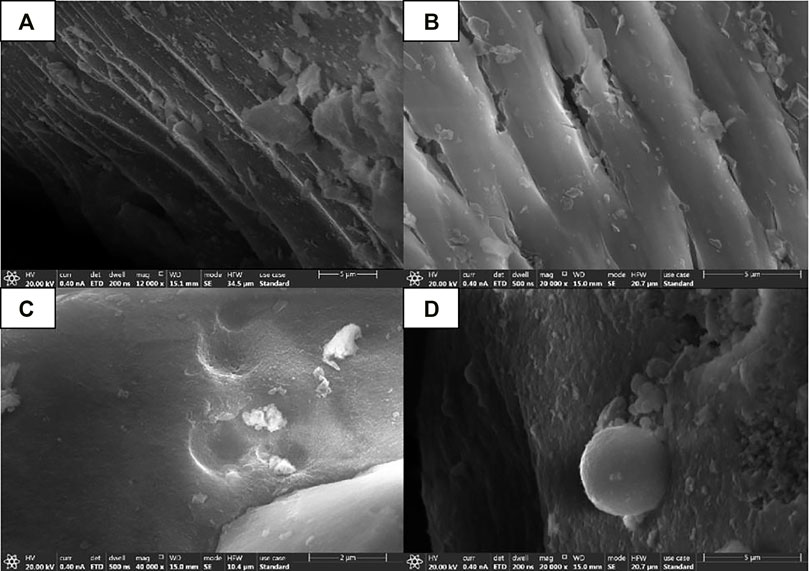
FIGURE 15. SEM patterns of mineral polymer precursors synthesized with different amounts of ethanol. (A) RE=0.5 ;(B) RE=1 ;(C) RE=2 ;(D) RE=3.
SEM Diagram of the Mineral Polymeric Precursor at Different Synthesis Temperatures
Proper temperature can promote hydrolytic polycondensation to proceed smoothly. A uniform and stable precursor system gel was formed. In order to explore the influence of synthesis temperature on the growth of synthesized samples, the silica-aluminum precursor gel synthesized at 50, 70, and 90°C (Si/Al = 1:1, over oven) was investigated by SEM, as shown in Figure 16.
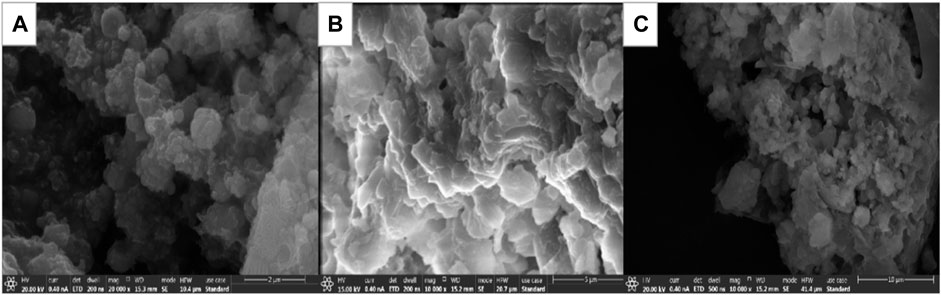
FIGURE 16. SEM images of Si-Al precursors prepared at different synthesis temperatures. (A) 50°C; (B) 70°C; (C) 90°C.
As can be seen from Figure 16, the particle size of the mineral polymer precursor synthesized at 50°C after drying in a 105°C oven is smaller than that of the sample synthesized at 70 and 90°C, and the particle size distribution is more uniform. When the synthesis temperature increases, the average kinetic energy of colloidal particles in the system increases and Brownian motion accelerates. The collision frequency of aluminum chloride hexahydrate, ethyl orthosilicate, and water molecules was increased, which accelerated the hydrolytic polycondensation reaction. However, the increase of temperature will lead to the volatilization of ethanol, which further increases the concentration of sol and hydrolyzed condensation products, and reduces the diffusion rate, resulting in agglomeration growth (Himmel et al., 1995), thus forming larger particles, and thus affecting the performance of the sample.
Conclusion
In this experiment, the precursor of mineral polymeric material was prepared by the sol-gel method. The effects of different aluminum sources, different synthesis temperatures, different Si/Al ratios, and different amounts of ethanol on the structure and properties of the precursor of mineral polymeric material were studied. The morphology and phase composition of aerogel were characterized by SEM and XRD. The changes of chemical groups in the structure of the precursor of the synthesized mineral polymer were analyzed by FTIR. TG was used to analyze the influence of different factors on the thermal stability of the synthesized precursor gel. The main conclusions are as follows:
1) The optimum technological parameters for the preparation of mineral polymer precursors were determined as follows: synthesis temperature: 70°C; ethanol dosage RE = N (EtOH)/(TEOS) is generally controlled around 3. Aging time: 14 h; Calcination temperature: 850°C; Calcination time: 3 h.
2) Using TEOS as a silicon source and aluminum chloride hexahydrate as an aluminum source, the precursors of mineral polymeric materials were synthesized by the sol-gel method. When the molar ratio of TEOS, AlCl3·6H2O, and EtOH was 10:1:10, the sample synthesis rate was the highest at 81.33%.
3) The precursors of mineral polymeric materials prepared under the same aluminum source and different Si/Al ratios have similar spectral line shapes and similar peak positions, which are all amorphous structures.
4) XRD, TG, and FTIR analysis showed that the microstructure of the precursor was different at different synthesis temperatures, Si/Al ratio, and ethanol dosage. The content of silicon and aluminum should be controlled between 20:1 and 1:10, otherwise the former is easy to form glass phase at high temperature, and the latter is easy to have an incomplete reaction of AlCl3·6H2O residue. In this experiment, when the Si/Al ratio is 10:1, the synthesized sample has the best performance in all aspects.
Data Availability Statement
The original contributions presented in the study are included in the article/supplementary material, further inquiries can be directed to the corresponding author.
Author Contributions
XM: Experiment, test and data analysis, data collation, writing-manuscript preparation. NY: guidance, supervision, verification of experimental design. LS: review of the first draft. WiL: Software and data management. WoL: To publish the financial support and suggestions of the experiment. WS: Supervision, project management.
Funding
This work was supported by Tangshan Science and Technology Plan Project (19130223g), High-level Talent Funding Project in Hebei Province (A201901053), Tangshan Science and Technology Research and Development Plan Project (19150210E), and Tangshan Science and Technology Plan Project (19130216g), National Natural Science Foundation of China (52004091), Natural Science Foundation of Hebei Province (E2019209494).
Conflict of Interest
The authors declare that the research was conducted in the absence of any commercial or financial relationships that could be construed as a potential conflict of interest.
Publisher’s Note
All claims expressed in this article are solely those of the authors and do not necessarily represent those of their affiliated organizations, or those of the publisher, the editors and the reviewers. Any product that may be evaluated in this article, or claim that may be made by its manufacturer, is not guaranteed or endorsed by the publisher.
References
Aravind, P. R., Mukundan, P., Krishna Pillai, P., and Warrier, K. G. K. (2006). Mesoporous Silica-Alumina Aerogels with High thermal Pore Stability through Hybrid Sol-Gel Route Followed by Subcritical Drying. Microporous Mesoporous Mater. 96, 14–20. doi:10.1016/j.micromeso.2006.06.014
Chen, H. S., Sun, Z. Y., and Shao, J. C. (2011). Study on Infrared Spectral Characteristics of Eight Kinds of Silica from Different Sources[J]. Bull. Silicate 30 (4), 934.
Chen, Y., Han, T., and Zhang, Y. (2020). Synthesis of ZSM-5 Zeolites from Acid Hydrolyzed Ethyl Orthosilicate as Silicon Source [J]. Inorg. chemicals industry 52 (7), 88
de Vos, R. M., MaierMaier, W. F. b., and Verweij, H. (1999). Hydrophobic Silica Membranes for Gas Separation. J. Membr. Sci. 158, 277–288. doi:10.1016/s0376-7388(99)00035-6
Du, C., Li, H., and Li, B. (2016). Characteristics and Properties of Cellulose Nanofibers Prepared by TEMPO Oxidation of Corn Husk[J]. Bio Resour. 11 (2), 5276–5284. doi:10.15376/biores.11.2.5276-5284
Duan, Y., Wang, P., and Yang, K. (2006). Study on Hydration and Hardening Mechanism of Alkali-Activated Metakaolin Cementitious Materials [J]. New Building Mater. (1), 22–25.
Guo, Y. (2016). Preparation and Properties of Al2O3 Aerogels and Composites [D]. Guangzhou: South China University of Technology.
Himmel, B., Gerber, T., and Burger, H. (1995). Structural Characterization of SiO2-Al2O3 Aerogels[J]. J. Non-Crystalline Sol. 185 (1-2), 56–66. doi:10.1016/0022-3093(94)00668-7
Horiuchi, T., Lai yuan, C., and Osaki, T. (1999). A Novel Alumina Catalyst Support with High thermal Stability Derived from Silica-Modified Alumina Aerogel[J]. Catal. Lett 58, 89.
Huo, Y. Q., Zhai, Y. C., and Tong, H. H. (2004). Effect of Three Co-solvents on the Hydrolysis of Ethyl Orthosilicate [J]. J. Northeast. Univ. (natural science) 25 (2), 133
Jian, F., Gao, Q., and Wu, W. (2009). Effect of Silicon Content on Structure and Properties of Al2O3-SiO2 Aerogel[J]. Chin. J. Inorg. Chem. 25 (10), 1758
Kim, S.-M., Lee, Y.-J., Jun, K.-W., Park, J.-Y., and Potdar, H. S. (2007). Synthesis of Thermo-Stable High Surface Area Alumina Powder from Sol-Gel Derived Boehmite. Mater. Chem. Phys. 104, 56–61. doi:10.1016/j.matchemphys.2007.02.044
Liu, G., Zhou, B., and Ni, X. (2012). Influence of thermal Process on Microstructural and Physical Properties of Ambient Pressure Dried Hydrophobic Silica Aerogel Monoliths. J. Sol Sci. Techn. 62 (2), 126 ∼133.
Liu, J., and Zhang, Y. (2018). Experimental Study of Fly Ash Geopolymer Mortar[J]. Compr. Utilization Fly ash (2), 46–49.
Liu, Z., Ding, Y., and Wang, F. (2016). Preparation and Characterization of SiO2 Aerogel[J]. Contemp. Chem. Industry 45 (12), 2792.
Patil Gouri, V., Joshi Rakesh, S., and Kazi Rubina, S. (2020). A Possible Role of Glycation in the Regulation of Amyloid β Precursor Protein Processing Leading to Amyloid β accumulation[J]. Elsevier, 142.
Shao, Z., Luo, F., and Cheng, X. (2013). Superhydrophobic Sodium Silicate Based Silica Aerogel Prepared by Ambient Pressure Drying[J]. Mater. Chem. &Physics 141 (1), 570∼575. doi:10.1016/j.matchemphys.2013.05.064
Sun, C., Cheng, H., and Wu, W. (2010). The Hot Place Pairs the Fiber Study on the Properties of SiO2 Aerogels Enhanced by Vitamin D [J]. Yu hang Mater. Eng. 2, 85
Tan, B., and Rankin, S. E. (2006). Study of the Effects of Progressive Changes in Alkoxysilane Structure on Sol−Gel Reactivity. J. Phys. Chem. B 110 (45), 22353–22364. doi:10.1021/jp060376k
Wan, X., Zhang, Y., and Zhao, T. (2008). Mechanical Properties of Alkali Activated Slag Concrete [J]. Mater. Rev. 32 (12), 2091
Wu, C., Zhang, N., and Zhang, Y. (2006). Progress in Preparation and thermal Insulation Performance of SiO2 Aerogel [J]. Ceramics (1), 24–26.
Wu, X., Shao, G., Shen, X., Cui, S., and Wang, L. (2016). Novel Al2O3-SiO2composite Aerogels with High Specific Surface Area at Elevated Temperatures with Different Alumina/silica Molar Ratios Prepared by a Non-alkoxide Sol-Gel Method. RSC Adv. 6 (7), 5611–5620. doi:10.1039/c5ra19764c
Zhang, F. (2014). Preparation and Properties of Al2O3–SiO2 Aerogel [D]. Beijing: Beijing University of Chemical Technology.
Zheng, G. (2011). Preparation of Amorphous Al2O3–SiO2 Powder and its Geological Polymerization Mechanism [D]. Guangxi: Guangxi University.
Keywords: mineral polymer precursor, sol-gel method, synthesis, performance, structural characterization
Citation: Miao X, Yimiao N, Shuxian L, Ling W, Long W and Sen W (2022) Synthesis and Structural Characterization of Fly Ash Based Mineral Polymer Precursors. Front. Mater. 9:837395. doi: 10.3389/fmats.2022.837395
Received: 16 December 2021; Accepted: 14 February 2022;
Published: 08 April 2022.
Edited by:
Mazeyar Parvinzadeh Gashti, PRE Labs Inc., CanadaReviewed by:
Francesco Colangelo, University of Naples Parthenope, ItalyPing Duan, China University of Geosciences Wuhan, China
Copyright © 2022 Miao, Yimiao, Shuxian, Ling, Long and Sen. This is an open-access article distributed under the terms of the Creative Commons Attribution License (CC BY). The use, distribution or reproduction in other forums is permitted, provided the original author(s) and the copyright owner(s) are credited and that the original publication in this journal is cited, in accordance with accepted academic practice. No use, distribution or reproduction is permitted which does not comply with these terms.
*Correspondence: Nie Yimiao, bmlleW0xNjhAMTYzLmNvbQ==