 Rebecca Mort1,2
 Victor S. Cecon1,3
 Paul Mort4
 Kelsey McInturff2
 Shan Jiang1,2
 Keith Vorst1,3
 Greg Curtzwiler1,3*
- 1Polymer and Food Protection Consortium, Iowa State University, Ames, IA, United States
- 2Department of Materials Science and Engineering, Iowa State University, Ames, IA, United States
- 3Department of Food Science and Human Nutrition, Iowa State University, Ames, IA, United States
- 4Department of Materials Engineering, Center for Particulate Products and Processes, Purdue University, West Lafayette, IN, United States
The demand for new methods of diverting materials from waste streams has grown as sustainability and landfill reduction goals continue to be set. Municipal solid waste combustion and waste-to-energy (WTE) facilities reduce landfill waste accumulation but ash material by-products are commonly sent to landfills. In this work, we evaluate the potential for fly ash to be used as an inert filler in post-consumer recycled polyethylene to maximize landfill diversion of high-volume materials. Using fly ash from solid waste combustion as a filler increases landfill diversion, reduces associated costs, and offsets the cost of the recycling for post-consumer plastics by blending with a low cost filler. Characterization of the fly ash revealed high variability in ash particle composition and size, which was expected due to the municipal solid waste source. A series of composites were compounded incorporating fly ash into recycled linear low-density polyethylene utilizing various compatibilizers. The composites were characterized for molecular interactions, thermal properties, mechanical properties and changes in melt processing via infrared spectroscopy, differential scanning calorimetry, electromechanical testing, and oscillatory melt rheology, respectively. Mechanical testing of the fly ash composites indicated that the fly ash did not significantly change the Young’s modulus or yield stress and the addition of various compatibilizer additives increased impact strength. The impact strength of the neat polymer decreased drastically from ∼55 kJ/m2 to ∼20 kJ/m2 at 5 wt. % fly ash. However, the addition of PGME compatibilizer at 0.75 wt. % increased the composite’s impact strength to roughly the same value as the neat polymer. Thus, the addition of a compatibilizer could be used to alter the fly ash filler composite’s resistance to flexural shock. These results indicate that fly ash can be added to recycled linear low-density polyethylene up to 10% while maintaining physical properties.
Introduction
With the increasing need to improve waste processing and develop materials and products capable of a circular economy, the focus on recycling and other landfill diversion strategies has intensified over the last few decades. Though recycling is considered one of the most promising and trusted approaches, many challenges continue to hinder recycling efficiencies, including insufficient infrastructure, difficulty sorting incompatible materials, and poor economic incentives (Chandra et al., 2016). Additionally, after removing all recyclable material from the waste stream, a substantial amount remains destined to be landfilled.
One approach for reducing landfill waste volume includes municipal solid waste (MSW) waste-to-energy (WTE) facilities. These facilities combust non-hazardous waste under confined and controlled conditions, leaving fly ash and bottom ash as solid material by-products. Fly ash is carried from the combustion chamber via exhaust gases and then collected in filters to prevent atmospheric release. Bottom ash is collected at the bottom of the combustion chamber (USEPA, 2020b). After combustion, the fly ash and bottom ash are collected, treated, mixed, and transported to a landfill, which costs up to $60 per ton in tipping charges depending on the landfill location. These WTE facilities recover energy from the combustion process to generate electricity. The United States Environmental Protection Agency (U.S. EPA) has documented 75 municipal solid waste (MSW) WTE facilities in the Unied States as of 2020 (USEPA, 2020b). MSW combustion is even more commonplace in other countries where land availability is more limited, indicating the amount of landfilled fly ash globally is significant (USEIA, 2020). European countries often incinerate larger percentages of their waste compared to the United States. Denmark, Sweden, and Norway all incinerate over 50% of waste (Seltenrich, 2013), which is represented by the number of WTE facilities in each country: 79 in Germany, 127 in France, and 234 in Japan (Lu et al., 2017).
Though MSW combustion reduces waste volume, there is a growing demand to find applications for utilization of the ash waste in new products to further divert material accumulation in landfills. One of the 75 plants in the United States sends ∼2,000 tons of ash to landfills annually. Several studies have tested ash waste properties, such as mineral composition and heavy metal concentrations, from various sources including biomass, coal, and MSW combustion (Riber et al., 2005; Kutchko and Kim, 2006; Wei et al., 2011; Loginova et al., 2019). Aubert et al. specifically focused on the use of fly ash as a filler material in cement or mortar (Aubert et al., 2006). Cement and concrete are commonly targeted applications for fly ash and other waste stream products, such as powdered ceramics, recycled tires, and calcium carbonate from deconstructed carpet material, due to inherently cementitious properties (Cunningham et al., 2021). Additional studies have focused on ways to pre-treat fly ash material to address heavy metal safety concerns, thereby making its use in cements and other building materials more feasible (Ferraro et al., 2019). For example, water washing and thermal pre-treatments have been shown to remove chlorides and reduce heavy metal leaching from fly ash used in cement applications (Wey et al., 2006; Yang et al., 2018).
Another proposed method of fly ash utilization is as a filler material in a polymer matrix composites. Historically, polymers reinforced with glass fiber have been one of the most common methods for acquiring a composite with enhanced mechanical properties and potentially reduced cost when the fillers are more cost-effective than the polymer (Valente et al., 2011). Researchers have searched for alternatives to glass fibers from both natural (e.g., wood flour, rice husks) (La Mantia and Morreale, 2006; Tong et al., 2014; Chen et al., 2018) and man-made sources (e.g., fly ash from coal production). Previous studies have explored the integration of fly ash into various polymers such as polypropylene (PP), polyethylene terephthalate (PET), polystyrene (PS), and high density polyethylene (HDPE) (Rebeiz et al., 1995; Satapathy and Kothapalli, 2015; Yao et al., 2019; Bicer, 2020; Ajorloo et al., 2021). Many of the results have demonstrated promise. For example, fly ash was determined to disperse well throughout a polymer matrix, leading to uniform mechanical properties (Bicer, 2020; Ajorloo et al., 2021). Additionally, one study reported that when blended with PET, ash filler could improve tensile strength without causing changes to the glass transition temperature or thermal degradation (Rebeiz et al., 1995). Though these works have focused on fly ash specifically derived from coal production, it is reasonable that similar ash material from other sources (e.g., WTE facilities) also has potential as a polymer composite filler.
The goal of this research was to first understand the physical and chemical properties of fly ash derived from MSW and any potential hazards it may present due to the composition. Second, the fly ash was blended with post-consumer recycled (PCR) linear low-density polyethylene and the blends were characterized to understand the impact of fly ash filler on the composite properties at various concentrations. Third, a series of polymer compatibilizers were compounded with the PCR-ash blends. Previous studies have shown the potential of various compatibilizers in improving the mechanical and thermal properties of composite blends containing immiscible polymers and/or nanoparticle fillers (Mandal and Chakraborty, 2008; Jose et al., 2015; Martins and Santana, 2016; Sanches-Valdes et al., 2017). Therefore, compatibilizers were included in this research to determine if composite properties can be improved by adjusting additives composition and concentration in the blend formulation. Octadecylsuccinic anhydride (C22), polyethylene glycol 400 monostearate (PG4M), and polyethylene glycol monooleyl ether (PGME) were selected as compatibilizers based on their chemistry, which was anticipated to interact with both polyethylene and the fly ash surface. Overall, this research demonstrates the utility of using MSW fly ash as a component in polymer blends to reduce material cost, reduce landfill accumulation and add performance value. It will also help identify potential applications where polymer-ash composites could be safely and effectively used.
Experimental
Materials
Fly ash was supplied by a municipal Waste to Energy Facility that processes municipal solid waste. Post-consumer recycled linear low density polyethylene (LLDPE) was provided by Revolution Plastics (Little Rock, AR). Three compatibilizers were used as received: octadecylsuccinic anhydride (C22), polyethylene glycol 400 monostearate (PG4M), and polyethylene glycol monooleyl ether (PGME), were supplied from Tokyo Chemical Industry (Portland, OR), Spectrum Chemical MFG Corp (New Brunswick, NJ), and Tokyo Chemical Industry (Portland, OR), respectively.
Blends were prepared using a 27 mm twin screw co-rotating extruder (Leistritz, Somerville, NJ). A series of blends were formulated with various concentrations of fly ash and PCR LLDPE (no added compatibilizer). Additional blends were formulated to understand the impact of the three compatibilizers individually. The composition of each prepared blend is listed in Table 1. The compounded material was pelletized then injection molded into ASTM D638-14 type I dog bones (narrow width 13 mm, narrow length 57 mm, overall width 19 mm, overall length 165 mm, gage length 50 mm) (ASTM, 2014) using a 90-ton production grade horizontal injection molder (Wittmann Battenfeld, Torrington, CT), with an injection profile of 150–200°C.
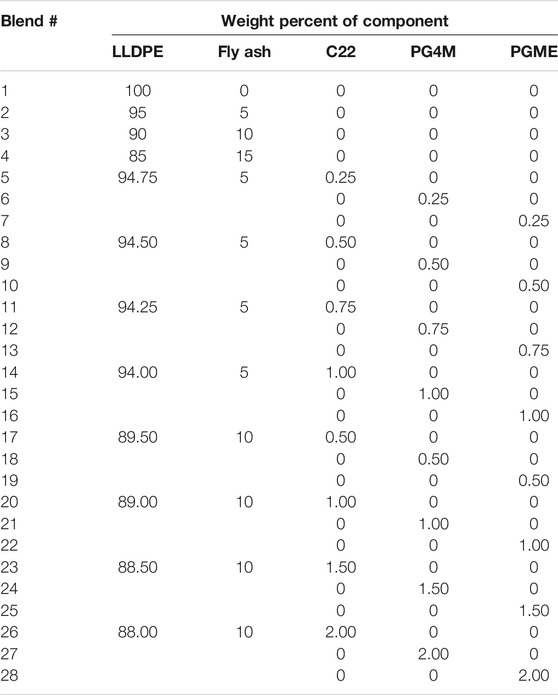
TABLE 1. Compounded blends of fly ash with LLDPE and compatibilizers.
Particle Size and Shape Determination
Fly ash particle size and shape data were collected using a Solidsizer dynamic image analysis system (JM Canty, Lockport, NY). The ash was deposited on a vibrating transfer bed which allows particles to fall in front of a high speed camera at a controlled rate. The camera was calibrated to record images with 6.2 μm/pixel resolution. The falling particles were backlit, allowing the camera to detect when a particle was in frame and collect a measurement with each image a unique datum point. Ash was continuously fed until approximately 50,000 images had been collected. Each image was characterized in terms of particle area (
Thermogravimetric Analysis
Fly ash samples were analyzed for moisture content through thermogravimetric analysis using a Q5000IR thermogravimetric analyzer (TA Instruments, New Castle, DE). The samples underwent a single 10°C/min heating ramp in a nitrogen atmosphere from 20 to 300°C. The weight reduction recorded during heating was analyzed for significant mass loss events around 100°C.
Morphological and Elemental Analyses—Scanning Electron Microscopy—Energy Dispersive X-Ray Spectroscopy
Elemental analysis of the fly ash was conducted using Energy Dispersive X-Ray Spectroscopy (EDS) to determine the chemical composition. An FEI F50 Inspect Scanning Electron Microscope (SEM) equipped with an Energy Dispersive X-ray detector was used to qualitatively identify the fly ash elemental composition. Fly ash was mounted on five sample stages using a conductive carbon adhesive tape. The fly ash was pressed firmly into the tape for maximum adhesion. Four locations (selected from different quadrants of each sample) were analyzed on each of the five sample stages, resulting in 20 total EDS maps. The locations selected were the most densely packed with ash. The SEM was operated at a 15 kV and a spot size of 5.5. The results from the 20 EDS maps were averaged to identify the elements present within the fly ash.
Injection-molded specimens of each composite formulation were cryofractured and the surfaces analyzed to determine the fly ash distribution within the polymer composite. Blends number 1, 3, and 23 (Table 1) were selected to obtain a general representation. Two specimens of each of the three blends were submerged in liquid N2 before being removed one at a time and quickly fractured using a rubber hammer. The samples were mounted and sputter coated with Pd/Pt to create a conductive surface prior to imaging. Chlorine and sodium were used as markers to identify fly ash within the polymer matrix since they were previously determined to be present in the fly ash through EDS.
Inductively Coupled Plasma—Optical Emission Spectroscopy
Inductively Coupled Plasma Optical Emissions Spectroscopy (ICP-OES) analysis of the fly ash was completed to quantify heavy metals detected by SEM-EDS. Fly ash samples were digested via microwave-assisted digestion using an UltraWave digestion system (Milestone, Inc., Shelton, CT). Due to limitations of the available digestion system, hydrofluoric acid could not be used in the digestion, indicating that some materials, such as silica, did not fully digest. Multiple digestion methods were tested using varying intensities in temperature and power. The method which best digested the samples was used to prepare three repeated measures of fly ash for ICP analysis. Specifically, 30 mg of ash was digested in 6 ml of concentrated aqua regia at a maximum temperature of 240°C for 20 min. The digested samples were diluted to 50 ml with deionized water and analyzed using an iCap-7400 Duo ICP-OES (Thermo Scientific, Waltham, MA), with measurements conducted in radial mode for two wavelengths for each metal. The analysis quantified Al, Cd, Cr, Fe, Ni, Pb, Sb, and Ti, using multi-elemental calibration solutions prepared from single standard solutions purchased from Inorganic Ventures (Christiansburg, VA).
Fourier Transform Infrared Spectroscopy
Attenuated total reflectance (ATR) Fourier-Transform Infrared Spectroscopy (FTIR) was used to determine changes in chemical bonding and interactions on the surface of LLDPE-ash blends due to the compatibilizers. SEM-EDS suggested a homogenous material, therefore, the composite surface was considered representative of the bulk. A Nicolet 6,700 infrared spectrometer (Thermo Scientific, Waltham, MA) with a DTGS detector was used with 32 scans per run and a 2 cm−1 resolution. The diamond window of the ATR assembly was cleaned with an isopropanol wipe after each measurement to ensure no cross-contamination.
Differential Scanning Calorimetry
The impact of compatibilizer on thermal transitions of LLDPE-ash blends was characterized using a Q2000 differential scanning calorimeter (TA Instruments, New Castle, DE). Three measurements of each blend were tested using a heat/cool/heat cycle ranging −50–200°C, at a rate of 10°C/min under an N2 atmosphere. Each specimen had a mass of 3–6 mg and was added into an aluminum DSC pan hermetically sealed before analysis. The thermal transitions in the second heating cycle were reported to eliminate thermal history effects.
Parallel-Plate Oscillatory Melt Rheometry
The viscoelastic properties of the blends were analyzed in oscillatory mode (frequency sweep) using a DHR-2 hybrid rheometer (TA Instruments, New Castle, DE) equipped with an environmental test chamber and a 25 mm parallel-plate geometry with 1 mm gap between plates. All measurements were carried out within the linear viscoelastic region, at 190°C, under low strain (1%) and air atmosphere, with the angular frequency ranging from 0.05 to 628 rad/s.
Electromechanical Testing
All blends were characterized through electromechanical testing in tensile mode according to ASTM D638-14 (ASTM, 2014) using an Autograph AGS-J (Shimadzu Corp. Kyoto, Japan) universal electromechanical tester. A load cell of 5 kN and a manual non-shift wedge grip MWG-5kNA (Shimadzu Corp., Kyoto, Japan) were used, with a 50 mm/min crosshead speed. Ten specimens for each blend were tested to obtain stress-strain curves, with the subsequent calculation of the Young’s modulus and yield stress.
Impact Testing
The Charpy impact test was conducted to determine the response of composite samples to flexural shock using ten injection-molded specimens notched according to ASTM D6110-18 (ASTM, 2018). An IT504 Plastic Impact Tester (Tinius Olsen, Horsham, PA) was used to conduct testing. The energy absorbed during the impact and the fracture/plastic deformation behavior of the sample were recorded.
Statistical Analysis
For measurements containing multiple data points per formulation, a statistical analysis was conducted using JMP® Pro 16, SAS Institute Inc., Cary, NC. One-way ANOVA with Bonferroni corrected post hoc t-tests were conducted to determine if means were statistically different. This analysis was conducted for enthalpy of melting data obtained through DSC and Charpy impact testing data.
Results and Discussion
Fly Ash Characterization
Particle size and shape distribution are crucial factors influencing how particles interact and flow in a given medium. Variation in the particle size and shape could cause changes in how the ash affects the rheological properties of polymer melts and, therefore, the processing of polymer blends. The volume-based particle size distribution, shown in Figure 1, is described using area equivalent diameter. A fitted curve with weighted mean square error (wmse) of 4.15 × 10⁻⁵ was generated as the sum of two log-normal modes derived from a split distribution: 1) particles >1,050 mm comprising 7.2%, and 2) particles <1,050 µm comprising 92.8% of the sample volume. Obtaining the lowest possible wmse improves the accuracy of the fitted curve and identifies separate modes. The geometric mean size of the primary mode (b) is about 370 μm with a moderate size distribution. The coarse mode (a) has a much higher geometric mean of nearly 1,500 μm. This suggests either 1) particles comprise agglomerates, causing particles to appear larger in the measurement, or 2) there is a group of particles with a larger average size compared to the rest of the distribution (Mora et al., 1998; Lloyd, 2003; Cepuritis et al., 2017). Given previous research detailing particle size distribution of fly ash and bottom ash separately, it is unlikely that such coarse particles would be elutriated as fly ash (Chang and Wey, 2006). This supports the hypothesis that the coarse particles are formed through agglomeration and/or compaction during the collection process.
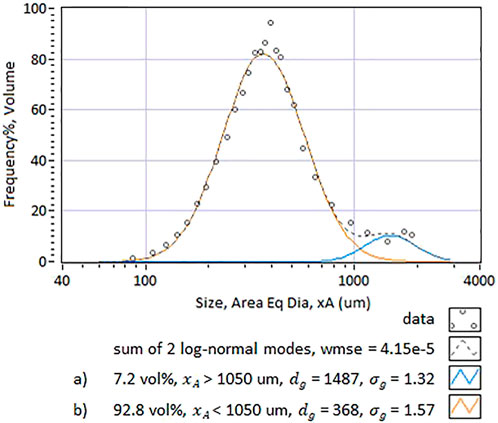
FIGURE 1. Size distribution of fly ash particles. The data points are overlaid with a fitted curve determined by the sum of two log-normal modes.
A bivariate analysis of aspect ratio and elliptical form factor was conducted to describe aspects of the fly ash particle shapes. Figure 2 shows examples of particle images at varying points within the aspect ratio-elliptical form factor (AR-EFF) shape map. A lower aspect ratio (AR) suggests particle elongation, while a lower elliptical form factor (EFF) suggests an extended or irregular particle perimeter. See methods section 2.2 for a more detailed explanation of AR and EFF calculation. The full data set is shown in Figure 3. It can be observed that the majority of particles are within an EFF range of 0.9–1.0 and AR 0.7–0.9. This suggests the particles are fairly compact but not necessarily spherical. It must also be noted that the overall distribution of particle shape is extremely wide, and a significant portion of particles are very irregularly shaped, suggesting that these could be agglomerations of smaller particles and may be easily comminuted in a dispersion process. On the other hand, the Figure 3A data suggest that the coarse mode particles are relatively compact in the structure; if these are compact agglomerates, it may be more challenging to disperse them directly in a compounding process without a pre-milling step. To confirm whether or not the observed shape distribution is a result of small particle agglomeration, a more detailed characterization of individual size cuts is recommended. Overall, the size and shape of the fly ash particles have a high degree of heterogeneity. It is also likely that the measured distribution depends on the type of waste processed and operating parameters at the WTE facility.
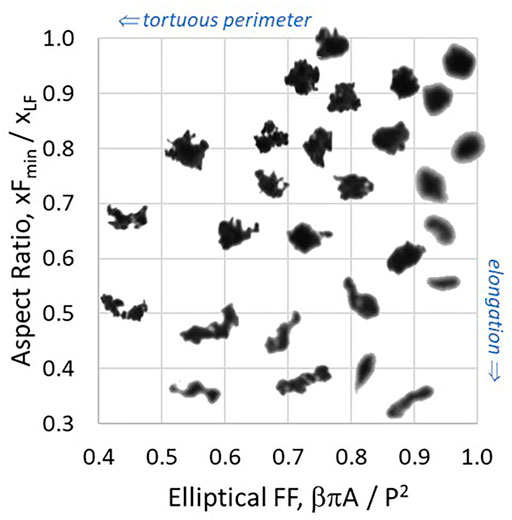
FIGURE 2. Example particle images placed according to their calculated aspect ratio and elliptical form factor.
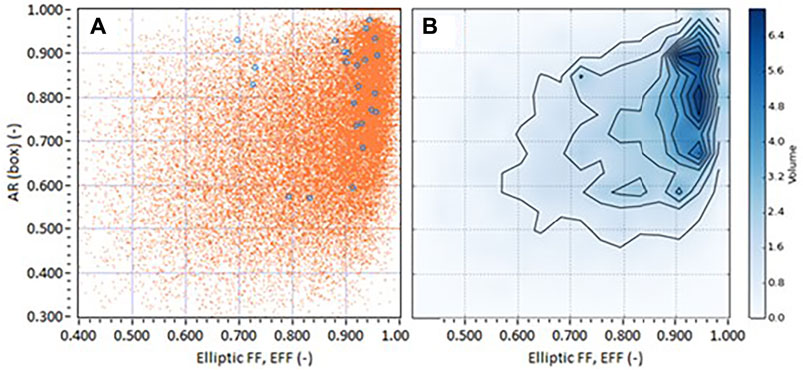
FIGURE 3. Fly ash particle shape distribution shown as (A) general scatter plot and (B) contour map. The orange dots in (A) represent the particles in the primary mode of the split distribution; the blue circles represent the coarse mode particles.
It is expected that the fly ash should have extremely low water content immediately following combustion. However, it is unknown if the ash absorbs moisture over time before melt processing. Thermogravimetric analysis showed no deflection or major change in mass loss around 100°C that would be associated with evaporating water. In fact, there was very little weight loss throughout the temperature range, less than half of one percent weight loss during the heating cycle. Thus, we can conclude that the ash moisture content does not rise significantly over time under ambient conditions.
The SEM images of fly ash particles reflect the irregular shapes and variation in particle size measured in the previous size/shape distribution analysis. A representative example image is shown in Figure 4. The 20 EDS map spectra obtained displayed a variety of elements, including C, O, Cl, Na, K, Si, S, Mo, Ca, Zn, Al, P, Br, Fe, Cu, Pb, Mg, Ti, and Ni. The EDS data emphasizes compositional variation in fly ash particles. Though carbon is expected to be the most prevalent material in the particles, a multitude of other elements were detected, limited to localized analysis areas. For example, areas in which both silicon and oxygen were present indicate the fly ash likely contains silica glass. Some elements of regulatory concern were detected in the energy dispersive X-ray spectra (e.g., lead). These results suggest that there may be limited applications for fly ash as a polymer filler due to potential health and environmental safety concerns. To confirm the presence of heavy metals and obtain more precise concentrations, ICP analysis was performed.
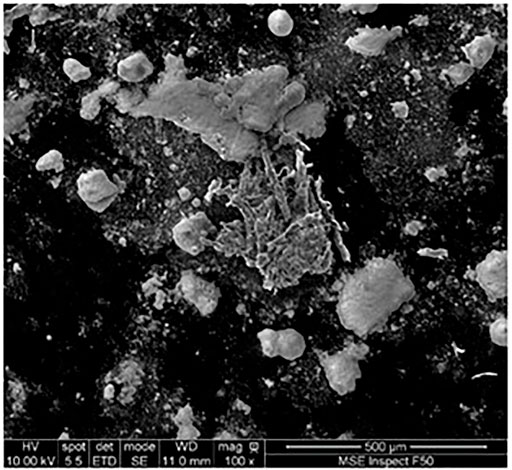
FIGURE 4. Example SEM image of fly ash particles. Other images showed similar variations in particle size and shape.
ICP-OES results determined that aluminum and iron are present at high levels (see Figure 5). This is generally not surprising given that these materials are likely to be present in waste streams. According to the EPA, ferrous metals make up the highest weight percentage of metals in total MSW production (USEPA, 2020c). Iron is commonly found in appliances, furniture, and automobile parts as well as waste material from construction. Aluminum is also highly prevalent as it makes up 1.3% of total MSW in the United States mostly in the form of containers such as beverage cans (USEPA, 2020a). However, the concentrations of several other heavy metals were considerably high. Lead, in particular, was measured to be over 5,000 ppm. Similarly high levels of lead were also found in the fly ash collected from eight German and Swiss WTE plants, with at least five plants displaying values between 5,000 and 10,000 ppm (Haberl et al., 2018). In Taiwan, levels close to 1,000 ppm were reported from ash collected from a solid waste incinerator using municipal solid waste, industrial waste, and biomass waste (Chang et al., 2009).
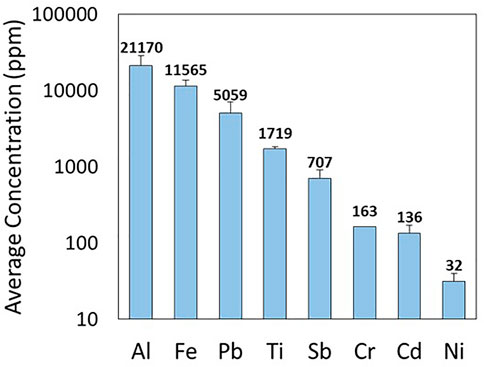
FIGURE 5. Concentrations of heavy metals in fly ash.
Therefore, if the measured levels of metals remain consistent, the fly ash material could not be used as polymer filler at concentrations over 1.5 wt. % (resulting in lead: 75.9 ppm; chromium: 2.4 ppm; cadmium: 2.0 ppm; total: 80.3 ppm) in applications which involve direct contact with people such as food packaging or toys; the maximum allowable levels of the sum of cadmium, hexavalent chromium, lead, and Mercury is 100 ppm (Toxics in Packaging Clearinghouse, 2021). These results only reflect the presence of heavy metals within the ash. Further testing would need to be conducted on polymer blends containing fly ash to determine if these hazardous components will leach out over time or are matrix locked and are more of an end-of-life environmental concern.
Post-Consumer Recycled-Fly Ash Blend Characterization
In the second half of this study, the fly ash was blended with post-consumer recycled (PCR) linear low-density polyethylene (LLDPE) to determine its viability as a filler material and manufacture quality materials that are comprised of 100% landfill diverted materials. The ash characterization determined heterogeneity of the ash particle’s chemical composition and size/shape. FTIR was used to compare LLDPE blends without compatibilizer and blends with each of the three compatibilizers to understand changes in molecular interactions. Figure 6 shows an overlay of representative examples of collected spectra. The fly ash and C22 compatibilizer possess no distinctive peaks, while the PGME and PG4M compatibilizers both possessed characteristic peaks at 1,464, 2,847, 2,915, and the 3,400–3,460 cm−1 region (Figure 6A). Peaks at 2,847 cm−1 and 2,915 cm−1 indicate C-H bond stretching and 1,464 cm−1 indicates C-H bond bending. The peaks in the 3,400–3,460 cm−1 region indicate the presence of–OH groups (Socrates, 2001).
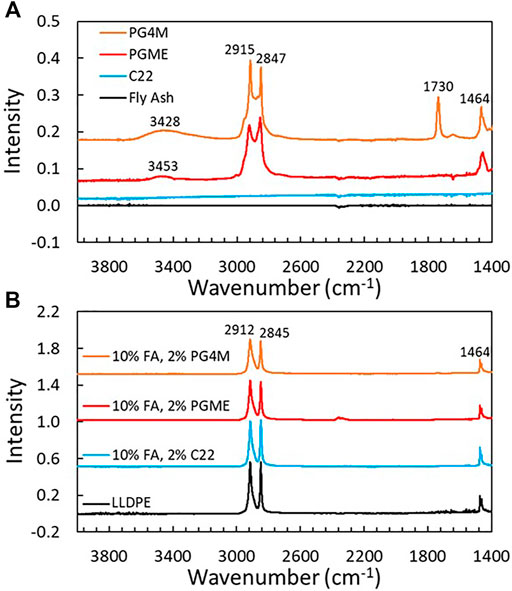
FIGURE 6. FTIR spectra of selected (A) fly ash and compatibilizers and (B) polymer samples including unaltered PCR LLDPE and blends with the highest concentration of both fly ash and compatibilizer.
Figure 6B displays representative samples of blends with each compatibilizer compared to the unmodified PCR LLDPE. All spectra show peaks characteristic of LLDPE with no noticeable shifting. There is no discernable trend correlating the presence of ash and/or compatibilizer. Therefore, it is reasonable to conclude that there was no significant interaction between the fly ash and the polymer regardless of the presence or type of compatibilizer.
Though the fly ash appears not to interact strongly with the polymer, it may still realize changes in the thermal and mechanical properties of the LLDPE blends. DSC analysis was utilized to identify changes in polymer thermal transitions. Within the temperature range, all samples underwent a melting transition around 127°C. No other thermal transitions were observed. The enthalpy of melting was used to compare polymer crystallinity. The results in Figure 7A suggest that increasing fly ash content may cause a decrease in the enthalpy of melting. Generally, this would imply that the polymer crystallinity decreases as fly ash is added, although a one-way ANOVA test determined that none of the blends were significantly different. If a downward trend were observed with further samples, a logical conclusion could be that crystallinity is reduced as fly ash acts as a defect or hinders chain mobility, disrupting polymer chain alignment to form crystals upon cooling. This would, however, suggest some level of interaction between the fly ash and the polymer, which is not reflected in the FTIR results.
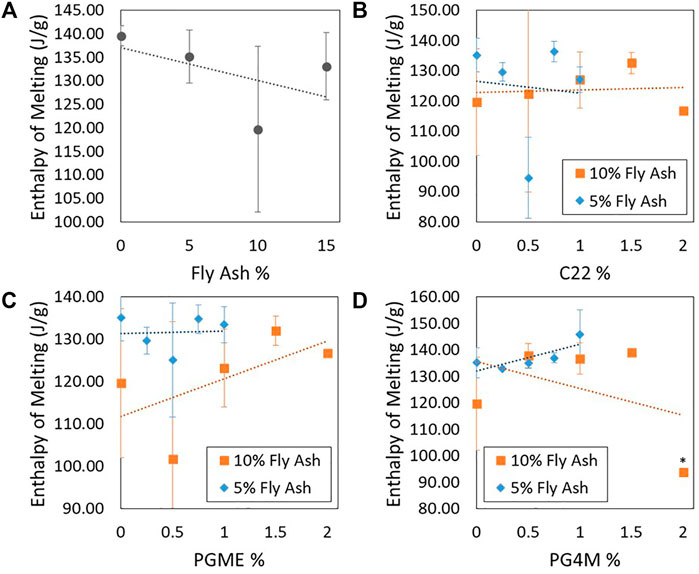
FIGURE 7. Enthalpy of melting data for (A) PCR LLDPE-FA blends without compatibilizer, (B) blends with C22, (C) blends with PGME, (D) blends with PG4M.
Figures 7B–D show the enthalpy of melting as a function of compatibilizer composition. There is no clear overall trend and the data has high variability. Three samples were tested from each blend, so increasing the number of samples tested could decrease error. Nonetheless, the results currently suggest that the addition of a compatibilizer does not impact the enthalpy of melting. Statistical analysis determined that only the blend with 10 wt. % fly ash and 2 wt. % PG4M was statistically different from other blends containing less PG4M. However, it was not statistically different from the 10 wt. % fly ash blend without a compatibilizer.
The high variation in the DSC analysis could be indicative that the fly ash may not have been homogeneously dispersed in the polymer matrix. The particle size/shape analysis suggested that the particles may be prone to agglomeration, which could cause a more heterogeneous polymer blend. Additionally, understanding how the compatibilizers influence fly ash dispersion is important for identifying potential mechanisms of changes to the blends’ thermal and mechanical properties.
To investigate the level of fly ash dispersion in the polymer, cross-sections of select representative samples were prepared and imaged with SEM-EDS (Figure 8). Chlorine and sodium were used as markers to identify areas with fly ash as those elements were known to be present from earlier fly ash characterization and are not detected in the LLDPE alone. There is little qualitative difference between the samples with and without compatibilizer. Both samples show similar levels of dispersion. In general, it can be discerned that the fly ash has been dispersed reasonably well and that the particle size analysis detected agglomerated particles that were broken apart and dispersed during extrusion compounding (Figure 8).
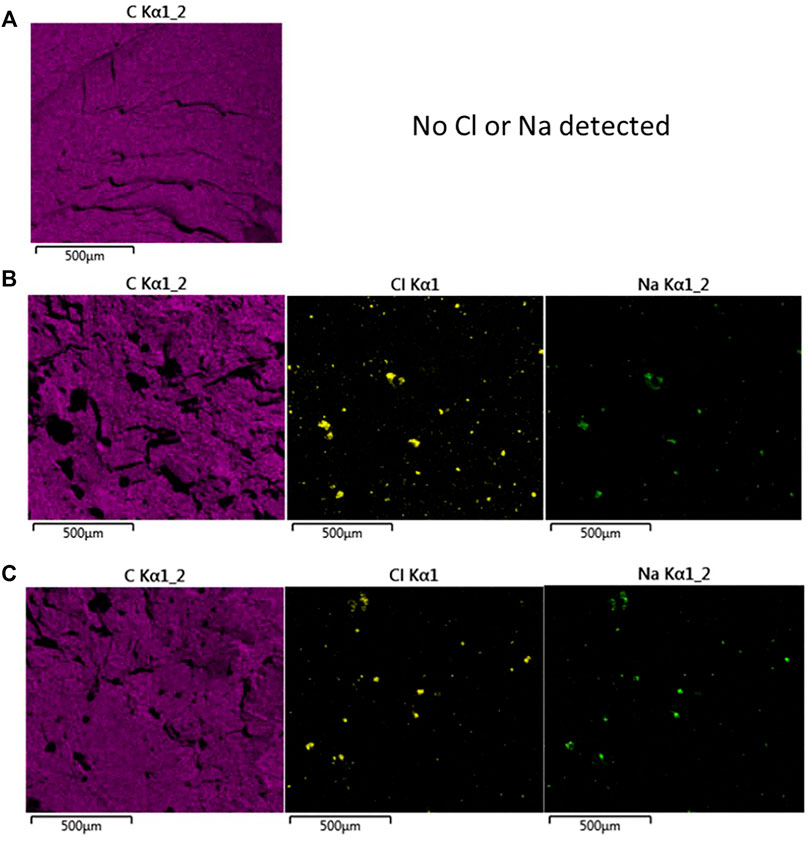
FIGURE 8. EDS maps of cryofractured cross-sections (A) PCR LLDPE, (B) 10 wt. % Fly ash 1.5 wt. % C22 (C) 10 wt. % Fly ash no compatibilizer. Carbon (left), chlorine (middle), and sodium (right).
Differences in viscosity were investigated through oscillatory melt rheology experiments. It was observed that the addition of fly ash at different concentrations did not alter the samples’ complex viscosity, as demonstrated in Figure 9A. The impact of the three compatibilizers was also evaluated using blends with a fixed amount of FA (5 wt. %), with PGME more notably reducing the complex viscosity, especially at lower frequencies, when compared to PG4M and C22. The C22 compatibilizer possessed the closest rheological behavior to the uncompatiblized blend (Figure 9B). Different concentrations of the C22 compatibilizer were tested, with minimal differences noticed through the frequency range (Figure 9C). These results suggest that the presence of fly ash mixed with the PCR LLDPE would not require significant changes to extrusion parameters due to the minimal changes in viscosity as a function of shear rate. The use of a compatibilizer, especially PGME, can be considered if it is desired to reduce the viscosity of the polymer blend; otherwise, its incorporation would not significantly alter the blends’ viscosity as observed with different concentrations of C22.
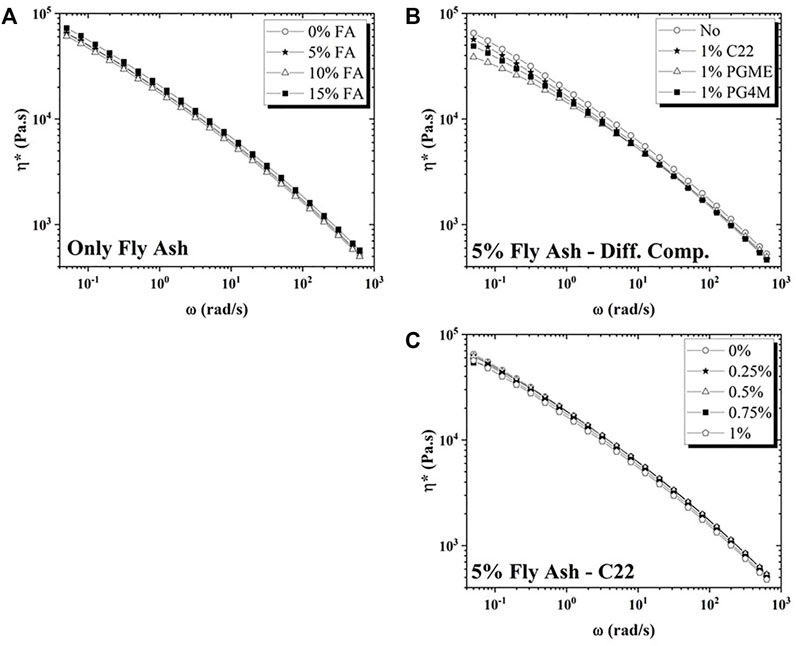
FIGURE 9. Complex viscosity plots of (A) PCR LLDPE with different concentrations of FA, (B) PCR LLDPE with 5 wt. % FA and 1 wt. % of the three compatibilizers tested (C) PCR LLDPE with 5 wt. % FA and different concentrations of the C22 compatibilizer.
Mechanical performance testing was also performed and the tensile test results are displayed in Figure 10. In general, the addition of fly ash alone did not significantly alter the performance of the Young’s Modulus of about 850 MPa and yield stress of about 22 MPa regardless of fly ash concentration. This suggests that fly ash can be blended in recycled LLDPE to reduce landfill accumulation and reduce cost without detrimentally influencing mechanical properties. In contrast, the three compatibilizers did have an impact on tensile mechanical properties. C22 had the most consistent performance and generally did not reduce modulus or yield stress. Both PG4M and PGME were more varied and caused significant decreases in yield stress. Given the minimal changes in viscosity caused by the three compatibilizers as well as the statistically insignificant differences in enthalpy of melting, the specific underlying mechanism causing the altered mechanical performance between the blends should be investigated in future research. Further experimentation to fully characterize the agglomeration behavior of the fly ash would help gain a better understanding of dispersion within these systems. Additionally, as crystallinity is an important factor that typically correlates with tensile properties, more DSC samples would need to be tested to verify or reduce variability.
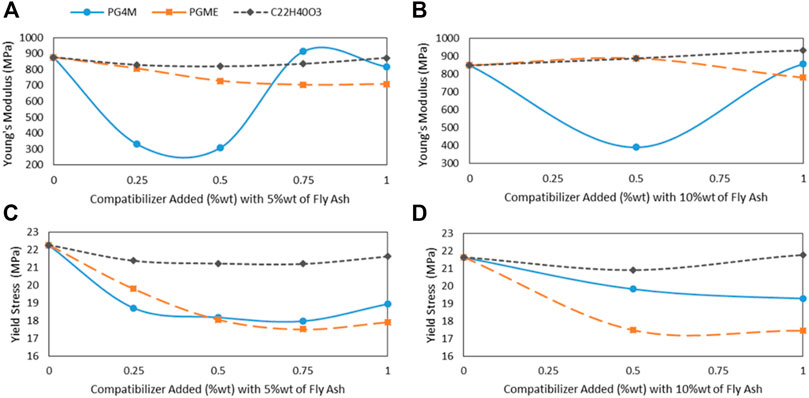
FIGURE 10. Tensile test data including Young’s Modulus of (A) 5 wt. % fly ash blends, (B) 10 wt. % fly ash blends, and yield stress of (C) 5 wt. % fly ash blends, (D) 10 wt. % fly ash blends.
An important observation from the tensile analysis is that none of the compatibilizers caused significant improvement in tensile mechanical properties relative to the blends without compatibilizer. Therefore, fly ash can serve as a filler material without causing changes in Young’s modulus and yield strength without the need for compatibilizers. In this case, compatibilizers such as PGME might only be considered to slightly alter viscosity for processing purposes.
Charpy impact testing was conducted in addition to tensile testing. The impact strength is a measure of a material’s resistance to flexural shock, with higher strength indicating increased fracture resistance, i.e., it requires more energy to fracture. In many cases, due to the ductile nature of LLDPE, the samples underwent ductile failure rather than brittle fracture. The results of the impact testing are in Figure 11. From Figure 11A, the impact strength decreases significantly with the addition of fly ash. This corresponds to a transition from ductile to more brittle failure. Statistical analysis revealed that the unmodified PCR LLDPE without fly ash was statistically different from the fly ash blends without compatibilizer. Additionally, the impact strength of the 15 wt. % fly ash blend was statistically lower from the 5 wt. % and 10 wt. % concentration blends. A small (5 wt. %) amount of added fly ash will result in a dramatic decrease in impact strength. Further addition appears to have a slight downward trend in impact strength.
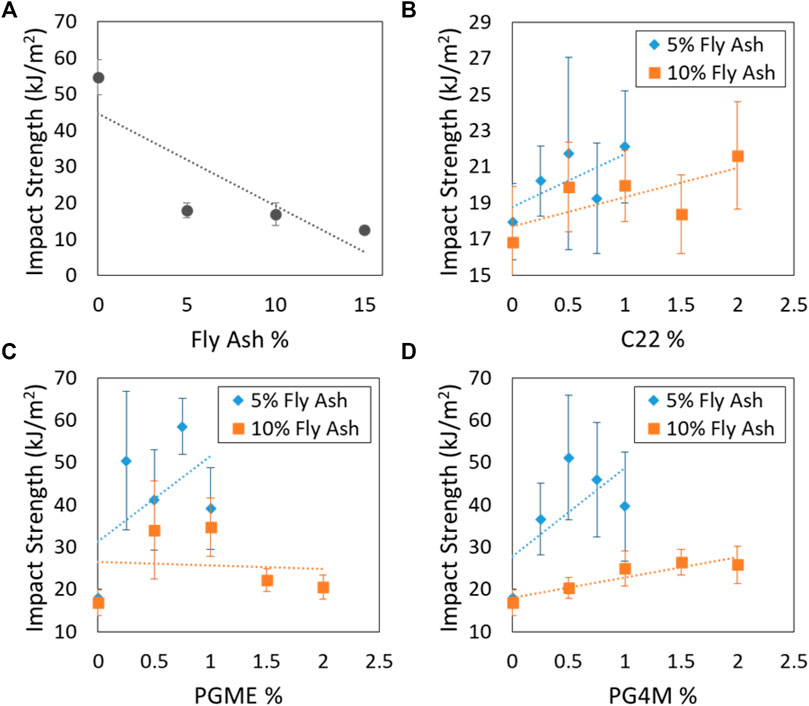
FIGURE 11. Impact strength calculated from Charpy Impact test results (A) Fly ash blends without compatibilizer, (B) blends with C22, (C) blends with PG4M, (D) blends with PGME.
Figures 11B–D displays the effect of the compatibilizers. In general, the amount of compatibilizer added does not appear to yield significant trends in impact strength measurements. However, statistical analysis indicated that the 5 wt. % blend without compatibilizer was statistically different from all 5 wt. % blends with any amount of PGME or PG4M. Similarly, the 10 wt. % blend without compatibilizer was statistically different from most PGME and PG4M formulations with the exception of 2 wt. % PGME and 0.5 wt. % PG4M. The C22 compatibilizer, unlike PGME and PG4M, did not result in a significant difference but did appear to cause an upward trend in impact strength. Of the C22 blends, only those with the highest compatibilizer concentration were statistically different from their non-compatibilized counterparts.
When comparing the impact strength levels of 5 wt. % fly ash blends, it appears that the addition of even a small amount of compatibilizer increases impact strength. For example, the 5 wt. % fly ash sample without compatibilizer has an impact strength of approximately 20 kJ/m2, but the 5 wt. % fly ash samples compounded with PG4M were measured to be between 35–50 kJ/m2. The 10 wt. % fly ash blends have lower impact strength than the 5 wt. % blends in all cases regardless of compatibilizer. These findings suggest that the sample will begin to undergo brittle failure after a certain loading of fly ash regardless of the additives used in this work. However, if fly ash is loaded at a low enough concentration, the addition of a compatibilizer aids in preventing brittle failure. It is important to note that even though the presence of a compatibilizer may increase impact strength, it does not achieve the same level of performance as the unfilled PCR LLDPE in all cases. Analysis shows that only the blends with 0.25, 0.5, and 0.75 wt. % PGME (5 wt. % FA) and 0.5 and 0.75 wt. % PG4M (5 wt. % FA) are not statistically different from the unfilled PCR LLDPE.
Conclusion
Landfill waste reduction techniques such as recycling and MSW combustion are vital factors towards sustainable and economical practices. The growing focus on creating a circular economy has thus far favored recycling and similar waste stream diversion techniques over MSW combustion. Burning waste material generates additional waste by-products in the form of ash which is currently sent to landfills. However, if the ash could be used as a component in widely used products such as plastic consumer goods, it would result in further landfill diversion.
This study analyzed the characteristics of combusted MSW fly ash and the properties of polymer blends containing fly ash. Analysis of the fly ash itself revealed that there is a high degree of variation in particle size, shape, and chemical composition. Though the overall particle composition was highly varied, the EDS and ICP testing identified levels of heavy metals that could pose regulatory concerns. However, fly ash could still be used as a polymer filler at 1.5 wt. % and still be compliant with the Toxics and Packaging Act and potentially other applications at higher concentrations. Further work needs to be completed to test the leaching of hazardous compounds over time and in different environmental conditions.
FTIR analysis determined that the fly ash does not detectably interact with the PCR LLDPE matrix, though further experimentation indicated it may still cause changes to the intrinsic polymer properties. The DSC results indicated a reduction in enthalpy of melting with increasing fly ash content suggesting fly ash particles may act as defects, preventing polymer chain alignment. Additionally, the use of compatibilizers does not seem to have an impact on either the FTIR or DSC results.
The mechanical properties of the blends are particularly interesting given that the addition of fly ash up to 15 wt. % did not cause a significant change in Young’s Modulus or yield stress. Two of the compatibilizers used in this study reduced modulus and yield stress and the third left the performance unchanged relative to the fly ash blend containing no compatibilizer. These results indicate that in terms of tensile mechanical strength, MSW fly ash is a viable filler material and does not require the use of other additives.
The Charpy Impact analysis determined that the compatibilizers may still provide some benefit. The addition of fly ash to the LLDPE caused the samples to possess more brittle failure properties as opposed to the highly ductile failure of the unmodified LLDPE. Though the compatibilizers are not able to bring the impact energy of the fly ash blends in line with the unfilled LLDPE, the impact performance improved strength up to 55 kJ/m2. Specifically, some blends with low fly ash loading and either PGME or PG4M were able to achieve impact strength levels close to that of the original polymer. The varied results observed with the compatibilizers may be due in part to the inhomogeneity of fly ash particle composition.
Overall, the results of this study show that the use of MSW fly ash as filler material in polymer composites is promising in terms of the thermal and mechanical properties investigated. The addition of compatibilizers presents some potential to adjust composite properties, but more research is needed to understand the underlying mechanisms. The concentration of heavy metals in the fly ash could limit potential applications of composites with higher concentrations. Further research should assess the safety of the ash along with potential sources of heavy metals entering the waste management plant. Despite this, the characterization of the polymer blends shows that the MSW fly ash and materials similar to it have the potential to act as a filler material in applications without heavy metal safety concerns.
Data Availability Statement
The original contributions presented in the study are included in the article/Supplementary Material, further inquiries can be directed to the corresponding author.
Author Contributions
RM supervised all experiments conducted by student researchers including TGA, SEM, ICP-OES, FTIR, DSC, electromechanical testing, and impact testing. RM compiled and analyzed all data collected from these experiments and wrote the first draft of the manuscript. VC conducted the parallel-plate rheometry testing and analyzed the results. PM conducted the particle size and shape determination testing and analyzed the results. KM conducted the scanning electron microscopy and dispersive X-ray spectroscopy and analyzed the results. KM also contributed to writing the first draft of the manuscript. SJ aided in overseeing the research and contributed to the final manuscript. KV aided in overseeing the research. GC obtained funding and outlined the goals and experimental approach of the study. GC also supervised the production of the PCR-fly ash blend materials conducted by a lab technician. All authors contributed to editing the final manuscript.
Funding
Funding was provided by the Center for Industry Research and Service (CIRAS) at Iowa State University; the City of Ames, IA Resource Recovery Plant; Agriculture and Home Economics Experiment Station HATCH Project 04202; and the Polymer and Food Protection Consortium (PFPC) based at Iowa State University.
Conflict of Interest
The authors declare that the research was conducted in the absence of any commercial or financial relationships that could be construed as a potential conflict of interest.
Publisher’s Note
All claims expressed in this article are solely those of the authors and do not necessarily represent those of their affiliated organizations, or those of the publisher, the editors and the reviewers. Any product that may be evaluated in this article, or claim that may be made by its manufacturer, is not guaranteed or endorsed by the publisher.
Acknowledgments
Special thanks to the City of Ames, IA for providing fly ash samples.
References
Ajorloo, M., Ghodrat, M., and Kang, W.-H. (2021). Incorporation of Recycled Polypropylene and Fly Ash in Polypropylene-Based Composites for Automotive Applications. J. Polym. Environ. 29 (4), 1298–1309. doi:10.1007/s10924-020-01961-y
ASTM (2014). D638-14 Standard Test Method for Tensile Properties of Plastics. West Conshohocken, PA: ASTM International.
ASTM (2018). D6110-18 Standard Test Method for Determining the Charpy Impact Resistance of Notched Specimens of Plastics. West Conshohocken, PA): ASTM International.
Aubert, J., Husson, B., and Sarramone, N. (2006). Utilization of Municipal Solid Waste Incineration (MSWI) Fly Ash in Blended cementPart 1: Processing and Characterization of MSWI Fly Ash. J. Hazard. Mater. 136, 624–631. doi:10.1016/j.jhazmat.2005.12.041
Bicer, A. (2020). Effect of Production Temperature on thermal and Mechanical Properties of Polystyrene-Fly Ash Composites. Adv. Composites Lett. 29, 2633366X2091798. doi:10.1177/2633366x20917988
Cepuritis, R., Garboczi, E. J., Ferraris, C. F., Jacobsen, S., and Sørensen, B. E. (2017). Measurement of Particle Size Distribution and Specific Surface Area for Crushed concrete Aggregate Fines. Adv. Powder Technol. 28 (3), 706–720. doi:10.1016/j.apt.2016.11.018
Chandra, M., Kohn, C., Pawlitz, J., and Powell, G. (2016). Real Cost of Styrofoam. Saint Louis University. Available at: https://greendiningalliance.org/wp-content/uploads/2016/12/real-cost-of-styrofoam_written-report.pdf (Accessed Dec 07, 2021).
Chang, F.-Y., and Wey, M.-Y. (2006). Comparison of the Characteristics of Bottom and Fly Ashes Generated from Various Incineration Processes. J. Hazard. Mater. 138 (3), 594–603. doi:10.1016/j.jhazmat.2006.05.099
Chang, C.-Y., Wang, C.-F., Mui, D. T., Cheng, M.-T., and Chiang, H.-L. (2009). Characteristics of Elements in Waste Ashes from a Solid Waste Incinerator in Taiwan. J. Hazard. Mater. 165 (1-3), 766–773. doi:10.1016/j.jhazmat.2008.10.059
Chen, R. S., Ahmad, S., and Gan, S. (2018). Rice Husk Bio-Filler Reinforced Polymer Blends of Recycled HDPE/PET: Three-Dimensional Stability under Water Immersion and Mechanical Performance. Polym. Compos. 39 (8), 2695–2704. doi:10.1002/pc.24260
Cunningham, P. R., Green, P. G., and Miller, S. A. (2021). Utilization of Post-Consumer Carpet Calcium Carbonate (PC4) from Carpet Recycling as a Mineral Resource in Concrete. Resour. Conservation Recycling 169, 105496. doi:10.1016/j.resconrec.2021.105496
Ferraro, A., Farina, I., Race, M., Colangelo, F., Cioffi, R., and Fabbricino, M. (2019). Pre-Treatments of MSWI Fly-Ashes: A Comprehensive Review to Determine Optimal Conditions for Their Reuse And/or Environmentally Sustainable Disposal. Rev. Environ. Sci. Biotechnol. 18, 453–471. doi:10.1007/s11157-019-09504-1
Haberl, J., Koralewska, R., Schlumberger, S., and Schuster, M. (2018). Quantification of Main and Trace Metal Components in the Fly Ash of Waste-To-Energy Plants Located in Germany and Switzerland: An Overview and Comparison of Concentration Fluctuations within and between Several Plants with Particular Focus on Valuable Metals. Waste Manage. 75, 361–371. doi:10.1016/j.wasman.2018.02.015
Jose, S., Thomas, S., Parameswaranpillai, J., Aprem, A. S., and Karger-Kocsis, J. (2015). Dynamic Mechanical Properties of Immiscible Polymer Systems with and without Compatibilizer. Polym. Test. 44, 168–176. doi:10.1016/j.polymertesting.2015.04.008
Kutchko, B., and Kim, A. (2006). Fly Ash Characterization by SEM-EDS. Fuel 85, 2537–2544. doi:10.1016/j.fuel.2006.05.016
La Mantia, F. P., and Morreale, M. (2006). Mechanical Properties of Recycled Polyethylene Ecocomposites Filled with Natural Organic Fillers. Polym. Eng. Sci. 46 (9), 1131–1139. doi:10.1002/pen.20561
Lloyd, P. J. (2003). “Particle Size Analysis,” in Encyclopedia of Physical Science and Technology. 3rd ed (Cambridge, MA: Academic Press), 649–654. doi:10.1016/b0-12-227410-5/00549-4
Loginova, E., Volkov, D. S., van de Wouw, P. M. F., Florea, M. V. A., and Brouwers, H. J. H. (2019). Detailed Characterization of Particle Size Fractions of Municipal Solid Waste Incineration Bottom Ash. J. Clean. Prod. 207, 866–874. doi:10.1016/j.jclepro.2018.10.022
Lu, J.-W., Zhang, S., Hai, J., and Lei, M. (2017). Status and Perspectives of Municipal Solid Waste Incineration in China: A Comparison with Developed Regions. Waste Manage. 69, 170–186. doi:10.1016/j.wasman.2017.04.014
Mandal, P. K., and Chakraborty, D. (2008). Studies on Morphology, Mechanical, Thermal, and Dynamic Mechanical Behavior of Extrusion Blended Polypropylene and Thermotropic Liquid Crystalline Polymer in Presence of Compatibilizer. J. Appl. Polym. Sci. 111 (5), 2345–2352. doi:10.1002/app.28988
Martins, A. B., and Santana, R. M. C. (2016). Effect of Carboxylic Acids as Compatibilizer Agent on Mechanical Properties of Thermoplastic Starch and Polypropylene Blends. Carbohydr. Polym. 135, 79–85. doi:10.1016/j.carbpol.2015.08.074
Mora, C. F., Kwan, A. K. H., and Chan, H. C. (1998). Particle Size Distribution Analysis of Coarse Aggregate Using Digital Image Processing. Cement Concrete Res. 28 (6), 921–932. doi:10.1016/s0008-8846(98)00043-x
Rebeiz, K. S., Banko, A. S., and Craft, A. P. (1995). Thermal Properties of Polymer Mortar Using Recycled PET and Fly Ash. J. Mater. Civil Eng. 7 (2), 129–133. doi:10.1061/(asce)0899-1561(1995)7:2(129)
Riber, C., Fredriksen, G. S., and Christensen, T. H. (2005). Heavy Metal Content of Combustible Municipal Solid Waste in Denmark. Waste Manag. Res. 23 (2), 126–132. doi:10.1177/0734242x05051195
Sánchez-Valdes, S., Ibarra-Alonso, M. C., Ramírez-Vargas, E., Ramos-deValle, L. F., Espinoza-Martínez, A. B., Valera-Zaragoza, M., et al. (2017). Effect of Compatibilizer on Polyethylene/Clay/Silver Nanocomposite Properties. Macromol. Symp. 374 (1), 1600115. doi:10.1002/masy.201600115
Satapathy, S., and Kothapalli, R. V. S. (2015). Influence of Fly Ash Cenospheres on Performance of Coir Fiber-Reinforced Recycled High-Density Polyethylene Biocomposites. J. Appl. Polym. Sci. 132 (28), 42237. doi:10.1002/app.42237
Seltenrich, N. (2013). Incineration versus Recycling: In Europe, a Debate over Trash. Yale School of the Environment. Available at: https://e360.yale.edu/features/incineration_versus_recycling__in_europe_a_debate_over_trash (Accessed Dec 11, 2021).
Socrates, G. (2001). Infrared and Raman Characteristic Group Frequencies: Tables and Charts. West Sussex, England: John Wiley & Sons.
Tong, J. Y., Royan, N. R. R., Ng, Y. C., Ab Ghani, M. H., and Ahmad, S. (2014). Study of the Mechanical and Morphology Properties of Recycled HDPE Composite Using Rice Husk Filler. Adv. Mater. Sci. Eng. 2014, 1–6. doi:10.1155/2014/938961
Toxics in Packaging Clearinghouse (2021). Coalition of Northeastern Governors. Available at: http://www.coneg.org/tpch (Accessed Dec 10, 2021).
USEIA (2020). Biomass Explained: Waste-To-Energy (Municipal Solid Waste). United States Energy Information Administration. Available at: https://www.eia.gov/energyexplained/biomass/waste-to-energy.php (Accessed Dec 02, 2021).
USEPA (2020a). Aluminum: Material-Specific Data. United States Environmental Protection Agency. Available at: https://www.epa.gov/facts-and-figures-about-materials-waste-and-recycling/aluminum-material-specific-data (Accessed Dec 04, 2021).
USEPA (2020b). Energy Recovery from the Combustion of Municipal Solid Waste (MSW). United States Environmental Protection Agencies. Available at: https://www.epa.gov/smm/energy-recovery-combustion-municipal-solid-waste-msw (Accessed Dec 02, 2021).
USEPA (2020c). Ferrous Metals: Material-Specific Data. United States Environmental Protection Agency. Available at: https://www.epa.gov/facts-and-figures-about-materials-waste-and-recycling/ferrous-metals-material-specific-data (Accessed Dec 04, 2021).
Valente, M., Sarasini, F., Marra, F., Tirillò, J., and Pulci, G. (2011). Hybrid Recycled Glass Fiber/Wood Flour Thermoplastic Composites: Manufacturing and Mechanical Characterization. Composites A: Appl. Sci. Manufacturing 42 (6), 649–657. doi:10.1016/j.compositesa.2011.02.004
Wei, Y., Shimaoka, T., Saffarzadeh, A., and Takahashi, F. (2011). Mineralogical Characterization of Municipal Solid Waste Incineration Bottom Ash with an Emphasis on Heavy Metal-Bearing Phases. J. Hazard. Mater. 187, 534–543. doi:10.1016/j.jhazmat.2011.01.070
Wey, M.-Y., Liu, K.-Y., Tsai, T.-H., and Chou, J.-T. (2006). Thermal Treatment of the Fly Ash from Municipal Solid Waste Incinerator with Rotary kiln. J. Hazard. Mater. 137 (2), 981–989. doi:10.1016/j.jhazmat.2006.03.024
Yang, Z., Ji, R., Liu, L., Wang, X., and Zhang, Z. (2018). Recycling of Municipal Solid Waste Incineration By-Product for Cement Composites Preparation. Construction Building Mater. 162, 794–801. doi:10.1016/j.conbuildmat.2017.12.081
Keywords: fly ash, recycle, polyethylene, composite, compatibilizer, sustainable
Citation: Mort R, Cecon VS, Mort P, McInturff K, Jiang S, Vorst K and Curtzwiler G (2022) Sustainable Composites Using Landfill Bound Materials. Front. Mater. 9:849955. doi: 10.3389/fmats.2022.849955
Received: 06 January 2022; Accepted: 01 February 2022;
Published: 17 February 2022.
Edited by:
Mohamed S. Mohy Eldin, City of Scientific Research and Technological Applications, EgyptReviewed by:
Francesco Colangelo, University of Naples Parthenope, ItalyParsotam H. Parsania, Saurashtra University, India
Copyright © 2022 Mort, Cecon, Mort, McInturff, Jiang, Vorst and Curtzwiler. This is an open-access article distributed under the terms of the Creative Commons Attribution License (CC BY). The use, distribution or reproduction in other forums is permitted, provided the original author(s) and the copyright owner(s) are credited and that the original publication in this journal is cited, in accordance with accepted academic practice. No use, distribution or reproduction is permitted which does not comply with these terms.
*Correspondence: Greg Curtzwiler, Z3JlZ2NAaWFzdGF0ZS5lZHU=