 Yang Yi-Long1
 Zhang Yun
- 1School of Mechanical Engineering, Henan University of Engineering, Zhengzhou, China
- 2College of Mechanical and Electrical Engineering, Central South University, Changsha, China
- 3State Key Laboratory of High Performance Complex Manufacturing, Central South University, Changsha, China
In this work, a two-dimensional model of 0.9 wt% TiC nanoparticle-reinforced 2219 aluminum nanocomposites fabricated by a high-intensity ultrasonic casting technique was established. The TiC nanoparticle distribution in 2219 aluminum melts was investigated using the multiphase computational fluid dynamics ultrasonic cavitation model accounting for turbulent flow. And the variable interaction between nanoparticles and melts was analyzed by Ansys’s Fluent Dense Discrete phase Model According to the simulation results, the ultrasonic power had a significant effect on the distribution of TiC nanoparticles in aluminum melt. The appropriate ultrasonic power has a promoting effect on the dispersion of nanoparticles. Due to the impact of ultrasonic streaming, the number of nanoparticles in the center position was lower than that in the edge position of the molten pool. Moreover, casting experiments were carried out to verify the efficacy and accuracy of the simulation. The average grain size in the center position was smaller than that in the edge position. TEM and SEM were used to analyze the distribution of TiC nanoparticles. They were more evenly distributed in the center position of the ingot than those in the edge part. Besides more nanoparticles were agglomerated in the edge. The experimental results were mostly consistent with the simulation results.
Introduction
Metal matrix nanocomposites (MMNCs) have been widely applied in aerospace, automation, transportation, and military industries. The research on aluminum matrix composites has been going on several decades. Compared with ordinary aluminum alloys, aluminum matrix composites have higher hardness, strength, better corrosion resistance, and wear resistance (Hong Yang et al., 2019; Ding Yuan et al., 2021; Zhang et al., 2021; Liu et al., 2020). What’s more, the performance of the composite can be further improved by reducing the size of the reinforcements. Nanoparticles reinforced aluminum matrix composites exhibit greater mechanical properties and ductility than microparticles reinforced aluminum matrix composites. Various reinforced phases have been investigated, including Al2O3 (Malaki et al., 2019; Li et al., 2021), TiB2 (Jie Yuan et al., 2021; Chi et al., 2021), TiC (Zhang et al., 2020; Peter et al., 2020), SiC (Ma et al., 2020; Mao et al., 2022), AlN (Yilong Yang et al., 2019), and carbon nanotubes (Guo et al., 2017). The composite materials can be prepared by different methods, including casting (Yilong Yang et al., 2019), in situ synthesis (Chi et al., 2021), power metallurgy (Nayak and Date, 2021), and additive manufacturing (Shangqin Yuan et al., 2021).
Casting is the most popular of the above preparation method due to its economy and variability. Ultrasonic melt treatment (UST) is thought to be a particularly effective method (Emadi et al., 2021; Rao, 2021). It is challenging to produce a homogeneous nanoparticle distribution in the melt due to the poor wettability and large surface volume ratio of nanoparticles. Nanoparticles tend to agglomerate during the fabrication process. The acoustic cavitation produced by ultrasonication can effectively promote the fragmentation of dendrites and increase the wettability between the nanoparticles and melts. Moreover, the instantaneous high pressure created by collapsing cavitation bubbles is also conducive to the dispersion of agglomerated nanoparticles. Thus, more nanoparticles act as heterogeneous nucleation cores, which significantly promote the grain refinement effect (Jie Yuan et al., 2021; Balasubramani et al., 2021).
However, the major studies about the ultrasonication were based on experiments. Eskin and Eskin (2003) revealed that the size and distribution of ceramic particles in Al-Si alloy matrix composites were significantly improved under the ultrasonic cavitation effect. However, the nanoparticle distribution in the melt simulated by numerical models was limited. Ayyar et al. (2008) explored the effect of particle spatial distribution and strength on the tensile behavior of particle-reinforced composites by numerical simulation method. Shashi (2020) also applied numerical simulation to analyze the debonding behavior of fiber reinforced metal matrix composites. Zhang and Nastac (2014) studied the effect of the model parameters, including nanoparticle size, ultrasonic probe position, fluid flow, and initial location where nanoparticles were released into the melt. However, these studies only performed the simulation analysis. No verification experiment was carried out to support the simulation results. Few scholars have combined numerical simulation analysis with experimental data to investigate the nanoparticle distribution in melts based on the aforesaid analysis. Therefore, it is a challenge to simulate the distribution of TiC nanoparticles in 2219 alloy melt and verify the simulation results with experimental results.
In this study, Fluent 17.0 software (Fluent, 2018) was used to simulate the distribution of TiC nanoparticle distribution. The Dense Discrete phase Model (DDPM) (Jain et al., 2017; Adnan et al., 2021) was modified. The turbulent flow, variable interaction between nanoparticles and melts were taken into account in this multiphase flow model. The purpose of this paper was to simulate the distribution of TiC nanoparticles in 2219 aluminum melt and analyze the effect of ultrasonic power on the TiC nanoparticle distribution. Subsequently, casting experiments were carried out by performing ultrasonic cavitation treatment of 2219 Al composites reinforced by 0.9 wt% TiC nanoparticles to compare the numerical simulation results.
Simulation of TIC Nanoparticle Distribution in 2219 AL Melts
Model Description
Figure 1 shows the two-dimensional mesh model. The diameter of the ultrasonic probe was 39 mm, and it was inserted 15 mm below the melt surface. The liquid aluminum was 2219 Al alloy with a density of the melt was 2.69 g/cm3 and viscosity of 1.0 × 10⁻³ kg/(ms) when the temperature ranging from 750°C to 800°C (Yang et al., 2017; Plevachuk et al., 2008). The inert TiC nanoparticles have an average diameter of 60 nm and density of 4.5 g/cm3 (Hong Yang et al., 2019). For the convenience of observation, it was assumed that 0.9 wt% TiC nanoparticles were injected 20 mm above the bottom of the molten pool, and the injection was completed within 1 s. ICEM software was used to partition the grid of this two-dimensional model for easy calculation. The model grid was divided into quadrilateral elements. To lessen the computation burden, the calculation model was scaled in proportion to the actual experimental equipment. The actual experimental crucible was 297 mm in height and 207 mm in width. The geometric parameters of the model are provided in Figure 1 and Table 1.
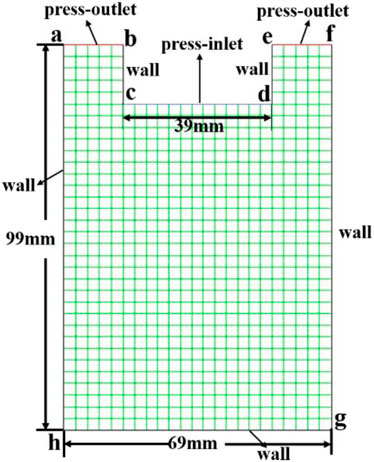
FIGURE 1. 2D mesh model of the ultrasonic treatment process.
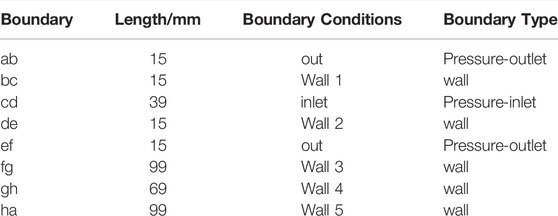
TABLE 1. Calculation model and boundary setting.
Establishment of Mathematical Models
For easy calculation, some hypotheses were proposed. Firstly, the heat convection was ignored, and the preparation device was adiabatic. Secondly, the aluminum alloy melt was an incompressible melt; and finally, the density of the aluminum melt and TiC nanoparticles remained constant. Two-phase flow mixing model, DDPM, and k-ω turbulence model (Fluent, 2018) were applied to investigate the nanoparticle distribution in the melt under ultrasonic treatment. Each phase was treated by Eulerian. Additionally, the nanoparticles were regarded as the particle phases in the Eulerian DDPM multiphase model. It was assumed that the wave propagation was linear and the shear stress was ignored. The acoustic pressure can be calculated by the wave equation (Shao et al., 2011):
where
The volume fraction of the particle phase was considered in the conservation equation. The momentum balance equation of phase q and the continuity equation [Zhang et al., 2018] of phase q can be written as follows:
Here,
The trajectory of discrete phase particles was predicted by integrating the equilibrium force of discrete phase particles in the melt. It can be calculated as follows:
where
where
where
where
The discrete random walk model is a random tracking model that considers the influence of turbulence on the particle trajectory:
where
Boundary Conditions and Solution Procedure
The end face of the ultrasonic probe was defined as the velocity inlet, which was described in the User Defined Function (UDF). Line cd represented the end face of the ultrasonic probe. Line ab, and ef represented the interface between the external shielding gas and aluminum alloy melt. The remaining lines were defined as walls (Figure 1). All discrete phase BC types were set as reflect. The concrete values and boundary condition names of each part in Figure 1 were listed in Table 1.
According to the Rosin-Rammler equation, TiC nanoparticles were between 40 nm and 70 nm in size. After solving the fluid velocity, the position of nanoparticles was calculated at each step. Unidirectional coupling was used due to the lower discrete phase volume fraction. In this situation, the influence of the discrete phase on fluid turbulence may be neglected, which is convenient for calculation.
Simulation Results and Discussion
Figure 2 shows the flow direction of the fluid and the nanoparticle distribution under ultrasonic treatment. The ultrasonic power was 350 W, and the ultrasonic vibration frequency was 19 kHz. Figure 2 shows that the fluid flow in the center position of the melt is very strong, so at the beginning, most nanoparticles were scattered to the edge under the influence of intense convection. As 0.9 wt% nanoparticles were injected into the molten alloy within 1 s, the nanoparticles dispersed from the center to the edge and afterwards from the bottom to the upper part under the influence of ultrasonication. However, a relatively larger number of particles existed in the edge than that in the center. It means that the uniformity of particle distribution was independent of ultrasonic power. While, the ultrasonic power was directly proportional to the fluid flow intensity. It was driven by acoustic streaming, and then promoted the motion of nanoparticles. These phenomena can be explained by in Figure 2.
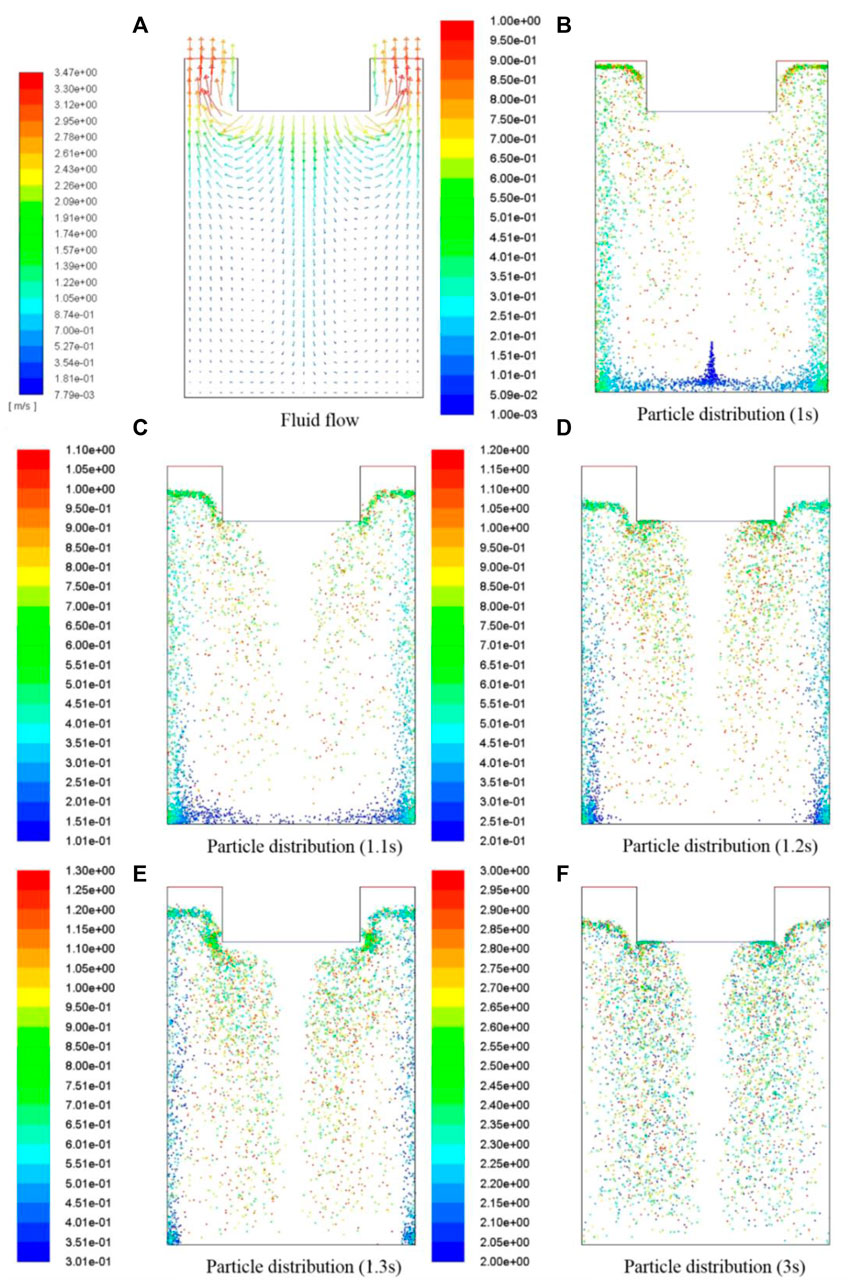
FIGURE 2. Fluid flow (A) and effect of ultrasonic vibration time on nanoparticle distribution: (B) 1 s, (C) 1.1 s, (D) 1.2 s, (E) 1.3 s, and (F) 3 s.
Two kinds of ultrasonic powers (250 W and 350 W) were applied to investigate the effect on the distribution of TiC particles, as shown in Figure 3. The ultrasonic application time was 20 s. And the acoustic streaming near the ultrasonic end face was stronger than that away from the ultrasonic end face. Attributed to the large viscosity of aluminum melt, the energy of acoustic streaming was dissipated during the propagation process. Fewer particles dispersed in the area where the acoustic pressure is strong, whereas more particles distributed in where the acoustic pressure was weak, as shown in Figure 3B. More particles were found in the lower center of the molten pool than that in the upper position. Compared with the result shown in Figure 3A, the strength of acoustic flow in the upper and lower regions of the center was decreased when the ultrasonic power was reduced to 250 W, as illustrated in Figure 3C. Here we need to emphasize that the particles in Figure 3 were not distributed individually, but agglomerated together. On the other hand, attributed to the strong convection effect in the center of the ingot, TiC particles were obviously depolymerized during casting process. While more agglomerated TiC particles were dispersed in the bottom of the ingot, especially near the edge positions. Therefore, higher power may be detrimental to the particle distribution. Regardless of the ultrasonic power, the nanoparticles in the center were always less than those in the edge. Compared with Figure 2 and Figure 3 we can see that, in the initial stage of the particle introduced into the melt, all particles were agglomerated. Thus, the depolymerization speed of initial particles changed from slow to fast with the gradual dispersion of particles. When it tended to be stable in Figure 3, the velocity was fast under the influence of strong convection. Experimental verification was conducted to verify the phenomena and conclusions of the simulation calculation in section 4.
FIGURE 3. Effect of different ultrasonic powers on particle distribution: (A,B): 350 W and (C,D): 250 W.
Experimental Validation
TiC/2219 nanocomposites reinforced by 0.9 wt% TiC nanoparticles were manufactured by the ultrasonic-assisted method for 20s. The effect of ultrasonic vibration on the microstructure of the nanocomposite was discussed. Figure 4 shows the prepared 0.9 wt% TiC/2219 nanocomposite sample. Two pieces of round block with approximately 20 mm in thickness were cut from the top and bottom of the samples. Four square blocks with a size of 20 × 20 × 20 mm were selected from the center position and the edge position of the two round blocks, as shown in Figure 4, to examine the microstructure of the nanocomposite. The square blocks located at the center were named as a and c, and the square blocks located at the edge were named as b and d, respectively. The grain size of the nanocomposite was analyzed by optical microscopy (OM; DSX50240, OLYMPUS). The samples for OM were mechanically ground, polished, and etched using Keller solution. What’s more, the distribution of TiC nanoparticles was observed by scanning electron microscopy (SEM; JSM-7600F, JEOL). The clear TiC nanoparticle morphology in the matrix was observed by transmission electron microscopy (TEM; JEM2100, JEOL). These samples with an initial thickness of 0.5 mm were grinded to 80–100 µm thickness. Then, the slices were punched into 3 mm diameter disks and thinned by an ion beam. X-ray diffraction (Rigaku 600) was used to identify the phase components of the TiC/2219Al nanocomposites. It was operated at a scanning rate of 0.02°/s at 40 kV with CuKα radiation (wavelength λKα = 1.54056 Å).
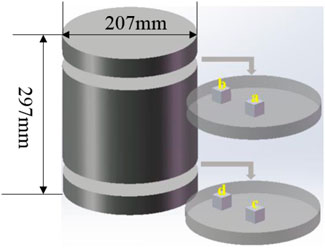
FIGURE 4. Schematic illustration of sampling positions.
Figure 5 shows the optical microscopy images of the square blocks located in Figure 4. The grain morphologies of block a and block c were fine equiaxed crystals, and the average grain sizes were 91 μm and 105 μm, respectively. However, most grains from block b and block d were dendritic crystals, with an average grain size of 96 μm and 113 μm, respectively (Figure 6). It is obvious that, the grain size of the upper part was smaller than that of the lower part. On one hand, the acoustic streaming near the end face of ultrasonic pressure was the strongest. Acoustic streaming could break larger dendrites into smaller equiaxed crystals (Liu et al., 2019; Priyadarshi et al., 2021). On the other hand, majority of TiC particles gathered in the edge position, resulting in more agglomerated clusters. It can also be seen from the simulation results shown in Figure 3. Attributed to the uniformly dispersed nanoparticles more heterogeneous nucleation sites were generated, promoting the nucleation rates during solidification process. Therefore, the grain size was smaller. However, most of the nanoparticles gathered at the edge, which were harmful to the heterogeneous nucleation (Hong Yang et al., 2019). In summary, the reason for the grain refinement in the center was the interaction of acoustic streaming and particles which acted as heterogeneous nucleation sites.
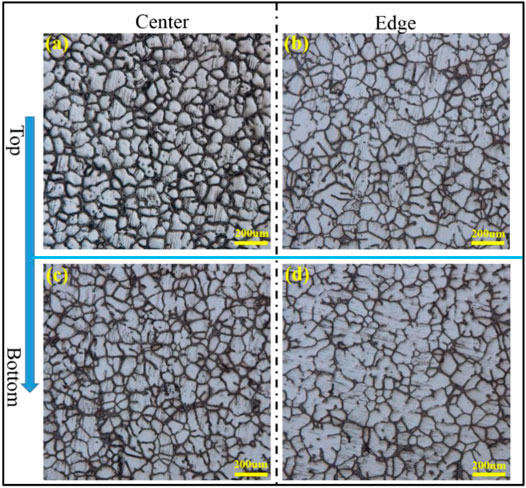
FIGURE 5. Optical microscopy images of the TiC/2219 nanocomposite at the (A) upper center, (B) upper edge, (C) lower center, and (D) lower edge positions.
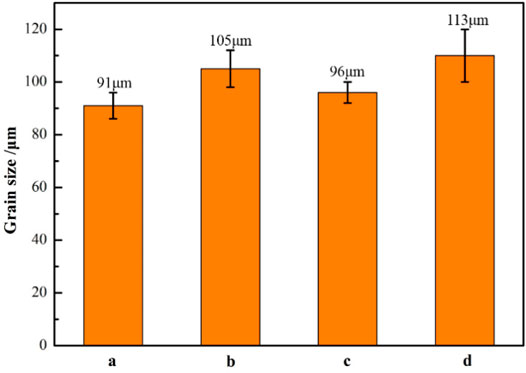
FIGURE 6. The grain sizes of block a, block b, block c, and block d.
Figure 7 shows the SEM micrographs of the blocks cut from the sample. Figures 7A,B show the SEM images of the center and edge position of the upper part of the nanocomposite, and Figures 7C,D show the SEM micrographs of the center and edge of the lower part of the nanocomposite, respectively. The number of TiC nanoparticles in the center position shown in Figure 7 less than that in the edge position both in the upper part and in the lower part of the nanocomposite, as well as the number of Al2Cu phases. Besides, discontinuous fine Al2Cu phases were generated in the center position. While they were continuous and coarse in the edge position. Thanks to the intensest acoustic streaming in the center position, more dendrites were broken to fragments. Besides, discontinuous phases were formed around the grain boundary. The acoustic streaming propagated from the center to the edge, accelerated the movement of TiC nanoparticles. As a result, fewer nanoparticles were found in the center position than those in the edge. The results of SEM micrographs were consistent with the data of the simulation in Figure 3. The white dots in Figure 7 were nanoparticles. EDS was used to identify the compositions of the white dots, as shown in Figure 7F. XRD was applied to accurately research the phases in composites. The results indicated that some Al2Cu phases and α-Al in the matrix were observed in the samples, as shown in Figure 8. In addition, it also contained more TiC nanoparticles and a minor amount of TiO2. It was difficult for XRD to detect nanoscale phases, the peaks of TiC shown in the figure may be the agglomerated TiC nanoparticles. The oxidation of TiC may result in the creation of TiO2 (Yilong Yang et al., 2019). As a consequence of merging SEM–EDS and XRD results, it was determined that the white spots in Figure 7 were TiC nanoparticles.
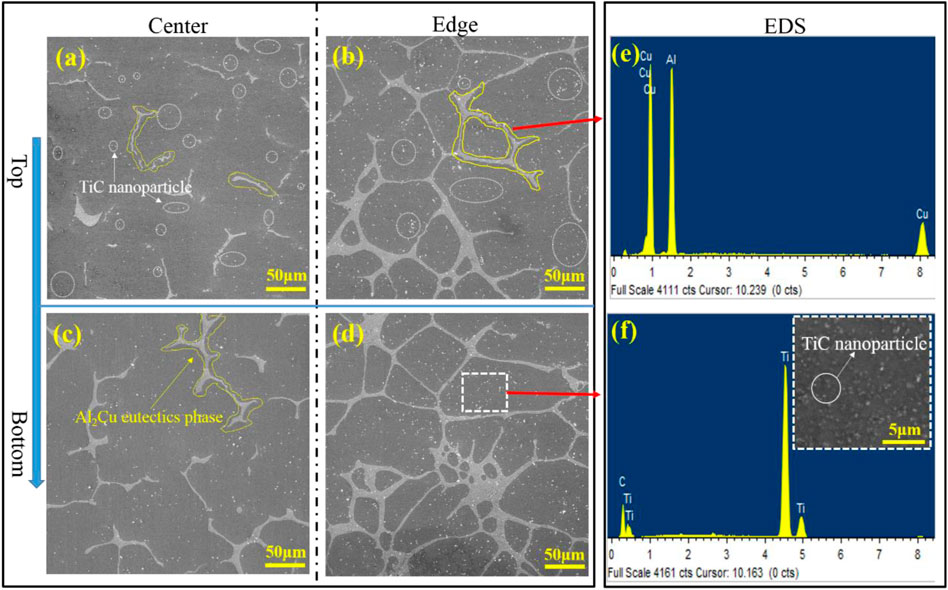
FIGURE 7. SEM micrographs of the TiC/2219 nanocomposite at the (A) upper center, (B) upper edge, (C) lower center, and (D) lower edge positions. (E, F) EDS results identifying the chemical compositions of Al2Cu phases and TiC nanoparticles.
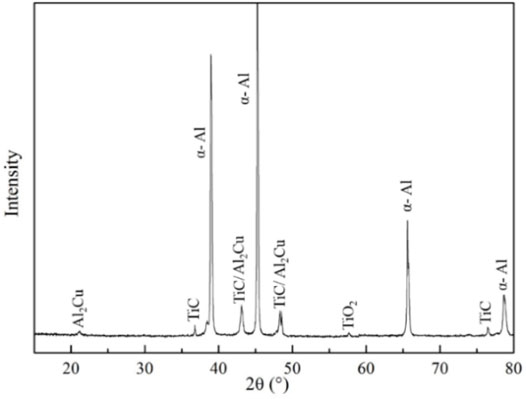
FIGURE 8. XRD patterns of the TiC/2219 nanocomposite samples extracted from the center position.
The clear morphology of TiC nanoparticles in the matrix was observed by TEM. Figure 9 shows the detailed microstructures at the nanoscale. The TiC nanoparticles and their clusters were observed in the area where they were well embedded. The sample in Figure 9A was selected from the edge position of the nanocomposite. Figure 9A shows that TiC nanoparticles were scattered in the form of local agglomeration. The sample taken from the center position of the nanocomposite shows that several single TiC nanoparticles was dispersed in the matrix without excessive agglomeration. Attributed to the ultrasonic cavitation effect, cavitation bubbles were generated once the ultrasonication was applied to the molten aluminum alloy (Yang et al., 2017; Plevachuk et al., 2008), which were beneficial to the dispersion of nanoparticles. TEM-EDS was used to identify the nanoparticle composition. Figure 9C was the magnified version of Figure 9B. The interface between the TiC nanoparticles and the aluminum matrix was clearly visible, indicating that the TiC nanoparticles added to the aluminum matrix were firmly bound.
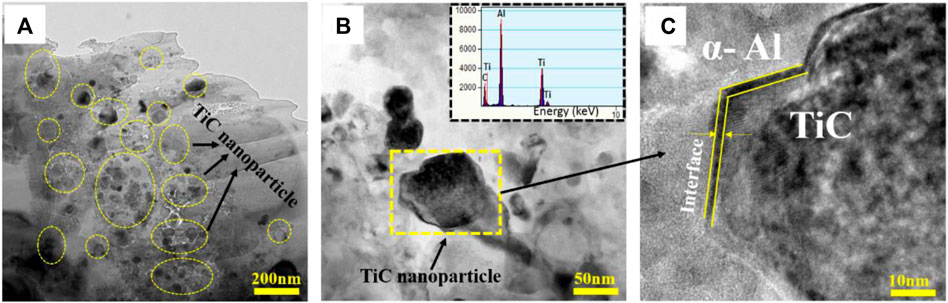
FIGURE 9. (A) and (B) TEM images illustrating the TiC nanoparticle distribution within the a-Al matrix of TiC/2219 nanocomposites; (C) Enlarged area in b.
Conclusion
In this work, the process of ultrasonic treatment was simulated by numerical simulation of cavitation-based mixing and dispersion of 0.9 wt% TiC nanoparticles in 2219 aluminum melt. The conclusions are as follows:
(1) The distribution of TiC nanoparticles in the aluminum melts (prepared by ultrasonic casting process) was investigated by the DDPM model coupled with the k-ω turbulence model. Simulation results show that the nanoparticles were well distributed in the melt. However, due to the strongest acoustic streaming effect, minor of TiC nanoparticles distributed in the center position of the composite. And the edge section exhibited the opposite characteristics, for the majority of nanoparticles tended to agglomerate around the edge position.
(2) The effect of ultrasonic power on the dispersion of nanoparticles was theoretically explored. An optimum ultrasonic power was beneficial for the distribution of the TiC nanoparticles. Besides, the nanoparticles in the center position of the nanocomposite move to the edge position driven by the stronger acoustic streaming.
(3) A small number of nanoparticles uniformly distributed in the center position of the nanocomposite, but a great density of agglomerated nanoparticles were found at the edge. This was consistent well with the simulation results. It lays a solid foundation for further experimental analysis in the future (Liu et al., 2019; Priyadarshi et al., 2021; Zhang and Nastac, 2014).
Data Availability Statement
The raw data supporting the conclusions of this article will be made available by the authors, without undue reservation.
Author Contributions
YY-L Conceptualization, Simulation calculation, Wrighting-original draft preparation; ZY: Experiment, Wrighting—original draft preparation, Foundation, Wrighting—Revised draft. ZH-M and LX-H: Foundation, Wrighting—Revised draft.
Funding
The authors are thankful for the financial support from the Science and Technology Innovation Program of Hunan Province (NO. 2020RC 2002); Natural Science Foundation of Hunan Province (NO. 2021JJ40774); Key Scientific Research Projects of Colleges and Universities in Henan Province (NO. 20A430007); Key Scientific and Technological Projects in Henan Province (NO. 212102210032) (NO. 222102230097), and Doctoral Foundation of Henan Institute of Engineering (NO. D2021008).
Conflict of Interest
The authors declare that the research was conducted in the absence of any commercial or financial relationships that could be construed as a potential conflict of interest.
Publisher’s Note
All claims expressed in this article are solely those of the authors and do not necessarily represent those of their affiliated organizations, or those of the publisher, the editors, and the reviewers. Any product that may be evaluated in this article, or claim that may be made by its manufacturer, is not guaranteed or endorsed by the publisher.
References
Adnan, M., Sun, J., Ahmad, N., and Wei, J. J. (2021). Comparative CFD Modeling of a Bubbling Bed Using a Eulerian-Eulerian Two-Fluid Model (TFM) and a Eulerian-Lagrangian Dense Discrete Phase Model (DDPM). Powder Tech. 383, 418–442. doi:10.1016/j.powtec.2021.01.063
Ayyar, A., Crawford, G. A., Williams, J. J., and Chawla, N. (2008). Numerical Simulation of the Effect of Particle Spatial Distribution and Strength on Tensile Behavior of Particle Reinforced Composites. Comput. Mater. Sci. 44, 496–506. doi:10.1016/j.commatsci.2008.04.009
Balasubramani, N., Wang, G., Easton, M. A., Stjohn, D. H., and Dargusch, M. S. (2021). A Comparative Study of the Role of Solute, Potent Particles and Ultrasonic Treatment during Solidification of Pure Mg, Mg-Zn and Mg-Zr Alloys. J. Magnes. Alloy. 9, 829–839. doi:10.1016/j.jma.2020.08.006
Chi, Y., Gong, G., Zhao, L., Yu, H., Tian, H., Du, X., et al. (2021). In-situ TiB2-TiC Reinforced Fe-Al Composite Coating on 6061 Aluminum alloy by Laser Surface Modification. J. Mater. Process. Tech. 294, 117107. doi:10.1016/j.jmatprotec.2021.117107
Ding Yuan, D., Shao, S., Guo, C., Jiang, F., and Wang, J. (2021). Grain Refining of Ti-6Al-4V alloy Fabricated by Laser and Wire Additive Manufacturing Assisted with Ultrasonic Vibration. Ultrason. Sonochem. 73, 105472. doi:10.1016/j.ultsonch.2021.105472
Emadi, P., Andilab, B., and Ravindran, C. (2021). Preparation and Characterization of AZ91E/Al2O3 Composites Using Hybrid Mechanical and Ultrasonic Particle Dispersion. Mater. Sci. Eng. A 819, 141505. doi:10.1016/j.msea.2021.141505
Eskin, G. I., and Eskin, D. G. (2003). Production of Natural and Synthesized Aluminum-Based Composite Materials with the Aid of Ultrasonic (Cavitation) Treatment of the Melt. Ultrason. Sonochem. 10, 297–301. doi:10.1016/s1350-4177(02)00158-x
Guo, B., Song, M., Yi, J., Ni, S., Shen, T., and Du, Y. (2017). Improving the Mechanical Properties of Carbon Nanotubes Reinforced Pure Aluminum Matrix Composites by Achieving Non-equilibrium Interface. Mater. Des. 120, 56–65. doi:10.1016/j.matdes.2017.01.096
Hong Yang, H., Huang, Y., Song, B., Kainer, K. U., and Dieringa, H. (2019). Enhancing the Creep Resistance of AlN/Al Nanoparticles Reinforced Mg-2.85Nd-0.92Gd-0.41Zr-0.29Zn alloy by a High Shear Dispersion Technique. Mater. Sci. Eng. A 755, 18–27. doi:10.1016/j.msea.2019.03.131
Jain, V., Kalo, L., Kumar, D., Pant, H. J., and Upadhyay, R. K. (2017). Experimental and Numerical Investigation of Liquid-Solid Binary Fluidized Beds: Radioactive Particle Tracking Technique and Dense Discrete Phase Model Simulations. Particuology 33, 112–122. doi:10.1016/j.partic.2016.07.011
Jie Yuan, J., Yao, G., Pan, S., Murali, N., and Li, X. (2021). Size Control of In Situ Synthesized TiB2 Particles in Molten Aluminum. Metall. Mater. Trans. A. 52, 2657–2666. doi:10.1007/s11661-021-06260-2
Li, G., Xu, T., Wang, H., Zhao, Y., Chen, G., and Kai, X. (2021). Microstructure Study of Hot Rolling Nanosized In-Situ Al2O3 Particle Reinforced A356 Matrix Composites. J. Alloys Compd. 855, 157107. doi:10.1016/j.jallcom.2020.157107
Liu, Z., Li, R., Jiang, R., Zhang, L., and Li, X. (2019). Scalable Ultrasound-Assisted Casting of Ultra-large 2219 Al Alloy Ingots. Metall. Mat Trans. A. 50, 1146–1152. doi:10.1007/s11661-018-5097-y
Liu, M., Zhang, C., He, H., Zhao, G., Chen, L., and Ma, X. (2020). Interface Microstructure Evolution and Mechanical Properties of the Extruded Fiber-Reinforced Aluminum-Based Composite Bar. Mater. Des. 188, 108446. doi:10.1016/j.matdes.2019.108446
Ma, L., Zhou, C., Wen, Q., Li, M., Zhong, H., and Ji, S. (2020). Ultrasonic-promoted Rapid Transient Liquid Phase Bonding of High Volume Fraction SiC Particle Reinforced Aluminum-Based Metal Matrix Composite in Low Temperature. Ultrasonics 106, 106159. doi:10.1016/j.ultras.2020.106159
Malaki, M., Xu, W., Kasar, A., Menezes, P., Dieringa, H., Varma, R., et al. (2019). Advanced Metal Matrix Nanocomposites. Metals 9, 330. doi:10.3390/met9030330
Mao, D., Meng, X., Xie, Y., Yang, Y., Xu, Y., Qin, Z., et al. (2022). Strength-ductility Balance Strategy in SiC Reinforced Aluminum Matrix Composites via Deformation-Driven Metallurgy. J. Alloys Compd. 891, 162078. doi:10.1016/j.jallcom.2021.162078
Nayak, K. C., and Date, P. P. (2021). Physical Simulation of Hot Rolling of Powder Metallurgy-Based Al/SiC Composite by Plane Strain Multi Stage Compression. Mater. Characterization 173, 110954. doi:10.1016/j.matchar.2021.110954
Peter, N., Abdollah, B., Omayma, E., Junko, U., Mohsen, H., and Katsuyoshi, K. (2020). Improved Ductility of Spark Plasma Sintered Aluminumcarbon Nanotube Composite through the Addition of Titanium Carbide Microparticles. Mater. Sci. Eng. A. 795, 139959. doi:10.1016/j.msea.2020.139959
Plevachuk, Y., Sklyarchuk, V., Yakymovych, A., Eckert, S., Willers, B., and Eigenfeld, K. (2008). Density, Viscosity, and Electrical Conductivity of Hypoeutectic Al-Cu Liquid Alloys. Metall. Mat Trans. A. 39, 3040–3045. doi:10.1007/s11661-008-9659-2
Priyadarshi, A., Khavari, M., Bin Shahrani, S., Subroto, T., Yusuf, L. A., Conte, M., et al. (2021). In-situ Observations and Acoustic Measurements upon Fragmentation of Free-Floating Intermetallics under Ultrasonic Cavitation in Water. Ultrason. Sonochem. 80, 105820. doi:10.1016/j.ultsonch.2021.105820
Rao, T. B. (2021). Microstructural, Mechanical, and Wear Properties Characterization and Strengthening Mechanisms of Al7075/SiCnp Composites Processed through Ultrasonic Cavitation Assisted Stir-Casting. Mater. Sci. Eng. A 805, 140553. doi:10.1016/j.msea.2020.140553
Shangqin Yuan, S., Li, S., Zhu, J., and Tang, Y. (2021). Additive Manufacturing of Polymeric Composites from Material Processing to Structural Design. Composites B: Eng. 219, 108903. doi:10.1016/j.compositesb.2021.108903
Shao, Z.-w., Le, Q.-c., Zhang, Z.-q., and Cui, J.-z. (2011). Numerical Simulation of Acoustic Pressure Field for Ultrasonic Grain Refinement of AZ80 Magnesium alloy. Trans. Nonferrous Met. Soc. China 21, 2476–2483. doi:10.1016/s1003-6326(11)61039-x
Shashi, B. (2020). Numerical Simulation of the Debonding Behavior of Fiber Reinforced Metal Matrix Composites. Mater. Today Proc. 04, 598.
Tonry, C. E. H., Djambazov, G., Dybalska, A., Griffiths, W. D., Beckwith, C., Bojarevics, V., et al. (2020). Acoustic Resonance for Contactless Ultrasonic Cavitation in alloy Melts. Ultrason. Sonochem. 63, 104959. doi:10.1016/j.ultsonch.2020.104959
Yang, Z., Wang, A., Weng, Z., Xiong, D., Ye, B., and Qi, X. (2017). Porosity Elimination and Heat Treatment of Diode Laser-Clad Homogeneous Coating on Cast Aluminum-Copper alloy. Surf. Coat. Tech. 321, 26–35. doi:10.1016/j.surfcoat.2017.04.027
Yilong Yang, Y., Liu, Z., Jiang, R., Li, R., and Li, X. (2019). Microstructural Evolution and Mechanical Properties of the AA2219/TiC Nanocomposite Manufactured by Ultrasonic Solidification. J. Alloys Compd. 811, 151991. doi:10.1016/j.jallcom.2019.151991
Zhang, D., and Nastac, L. (2014). Numerical Modeling of the Dispersion of Ceramic Nanoparticles during Ultrasonic Processing of Aluminum-Based Nanocomposites. J. Mater. Res. Tech. 3, 296–302. doi:10.1016/j.jmrt.2014.09.001
Zhang, J., Zhang, D., Zhu, H., and Xie, Z. (2020). In-situ TiC Reinforced Al-4Cu Matrix Composite: Processing, Microstructure and Mechanical Properties. Mater. Sci. Eng. A 794, 139946. doi:10.1016/j.msea.2020.139946
Keywords: aluminum matrix nanocomposite, CFD ultrasonic cavitation model, TiC nanoparticle distribution, experiment, microstructure
Citation: Yi-Long Y, Yun Z, Hao-Ming Z and Xu-He L (2022) Numerical Modeling and Experimental Validation of TiC Nanoparticle Distribution During the Ultrasonic Casting Process of 2219 Aluminum Matrix Nanocomposites. Front. Mater. 9:862601. doi: 10.3389/fmats.2022.862601
Received: 26 January 2022; Accepted: 21 March 2022;
Published: 13 April 2022.
Edited by:
Peng Cao, The University of Auckland, New ZealandReviewed by:
Rajkumar Kaliyamoorthy, SSN College of Engineering, IndiaShenglu Lu, RMIT University, Australia
Copyright © 2022 Yi-Long, Yun, Hao-Ming and Xu-He. This is an open-access article distributed under the terms of the Creative Commons Attribution License (CC BY). The use, distribution or reproduction in other forums is permitted, provided the original author(s) and the copyright owner(s) are credited and that the original publication in this journal is cited, in accordance with accepted academic practice. No use, distribution or reproduction is permitted which does not comply with these terms.
*Correspondence: Zhang Yun, eXVuX3poYW5nNjZAMTYzLmNvbQ==