 D. Brands
 S. Wijskamp
 W. J. B. Grouve1*
 R. Akkerman
- 1Production Technology, Faculty of Engineering Technology, University of Twente, Enschede, Netherlands
- 2ThermoPlastic Composites Research Center (TPRC), Enschede, Netherlands
Through an improved characterization methodology, this work contributes to better prediction quality in composite forming simulations for unidirectional thermoplastic composites. A better understanding of the forming behavior will aid in the adoption of these lightweight materials in aerospace applications. The bias extension method was implemented and applied to cross-ply laminates from unidirectional carbon fiber reinforced thermoplastic materials to characterize the in-plane shear deformation resistance of the molten material. Two commercially available materials were characterized at three rates and three temperatures. The shear deformation was measured directly on the specimen throughout the test using a video extensometer, avoiding the use of the pin-jointed net assumption to relate deformation to the clamp displacement. In addition, the distribution of shear deformation over the specimen surface was characterized after the test using image analysis. The observed deformation was similar to the typical deformation for woven materials, with some agreement to the pin-jointed net assumptions but also some identified deviations. Localization of shear deformation along the fiber direction of the outer ply was observed to occur at approximately 15° shear angle. The proposed bias extension method directly relates the measured force to the deformation on the specimen, ensuring the characterization of the correct deformation mechanism. This key benefit of the bias extension method solves a common issue found in other characterization methods for in-plane shear on the molten material.
1 Introduction
Composite forming simulations have become a useful tool for designers of parts and processes. By predicting the outcome of the manufacturing process, simulation software allows for virtual part and process optimization that can avoid time-consuming and costly design iterations on the shopfloor. Processing defects concerned with forming, consolidation, and shape distortions need to be predicted accurately for these tools to be effective. The most elaborate model descriptions are currently found in finite element-based forming simulations that consider the underlying physics, and that can accurately represent the tool and blank geometry, as well as the boundary conditions (Dörr et al., 2017). The accuracy of these models heavily relies on the quality of the material characterization, which serves as input for the constitutive models. This work aims to improve the experimental characterization for forming of unidirectional (UD) thermoplastic tape materials.
The origin of this work is found in hot press forming of fiber-reinforced thermoplastic composites for the aerospace industry. With forming of woven materials being relatively well established, the current trend is towards the use of UD tapes because of benefits in terms of improved mechanical performance and potential for process automation (Sloan, 2019). However, the application of UD tape materials for larger or more complex parts, in terms of both geometry and layup, comes with the risk of inducing wrinkling defects during the process. Improved prediction of wrinkling in forming simulations would therefore aid the aerospace industry to adopt UD materials and use their potential in more challenging applications.
This article addresses the characterization methodology for the in-plane shear deformation of UD thermoplastic composites at forming conditions. An overview of previous research was provided by Haanappel and Akkerman (2014) and Harrison et al. (2005), indicating that various methods have been applied over a relatively large timespan with varying degree of success. It appears that challenges include having a representative specimen at the right conditions, achieving proper load introduction, and triggering the appropriate material deformation. Methodologies have since continued to evolve. The torsion bar method as introduced by Haanappel and Akkerman (2014) initially featured an oscillatory loading with small deformation but was later refined with the use of a transient loading and large deformations. This transient torsion bar method became a frequently used method at the TPRC and was also applied in the work of Dörr et al. (2018). Another method based on the off-axis tensile test, introduced by Potter (2002a), was recently used by Wang et al. (2020) to characterize in-plane shear on a thermoset prepreg. Bending methods may also provide results that can be compared to in-plane shear methods since the dominant deformation in both is longitudinal intra-ply shear, which is clearly illustrated in the work of Dykes et al. (1998). Therefore, bending characterization methods like those featured in Margossian et al. (2015) and Sachs and Akkerman (2017) may also be of interest in the current context. A recurring issue with many of the characterization methods for composite forming is the inability to isolate the desired deformation mechanism. In practice, the measured response is caused by a combination of mechanisms, complicating subsequent constitutive modeling. As such, the validity of the imposed deformation mechanism will therefore receive additional attention in this research.
To date, no standard is available for the in-plane shear characterization of UD materials, while the picture frame and bias extension methods are well established and accepted by the scientific community for fabric composite materials (Cao et al., 2008; Boisse et al., 2017). Early work by McGuinness and ÓBrádaigh (1998) shows that the picture frame method can be applied to thermoplastic UD prepreg, in both cross-ply and true unidirectional layups, but can be quite cumbersome. To the authors’ knowledge, however, no reports have been published yet on the successful application of the bias extension method to thermoplastic UD prepregs. Interestingly, works by Potter (2002b) and Larberg et al. (2012) do show the applicability of bias extension on UD prepregs with a thermoset matrix in a cross-ply layup.
The objective of this article is to demonstrate the application of the bias extension method on cross-ply UD thermoplastic composite specimens at forming conditions. The novelty of this work lies in the combination of the method and material. A second aspiration is to provide characterization datasets that can be used to develop constitutive models for input in composite forming simulations. The benefit of the bias extension method is the use of a representative specimen at forming conditions with loading that is representative for real forming processes. However, the typical pin-jointed net behavior observed in woven fabrics with interlocking fiber is not guaranteed in the case of UD materials because of specific spurious deformations that can occur for these materials, such as flow transverse to the fiber direction and relative slip between plies. Therefore, specimen deformations have been analyzed in this research to see if the appropriate in-plane shear deformation mechanism was dominant. This article is an extension of the preliminary results presented at the ESAFORM 2021 conference (Brands et al., 2021) and expands it with larger characterization datasets that include effects of temperature, insight into repeatability, improved clamping, and analysis on the onset of localization.
2 Materials and Methods
2.1 Bias Extension
An elaborate discussion of the bias extension test can be found in dedicated publications (Cao et al., 2008; Boisse et al., 2017), and a brief general description is provided here. The bias extension method features a specimen with a rectangular gauge section and fibers in 45° and −45° directions with respect to the loading direction, as is schematically illustrated in Figure 1A. The initial gauge length H needs to be at least twice the specimen width W to prevent fibers from making a direct connection between the clamps. The specimen is clamped at either end and extended in the length direction. Figure 1B shows that the typical deformation consists of a homogeneous shear deformation in the center (I), two undeformed triangular regions near the clamps (III), and four triangular transition zones (II) with half the amount of deformation compared to the center section. The deformation often closely resembles that of a pin-jointed net (PJN), which assumes inextensible fibers rotating at the cross-over points.
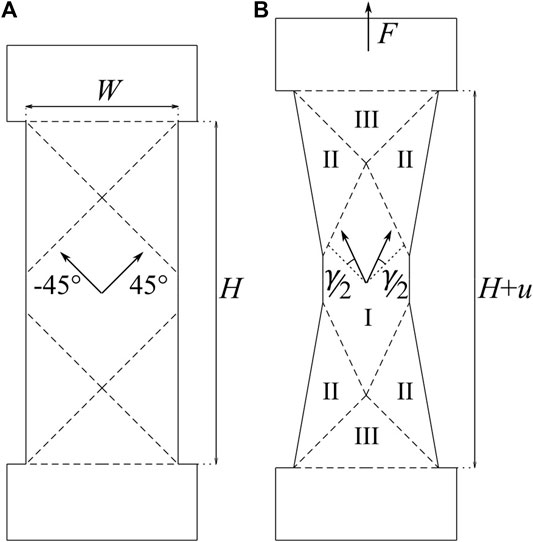
FIGURE 1. Schematic drawing of the bias extension specimen. (A) Before deformation and (B) theoretical deformation according to a pin-jointed net. The arrows indicate the local fiber direction.
According to the pin-jointed net assumption, the shear angle
respectively (Boisse et al., 2017), using gauge length
The ability to introduce in-plane shear deformation in a straightforward manner is clearly a benefit of this method. However, having two distinct deformations in zones I and II does complicate the analysis.
2.2 Materials
Two commercially available carbon fiber reinforced UD thermoplastic tapes were used in the experiments. Toray TC1225 contains T700 fibers in a low-melt PAEK matrix (Toray Advanced Composites, 2020), and Solvay APC has AS4D fibers in a PEKK-FC (fast crystalizing) matrix (Solvay Composite Materials HQ, 2017). Both materials were supplied in a 12” roll format. The relevant material characteristics are collected in Table 1.
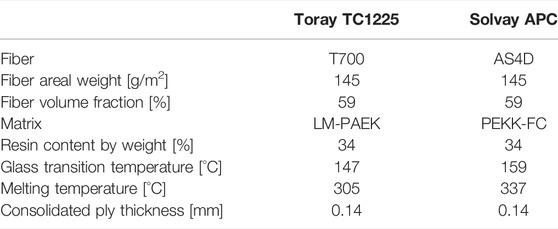
TABLE 1. Overview of material characteristics, from Solvay Composite Materials HQ (2017) and Toray Advanced Composites (2020).
2.3 Specimen Preparation
Laminates, comprised of 8 plies in a [45/−45]2s layup, were press consolidated inside a 12” picture frame mold. TC1225 was consolidated at 365°C and 15 bar for 30 min, while APC was consolidated at 376°C and 20 bar for 20 min. Three laminates, separated by caul sheets, could be processed in a single cycle. The Marbocoat 227CEE release agent was applied to all mold surfaces for easy release. After consolidation, the laminate edges were trimmed using a water-cooled diamond-coated saw to enable vacuum clamping of the flat laminate on a milling machine. The average laminate thickness after consolidation was 1.124 ± 0.015 mm and 1.130 ± 0.018 mm for TC1225 and APC, respectively.
Three bias extension specimens were cut from each laminate using a CNC milling machine, with specimen dimensions according to Figure 2A. The specimen length direction is aligned with the edge of the laminate to maintain the [45/−45]2s layup. A dog-bone shaped specimen was used to increase the reliability of clamping and improved load introduction.
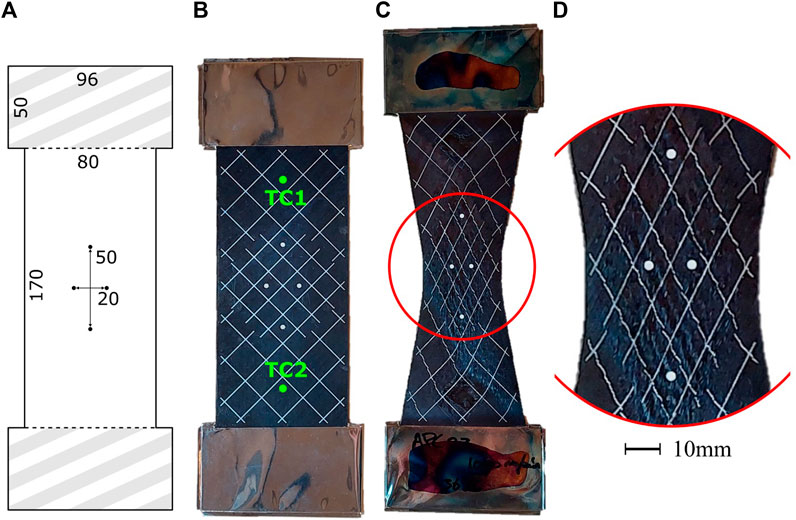
FIGURE 2. From left to right. (A) Specimen dimensions in millimeters. Shaded area will be clamped. (B) Specimen prepared for bias extension testing, location of two thermocouples indicated (TC1 and TC2). (C) Deformed specimen after bias extension testing. (D) Zoom of the central area with localization visible from the jagged lines.
A paint pattern was applied to enable deformation measurements during and after testing. Masking tape was applied over the entire specimen, and laser cutting was used to precisely cut a pattern for a paint mask. The laser cutting settings were tuned to cut the masking tape only. Then, heat-resistant spray paint was used to color the lines in silver and the dots in white, and the result is shown in Figure 2B. The reflective silver paint was filtered out by the video extensometer algorithm, enabling an improved detection of the white dots for strain measurements.
Reliable clamping was promoted by applying metal foil, 25 μm thick, over the clamped areas with 10 mm excess foil on the sides. The excess material was removed in the gauge section, and the remaining edges were folded over twice to prevent squeeze out during testing. Figure 2B shows the prepared specimen with metal foil clamping protection.
The specimens were dried at 120°C overnight (>12 h) to minimize deconsolidation during testing, adopted based on the recommendation of (Slange et al., 2018). Dried specimens were tested within 8 h after removing them from the oven. The authors note that it is possible to apply the method without drying but have observed minor delaminations, which could lead to inhomogeneous deformation and scatter in results. Because drying could have a pronounced effect on the results, the current characterization is only valid for forming processes that employ dried laminates. The influence of material conditioning on forming behavior requires additional research.
2.4 Experimental Method
An Instron universal testing machine was fitted with clamps for bias extension, as shown in Figure 3. The clamps consist of two flat metal plates, 100 × 50 mm2 in dimension, with one moving side to close the clamp manually using a bolt. A climate chamber surrounds the setup to enable heating, with a rod connecting the upper clamp to the 1 kN force transducer outside the chamber. An Instron AVE2 video extensometer is connected to the door of the climate chamber to record the deformation of the specimen through the looking glass.
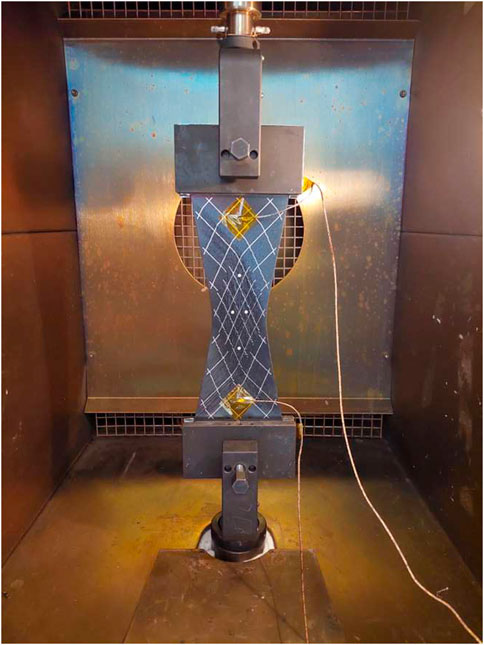
FIGURE 3. Deformed specimen after testing, secured in the clamps with thermocouples attached.
For each test, two thermocouples were attached to the surface of the specimen to verify the temperature at the top and bottom of the specimen; the locations of the thermocouples are indicated in Figure 2B. Then, the specimen with thermocouples was quicky placed between the clamps in the preheated climate chamber. The clamps were tightened by hand with medium force to prevent excessive squeeze out of the tape material. Figure 3 shows a clamped specimen (after testing).
The specimen was heated for 4 min. Typically, the melting temperature was reached within the first minute, while the last minute is considered dwell time as temperature changes were minimal. The desired temperature was achieved within ±5°C on the thermocouples, with the bottom always having a slightly higher temperature than the top due to the location of the specimen in the convection oven. The oven air temperature was set 5–10°C higher than the test temperature to reach the desired temperature values on the thermocouples. A minor change was made to the heating procedure for APC at 345°C since this temperature is just above the melting temperature of the polymer. For this condition, the specimens were first heated to 350°C before slowly settling towards 345°C while keeping the total heating time fixed at 4 min. This modification was employed to ensure that the specimen was fully molten before testing.
After the predefined heating time, a constant speed was imposed on the top clamp up to a displacement of 27.6 mm, applying a theoretical 45° shear deformation according to Eq. (1) for the PJN assumptions. Figure 2C and Figure 3 show a deformed specimen after testing. The extension force and the resulting shear deformation in the center of the specimen (see Section 2.5.1) are considered the main outcomes of this characterization test. Additionally, after reaching the final displacement, the force and deformation were measured for another 10 s to record the relaxation behavior.
The test matrix employed in this study includes the two beforementioned materials. Three distinct temperatures were used, namely, 345, 365, and 385°C. Also, three test rates are applied, namely, 100, 400, and 1,000 mm/min. Three specimens were tested for each condition to verify repeatability.
2.5 Deformation Measurements
2.5.1 Extensometer
The video extensometer tracked four dots on the specimen throughout the bias extension test, measuring the longitudinal and transverse strain,
2.5.2 Shear Angle Distribution
A second deformation measurement was included that quantifies the distribution of shear deformation over the gauge section of the specimen. This additional analysis step is not required for the characterization of the material but was added to the research in order to learn about the deformation behavior of cross-ply UD laminates. Any spurious deformations detected using this analysis could argument against the pin-jointed net assumptions that are typically used in modeling of the bias extension test.
After testing, pictures were taken of the deformed specimens at 12× optical zoom to obtain orthographic images. A pattern of dots in the background was used to infer the scale of the image, whereafter a mesh was constructed between the cross sections of the silver lines. The deformation can be quantified by comparing the deformed mesh against the known locations of the silver lines before deformation. The same procedure was used and described in a previous publication (Brands et al., 2021).
The shear angle can be quantified by calculating the deformation gradient for each triangular element in the mesh using
where
Subsequently, the shear angle
2.5.3 Onset of Localization
Finally, a third deformation analysis involves processing of the saved footage from the video extensometer to examine the onset of localization. This inhomogeneous deformation is readily observed from the discontinuous silver lines on the deformed specimen after the test, as illustrated in Figure 2D. However, the previous two methods are unable to identify the onset and progression of localization because it occurs on a smaller scale than considered in those analyses.
Still pictures from the video extensometer were saved approximately 10 times per second during testing. The silver lines are hardly visible in these pictures due to the built-in reflection filtering of the system but could be retrieved by contrast stretching based on a portion of the picture with only lines. This allows observation of any discontinuities in the lines during testing. The accompanying shear angle was retrieved by calculating the longitudinal and transverse strain between the white points followed by interpolation in the measurement data. The shear angle at which the onset of localization occurs can be estimated based on the processed picture where significant discontinuities in the silver lines become apparent.
2.6 Data Averaging
Three repetitions for each setting were included in the test matrix. Experimental data from the same settings were interpolated over 50 equidistant points in time to enable the calculation of a mean and standard deviation to simplify visualization. The results for individual specimens are available in the dataset published alongside this article. The error bars represent one standard deviation around the mean value unless stated otherwise.
3 Results
3.1 Bias Extension Characterization
Figure 4 shows the average force per ply over the average shear angle, as measured by the video extensometer, for both materials for the three rates and temperatures. The standard deviation is indicated by the shaded area in the figure, suggesting a good repeatability of the experiment for most settings. The results for both materials show a significant dependence of the measured force on the rates and temperatures applied, with higher forces measured at higher rates or lower temperatures. It is noted that the largest standard deviations are found for APC at 345°C, which also used a modified heating procedure because it is close to the melting temperature of the material.
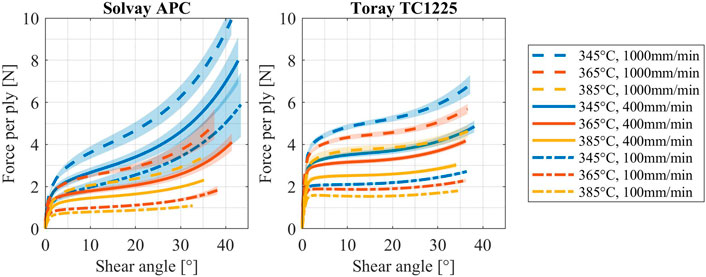
FIGURE 4. Bias extension characterization results for Solvay APC and Toray TC1225. The shaded areas indicate one standard deviation around the mean based on three measurements.
The curves in Figure 4 all have a signature s-shape, starting with a steep slope from the origin with a smooth transition in the first 5–10° of shear towards a region of low to moderate slope, which extends up to 20–25°, whereafter the slope increases again. The smooth transition at small deformations is a bit quicker for the TC1225 material compared to the APC material, whereas the initial slope appears to be steeper. The incline at 10° shear angle positive for TC1225 at 345°C and near zero for 365°C and even shows a minor decline at 385°C. For APC, all slopes at 10° of shear are positive but much higher for 345°C than for the other two temperatures. The increase in force observed after 25° of shear is most significant for lower temperatures and higher rates.
The obtained characterization results demonstrate the applicability of the bias extension method for cross-ply UD laminates in molten condition. Repeatable results with acceptable variability can be obtained, which show a clear dependence of the material behavior on the temperature and test rate. Large in-plane shear deformation was introduced, which will be analyzed more in-depth in the next sections.
3.2 Deformation Measurements
3.2.1 Extensometer
Figure 5 shows the shear angle, as measured by the extensometer, related to the cross-head displacement. The black dashed line indicates the expected shear angle according to the pin-jointed net theory through Eq. (1). The shaded areas indicate one standard deviation around the mean based on three repetitions. Due to the variability, no clear correlation is found between the test rate and the deformation. However, the amount of shear deformation recorded by the extensometer does seem to decrease at higher temperatures, which is most pronounced for the APC material. In the case of TC1225, the observed deformation is consistently lower than predicted by the pin-jointed net assumptions, with the deviation becoming more significant for large deformations, which is also consistent with earlier findings (Potter, 2002b; Machado et al., 2016). The deformation in APC follows the same trend as TC1225 but is much more temperature dependent; at 345°C, the measured shear angle even exceeds the pin-jointed net prediction.
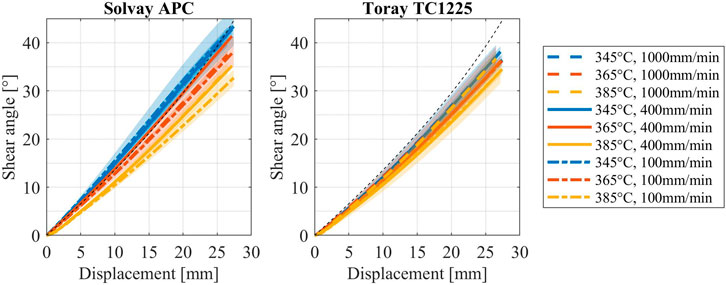
FIGURE 5. Shear angle measured by the video extensometer related to the cross-head displacement. The black dashed line indicates the theoretical shear angle according to pin-jointed net (PJN) assumptions (Eq. 1). The shaded areas indicate one standard deviation around the mean based on three measurements.
The deformation measured on the surface of the specimen is believed to be representative for the deformation throughout the thickness of the specimen since the edges of the specimens did not show significant signs of ply slip. It is also noted that global out-of-plane buckling of the specimen, which could invalidate the measurement result, did not occur during any of the conducted experiments. Minor local out-of-plane buckling was observed on the final deformed specimens in a few locations but is regarded as insignificant in the analysis of the specimen deformations.
3.2.2 Shear Angle Distribution
An overview of all obtained shear angle distributions after the test is shown in Figure 6, with some enlarged examples shown in Figure 7. The typical deformation for bias extension, according to the pin-jointed net, is readily observed, with the triangle near the clamps (III) having hardly any deformation and four intermittent areas (II) with half the amount of shear compared to the center (I).
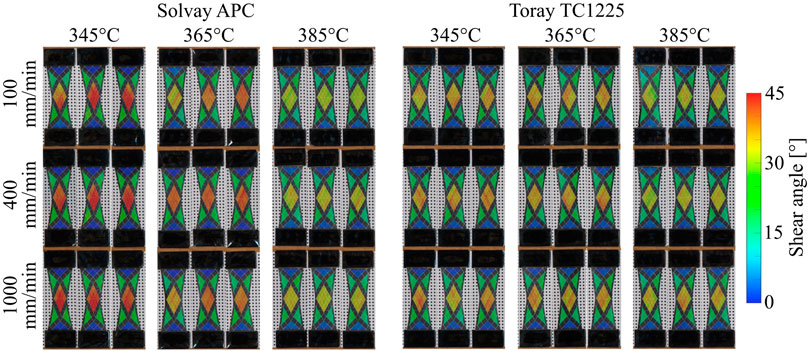
FIGURE 6. Shear angle distribution after the test, overview of all specimens. Note: Colors are half transparent overlay on specimen pictures leading to a darker appearance.
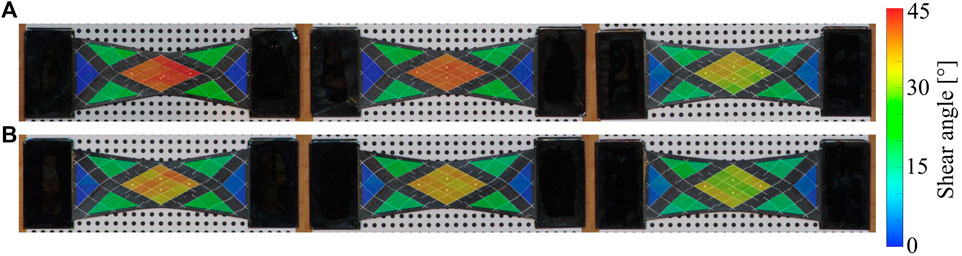
FIGURE 7. Shear angle distribution after the test, enlarged examples. (A) Solvay APC. (B) Toray TC1225. From left to right: 345, 365, and 385°C. Test rate: 400 mm/min. Note: Colors are half transparent overlay on specimen pictures leading to a darker appearance.
Figure 8A shows the average shear deformation in the central area I for all conditions tested. Interestingly, it is again observed that the final shear angle in region I depends strongly on temperature for APC and shows only a minor reduction at 385°C for TC1225. The same was concluded from the video extensometer results. In fact, the average shear angle in area I from the current analysis, which is performed after the test, differs little from the deformation at the end of the bias extension test as measured by the video extensometer. This indicates that little deformation has taken place between the end of the test and solidification of the specimen. Like in the video extensometer results, also no clear influence of the test rates on the central shear angle was observed here.
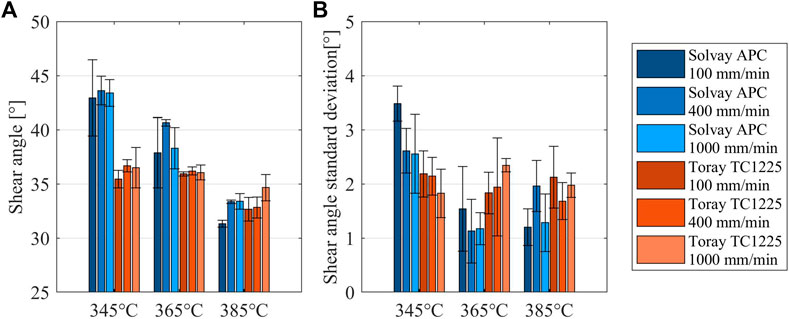
FIGURE 8. Final deformation in the central area I for all conditions tested. (A) Mean shear angle. (B) Standard deviation of the shear angle distribution, as a measure for homogeneity.
Figure 8B shows the standard deviation of the shear angle, as a measure to characterize the inhomogeneity, in the central area I for all conditions tested. A standard deviation of approximately 1–3° was found for the shear deformation in the central area, with no clear influence of the test temperature or rate. The highest inhomogeneities are found for APC at 345°C, which all seem to have a noticeable pattern in Figure 6, with consistently higher shear angles near the bottom clamp. Presumably, this is related to the temperature distribution over the specimen, with the bottom being consistently 6–8°C warmer than the top. Apparently, this temperature difference has had a significant role in combination with the close proximity to the melting temperature. Perhaps, a more even temperature distribution could have resulted more homogenous deformation. The inhomogeneous deformation found for the other settings could not be related to the test conditions directly and might arise from variability in clamping and loading or from the material itself.
The distribution of shear deformation over the different areas of the specimen is shown in Figure 9 for two material and three temperatures. Results were averaged over three rates and three repetitions to focus on studying the effect of temperature. The shear angle in area I was already discussed, but the same trend in temperature is also observed for area II. According to the PJN, the ratio between shear angles in areas I and II should equal exactly two, but Figure 9B shows that this ratio was found to be slightly less than two in the measurements, indicating that the shear angle in area II is slightly more than half of the value in area I. The PJN also predicts zero deformation in area III, whereas Figure 9A shows that some minor deformation was still observed. A higher temperature seems to allow for more spurious deformation in area III, which could be a possible reason for a lower shear angle in area I. Also, the amount of deformation in area III seems to correlate with a lower ratio between the shear angles in areas I and II.
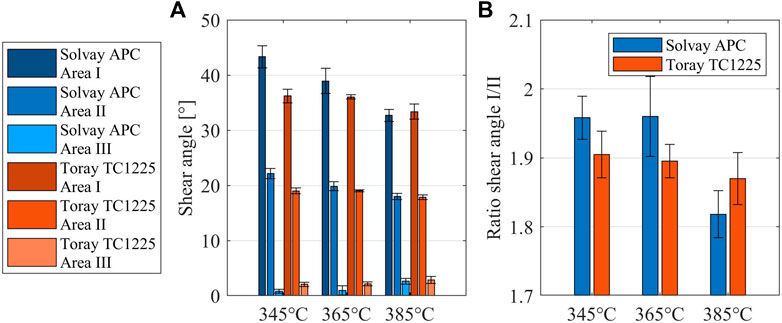
FIGURE 9. Deformation distribution for different test temperatures, averaged over three test rates and three repetitions. (A) Mean shear angle for areas I, II, and III. (B) Ratio between shear angles in areas I and II.
Overall, the distribution of deformation over the bias extension specimens did not reveal any major deviations from the pin-jointed net theory, i.e., the typical deformation regimes are observed and have reasonably homogenous deformation with a shear angle ratio of approximately two between the areas. The test temperature does seem to have a significant effect on the amount of deformation and its distribution, where spurious deformations become more predominant at higher temperatures.
3.2.3 Onset of Localization
The gridlines on the deformed specimen show discontinuities that indicate inhomogeneous shear deformation along the fiber direction of the outer ply. Figures 2C and D show one of the specimens as an example where jagged lines indicate localization at higher shear angles. The localized deformation occurs on a scale smaller than the grid cell size and with frequent spacing such that the macroscopic deformation appears homogenous. However, on a micro-scale, the deformation will no longer be uniform, which should affect the way the materials’ in-plane shear resistance is perceived. All specimens tested had a comparable degree of localization, being most prominent in the central area but also present in the four adjacent areas.
Footage saved by the video extensometer was post-processed to detect the lines otherwise filtered out by the system. An accompanying shear angle value was found by using the deformation between the dots and interpolation within the measured data. Figure 10 shows a selection of the resulting images from a single specimen as an example. The analysis provides a visual means to detect the onset of localization in the center area throughout the bias extension test. Unfortunately, developing a quantitative measure for the localization deemed troublesome due to low picture quality after contrast enhancement; therefore, the onset of localization could only be estimated manually using these results.
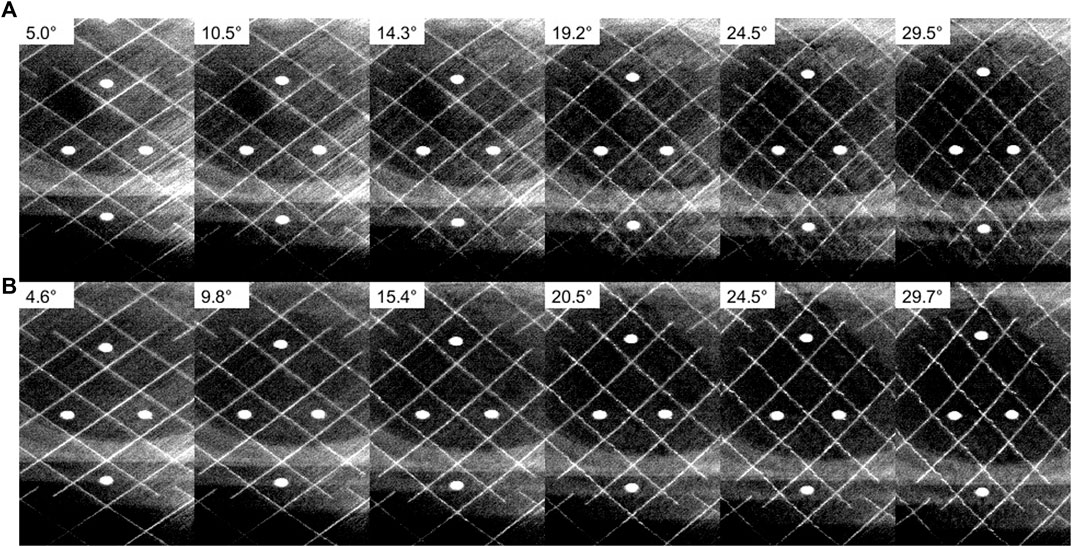
FIGURE 10. Post-processed footage from the video extensometer throughout the bias extension test to enable the visual inspection of the onset of localization. The jagged lines indicate the localization of shear deformation along the fiber direction of the outer ply. (A) Solvay APC 345°C 100 mm/min. (B) Toray TC1225 345°C 100 mm/min.
Visual inspection of the obtained images reveals that the onset of localization, detected as pronounced jaggedness of the lines, happens approximately halfway through the measurement. The lines are generally still smooth and continuous for images up to 10° of shear, while images above 20° of shear have clear signs of localization. At 15° of shear, the images for APC do not indicate much localization yet, whereas the images for TC1225 already have minor signs of localization. Therefore, 15° of shear would seem a reasonable estimate for the onset of localization, with the remark that it occurs at smaller deformation for TC1225 compared to APC. No correlation was found between the onset or degree of localization and the test parameters.
3.3 Relaxation
Relaxation measurements were obtained by recording data for an additional 10 s after ending the bias extension test. Figure 11 shows how the pulling force diminishes over time as the clamps remain stationary. All curves in this figure have a steep initial drop and a gradual transition to a seemingly constant residual force, once more highlighting the viscoelastic material behavior.
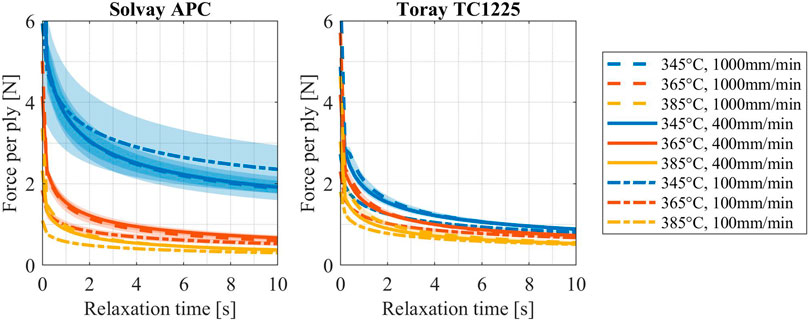
FIGURE 11. Relaxation of the force per ply over time after the bias extension test. The shaded areas indicate one standard deviation around the mean based on three measurements.
The bias extension method can thus capture more information about the material behavior by incorporating the relaxation measurement. However, the deformation history at the start relaxation is different for each specimen because the shear deformation is not directly controlled. Moreover, different rates and temperatures also result in a different stress state at the start of relaxation, further complicating the analysis. For this reason, additional research is recommended on the incorporation of a relaxation measurement into the bias extension test method, with a proper regard for the deformation history. However, the relaxation results can still be used in the design and development of advanced viscoelastic constitutive models for in-plane shear, if the unique deformation history for each specimen is taken into account. The dataset published alongside this article can be used as a starting point for this purpose. The main focus of a constitutive model for in-plane shear should be towards the start-up and steady deformation processes such as those encountered during press forming. However, path dependencies as observed from the relaxation measurements may also be relevant for composite deformations during forming.
4 Discussion
Consecutively, the applicability of the method, the implementation of heating and clamping, the obtained characterization results, and the observed deformations are discussed.
4.1 Application of the Bias Extension Method
This article is aimed at demonstrating the applicably of the bias extension method to characterize in-plane shear for thermoplastic UD materials. However, previously Haanappel and Akkerman (2014) have already stated that their attempts using the bias extension method on a similar type of material were unsuccessful due to the weak integrity of the laminate at high temperature, despite the use of a cross-ply layup. A comparison between this previous implementation and the current one has taught us that the measurement hardware, specimen design, and material conditioning all play an important role in the successful application of this methodology. Most critical appear to be the heating and clamping of the specimen, which will be discussed in more detail in the next section. The increased specimen thickness and use of the drying treatment are also believed to have promoted laminate integrity but were not found to be the main cause for a successful application.
The in-plane shear kinematics observed for the stack of UD plies in the presented bias extension results is similar to the kinematics of a woven fabric and closely resembles a pin-jointed net up to relatively large deformations. A singular UD ply in melt lacks the structural integrity in the transverse direction to deform in the trellis shear deformation; thus, an additional ply is required with fiber in the transverse direction to form a cross-ply layup. The bonding between the adjacent plies ensures that the individual plies remain intact under shear loading and causes the deformations of the plies to be interconnected. The friction between UD plies therefore plays a similar role to the interlocking of tows in a woven fabric. The in-plane loading of the cross-ply specimen in the bias direction (middle of the two fiber directions) thereby only promotes the in-plane shear deformation because other in-plane directions are dominated by inextensible fibers.
As mentioned in the introduction, a variety of other measurement methods has been used in past research to measure the in-plane shear resistance of thermoplastic UD composite materials (Harrison et al., 2005; Haanappel and Akkerman, 2014). None of these methods provide the means to validate to what extent the measured response is caused by the desired deformation mechanism. A key benefit of the proposed bias extension methodology is that the measured force is directly related to the desired in-plane shear deformation, which is verified using an extensometer and image analysis. The certainty of measuring the correct deformation and being able to quantify the amount of deformation in-situ provides reliable characterization data. Additionally, the bias extension method is conceptually simple to implement and well established for the in-plane shear characterization of composite materials with woven reinforcements.
4.2 Implementation of Heating and Clamping
Specimen conditioning and load introduction have proven difficult during the development of the presented bias extension method, and both will be briefly discussed in this section. The first challenge was to heat the specimen homogenously to the desired temperature before the start of the test, and, at the same time, preventing degradation of the polymer by keeping the heating and dwell times to a minimum. Overall, the high heating rate and short dwell times used came with the risk of an inaccurate and inhomogeneous temperature distribution. Especially, the area in the vicinity of the clamps might be heating slowly due to the large thermal mass of the clamps. In addition, the very design of the convection oven used already gave rise to an inherent temperature variation. Within the confines of the hardware, a heating time of 4 minutes was achieved with an approximate dwell time of 1 min and a temperature difference of roughly 8°C between the thermocouples on the top and bottom of the specimen. For future characterization work, it is advised to perform the experiments in a nitrogen environment to allow for larger dwell times that could potentially minimize the temperature variations.
The second challenge was the actual clamping of the (molten) specimen to achieve proper load introduction. The molten thermoplastic polymer will easily adhere to the clamps, making swapping of specimens time-consuming. Hence, a disposable material was used in between the clamp and the specimen. The metal foil was found to work well; however, folding of the edges was required to prevent squeeze out of the polymer under the applied clamping force, making for a cumbersome procedure and adding a significant amount of time to the specimen preparation. Despite the folded edges, a low clamping force was still required to prevent squeeze out from the clamps into the gauge section. Load introduction was enhanced with the use of a dog-bone shaped specimen and a ratio of
4.3 Characterization Results
The characteristic s-shaped curves observed in the characterization results from Figure 4 were also frequently found for other materials with a viscoelastic matrix at forming conditions. For example, Wang et al. (2014) measured carbon fiber woven fabrics with PPS and PEEK matrices and found similarly shaped curves. Larberg et al. (2012) also found similarly shaped curves for bias extension tests on cross-ply specimens of UD carbon epoxy prepreg, both at room temperature and at 70°C. Picture frame experiments by McGuinness and ÓBrádaigh (1998) on the UD-C/PEEK material in molten condition showed a gradual increase of the force towards a steady state, which is reached after about 5° of shear. The current characterization results show comparable start-up behavior within 5–10° of shear. The direct comparison between results from these various characterization measurements is complicated due to the use of different specimen dimensions, material thicknesses, and testing conditions.
The bias extension results presented in this article were obtained in a similar way to previous results presented at the ESAFORM 2021 conference (Brands et al., 2021). Figure 12 shows a direct comparison of the results from two materials in this work at 365°C against the Toray TC1320 UD/C/PEKK material at 375°C with a slightly longer specimen from the previous work. A significantly higher pulling force was required to deform the TC1320 material, an unexpected result seeing how similar the material characteristics are from the data sheets. Specifically, Solvay APC and Toray TC1320 are both carbon fiber reinforced materials using a PEKK matrix in the same fiber volume fraction; therefore, the differences must be sought in the exact constituents used, their interface, or their distribution. The influence of degradation, although unlikely within the short heating times applied, was not investigated in the current research.
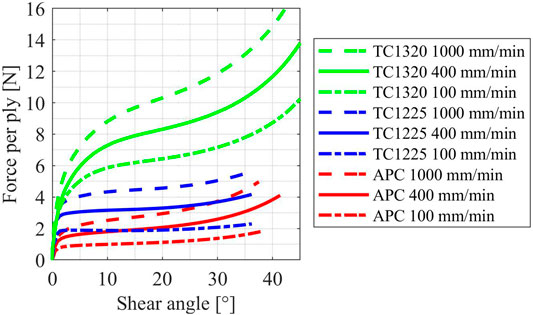
FIGURE 12. Measurement data from this article on Solvay APC and Toray TC1225 at 365°C and specimen dimensions 170 × 80 mm2, compared to previous data from Brands et al. (2021) on Toray TC1320 UD/C/PEKK at 375°C and dimensions 180 × 80 mm2.
The datasets presented offer detailed responses for cross-ply laminates from the UD material at different rates and temperatures with predominantly trellis shear deformation. The material behavior under in-plane shear deformation is fundamental to this response but is not easily extracted in terms of stress as a function of strain and strain rates due to the presence of two distinct deformation zones having complex non-linear material behavior. The in-situ deformation data obtained using the video extensometer combined with the assumed distribution according to the PJN give a complete and reasonably accurate picture of the local strains and strain rates, but the resulting distribution of stresses is the great unknown. Future work is aimed at understanding the materials’ in-plane shear behavior through a constitutive modeling study based on the bias extension results presented. With the improved characterization quality using the bias extension method and appropriate constitutive models for the in-plane shear material behavior, we aim to improve the predictive quality of composite forming simulations for thermoplastic UD materials.
4.4 Deformation
The deformation measurement techniques applied in this research provide useful insight into the deformation behavior of thermoplastic UD composite material. Overall, the in-plane shear deformation observed on cross-ply laminates in the UD material shows a great resemblance to the typical deformation of woven fabrics in bias extension. The zones of homogeneous trellis shear deformation with a near exact factor of two difference in shear angle are exemplary of their similarity. Also, the near linear relation between the displacement and shear angle in Figure 5 matches with common findings for woven composites; therefore, comparable discrepancies with the PJN prediction have been found.
The distribution of shear deformation in the different shear areas was found to be homogenous on a macroscopic scale and consistent with the 2:1 ratio in shear deformation from the PJN. Therefore, the measurement of the central shear angle seems to suffice to accurately determine the deformation over the full specimen. Hence, any mismatch with the PJN is circumvented by the in-situ measurement of the shear angle using the video extensometer and the simple application of four dots on the specimen, a procedure that is recommended for future implementations of the bias extension experiment.
Any deviation from the PJN deformation must be related to spurious deformations that negate the underlying assumptions. Flow transverse to the fiber direction is a possible source of spurious deformation specific to UDs, as it could invalidate the bi-directional inextensibility assumption from the PJN. However, neighboring plies from the cross-ply laminate used in this research hinder the transverse flow due to a difference in the fiber direction and inherent ply–ply friction. The slip between plies is therefore another source of spurious deformation that is specific to cross-ply UD laminates and would invalidate the no-slip condition from the PJN. Moreover, commonly identified spurious deformations in bias extension such as inaccuracies in clamping, inter-tow slippage, and non-discrete transitions between shearing zones due to the material’s bending stiffness are also expected to play a role for UD laminates. On the other hand, woven fabrics might suffer from extensibility due to fiber undulations, a spurious deformation that is likely not associated with the UD material.
The in-situ shear angle measurements in Figure 5 showed clear deviations from the PJN, which increased with testing temperature. Apparently, the resistance of the spurious deformations changes in relation to the in-plane shear resistance at different temperatures. In-plane shear deformation and spurious deformations such as transverse flow, ply–ply slip, and in-plane bending are all dominated by the same matrix behavior. However, the fiber-matrix distribution and fiber-matrix interface could ensure that the influence of temperature on matrix viscosity affects these differently. The relation between matrix viscosity and macroscopic properties is something that is not readily understood yet but appears to make the spurious deformations more compliant at higher temperatures compared to in-plane shear. Inhomogeneity in the temperature distribution, as recognized in the presented results, could also cause deviations from the PJN. However, the results from this research were inconclusive on the origin for the mismatch with the PJN and unable to identify the contributions of individual spurious deformations. Further research into the relation between constituent properties and macroscopic behavior could contribute to a better understanding of forming mechanisms in composites and improvements in material development.
Inhomogeneous shear deformation was also found on the meso-scale in the form of localized shear deformation along the fiber direction in the outer ply. The localization was estimated to occur after approximately 15° of shear deformation in the center region. Similar localization was observed by Potter (2002b) and Larberg et al. (2012) on bias extension measurements of cross-ply thermoset UD laminates. The localization observed in this study had no pronounced effect on the macroscopic deformation and might be ignored for modeling purposes using continuum methods. However, it is important that the bias extension test performs the characterization under conditions representative of actual processing. As such, additional research is required to study the occurrence of localization during manufacturing to validate the characterization data at large deformations as presented. Nevertheless, shear deformation above 15° is not commonly found in industrial products from these materials, making the data at smaller deformations more relevant for the application. Micro-mechanics approaches to model the materials in-plane shear resistance may be applied most easily up to the initiation of localization at 15° of shear because homogeneous shear deformation can be assumed.
5 Conclusion
This research demonstrated the successful application of the bias extension method on cross-ply laminates from the thermoplastic UD material to characterize its in-plane shear deformation resistance at forming conditions. This first unique application of the bias extension method to unidirectional thermoplastic composite material provides a conceptually simple experiment with representative conditions, wherein the proper deformation mechanism is characterized. Characterization datasets are presented for two commercial thermoplastic UD tapes with data at three test rates and three temperatures. In addition, the data have been made available for use by other researchers.
The response curves show a typical s-shape that was also observed for other composites with a viscous matrix. Viscoelastic material behavior was observed that is both rate and temperature dependent. The in-plane shear deformation introduced in the stack of unidirectional plies showed a great similarity to the typical deformations of woven composites. The center shear angle was measured throughout the test using a video extensometer, observing large shear deformations with the final shear angle being dependent on the test temperature. This direct measurement of deformation increased the accuracy of the method by implicitly addressing the occurrence of spurious deformations. The relation between the shear angle and displacement deviated only slightly from the pin-jointed net assumption, while, in addition, the distribution of deformation over the specimen was found to be consistent. The localization of shear deformation along the fiber direction on the outer ply was found to become pronounced after 15° of shear in the center area. The localization did not significantly affect homogeneity of the macroscopic shear deformation but should be taken into account for microscopic considerations.
The presented bias extension method provides reliable characterization results for the in-plane shear behavior of thermoplastic UD materials in molten condition. The key benefit compared to existing methods is that the measured force can be related directly to the measured deformation on the specimen, providing certainty that in-plane shear was measured. The improved characterization quality for the in-plane shear of thermoplastic UD composite tapes at the processing condition can be used to develop appropriate constitutive models that improve the prediction quality of composite forming simulations.
Data Availability Statement
The datasets presented in this study can be found in online repositories. The names of the repository/repositories and accession number(s) can be found below: 4TU.ResearchData repository “Data underlying the article: In-plane shear characterization of unidirectional fiber reinforced thermoplastic tape using the bias extension method.” https://doi.org/10.4121/18586019.
Author Contributions
DB: Conceptualization, methodology, investigation, and writing—original draft. SW, WG, and RA: Conceptualization, supervision, project administration, and writing—review and editing. All authors contributed to the manuscript revisioning and have approved the submitted version.
Funding
This work is part of the research program “MaterialenNL” with project number 17880, which is (partly) financed by the Dutch Research Council (NWO). The authors also gratefully acknowledge the financial and technical support from the industrial and academic members of the ThermoPlastic composites Research Center (TPRC).
Conflict of Interest
The authors declare that the research was conducted in the absence of any commercial or financial relationships that could be construed as a potential conflict of interest.
Publisher’s Note
All claims expressed in this article are solely those of the authors and do not necessarily represent those of their affiliated organizations, or those of the publisher, the editors, and the reviewers. Any product that may be evaluated in this article, or claim that may be made by its manufacturer, is not guaranteed or endorsed by the publisher.
Acknowledgments
The authors would like to thank Dr. S. P. Haanappel for his contribution in the conceptualization of the experimental methodology and useful discussions during the work.
References
Boisse, P., Hamila, N., Guzman-Maldonado, E., Madeo, A., Hivet, G., and dell’Isola, F. (2017). The Bias-Extension Test for the Analysis of In-Plane Shear Properties of Textile Composite Reinforcements and Prepregs: a Review. Int. J. Mater Form. 10, 473–492. doi:10.1007/s12289-016-1294-7
Brands, D., Grouve, W., Wijskamp, S., and Akkerman, R. (2021). “Intra-ply Shear Characterization of Unidirectional Fiber Reinforced Thermoplastic Tape Using the Bias Extension Method.” in proceedings of the 24th International ESAFORM Conference on Material Forming, University of Liège, Belgium, April 14–16, 2021. doi:10.25518/esaform21.2973
Cao, J., Akkerman, R., Boisse, P., Chen, J., Cheng, H. S., de Graaf, E. F., et al. (2008). Characterization of Mechanical Behavior of Woven Fabrics: Experimental Methods and Benchmark Results. Compos. Part A Appl. Sci. Manuf. 39, 1037–1053. doi:10.1016/j.compositesa.2008.02.016
Dörr, D., Brymerski, W., Ropers, S., Leutz, D., Joppich, T., Kärger, L., et al. (2017). A Benchmark Study of Finite Element Codes for Forming Simulation of Thermoplastic UD-Tapes. Procedia CIRP 66, 101–106. doi:10.1016/j.procir.2017.03.223
Dörr, D., Henning, F., and Kärger, L. (2018). Nonlinear Hyperviscoelastic Modelling of Intra-ply Deformation Behaviour in Finite Element Forming Simulation of Continuously Fibre-Reinforced Thermoplastics. Compos. Part A Appl. Sci. Manuf. 109, 585–596. doi:10.1016/j.compositesa.2018.03.037
Dykes, R. J., Martin, T. A., and Bhattacharyya, D. (1998). Determination of Longitudinal and Transverse Shear Behaviour of Continuous Fibre-Reinforced Composites from Vee-Bending. Compos. Part A Appl. Sci. Manuf. 29, 39–49. doi:10.1016/S1359-835X(97)00027-4
Haanappel, S. P., and Akkerman, R. (2014). Shear Characterisation of Uni-Directional Fibre Reinforced Thermoplastic Melts by Means of Torsion. Compos. Part A Appl. Sci. Manuf. 56, 8–26. doi:10.1016/j.compositesa.2013.09.007
Harrison, P., and Clifford, M. J. (2005). “Chapter 3. Rheological Behaviour of Pre-impregnated Textile Composites,” in Des. Manuf. Text. Compos.. Editor A. C. Long (Cambridge, UK: Woodhead Publishing Ltd.).
Larberg, Y. R., Åkermo, M., and Norrby, M. (2012). On the In-Plane Deformability of Cross-Plied Unidirectional Prepreg. J. Compos. Mater. 46, 929–939. doi:10.1177/0021998311412988
Machado, M., Fischlschweiger, M., and Major, Z. (2016). A Rate-dependent Non-orthogonal Constitutive Model for Describing Shear Behaviour of Woven Reinforced Thermoplastic Composites. Compos. Part A Appl. Sci. Manuf. 80, 194–203. doi:10.1016/j.compositesa.2015.10.028
Margossian, A., Bel, S., and Hinterhoelzl, R. (2015). Bending Characterisation of a Molten Unidirectional Carbon Fibre Reinforced Thermoplastic Composite Using a Dynamic Mechanical Analysis System. Compos. Part A Appl. Sci. Manuf. 77, 154–163. doi:10.1016/j.compositesa.2015.06.015
McGuinness, G. B., and ÓBrádaigh, C. M. (1998). Characterisation of Thermoplastic Composite Melts in Rhombus-Shear: the Picture-Frame Experiment. Compos. Part A Appl. Sci. Manuf. 29, 115–132. doi:10.1016/s1359-835x(97)00061-4
Potter, K. (2002). Bias Extension Measurements on Cross-Plied Unidirectional Prepreg. Compos. Part A Appl. Sci. Manuf. 33, 63–73. doi:10.1016/S1359-835X(01)00057-4
Potter, K. (2002). In-plane and Out-Of-Plane Deformation Properties of Unidirectional Preimpregnated Reinforcement. Compos. Part A Appl. Sci. Manuf. 33, 1469–1477. doi:10.1016/S1359-835X(02)00138-0
Sachs, U., and Akkerman, R. (2017). Viscoelastic Bending Model for Continuous Fiber-Reinforced Thermoplastic Composites in Melt. Compos. Part A Appl. Sci. Manuf. 100, 333–341. doi:10.1016/j.compositesa.2017.05.032
Slange, T. K., Warnet, L. L., Grouve, W. J. B., and Akkerman, R. (2018). Deconsolidation of C/PEEK Blanks: on the Role of Prepreg, Blank Manufacturing Method and Conditioning. Compos. Part A Appl. Sci. Manuf. 113, 189–199. doi:10.1016/j.compositesa.2018.06.034
Sloan, J. (2019). I Want to Say Two Words to You: “Thermoplastic tapes”. Available at: https://www.compositesworld.com/articles/i-want-to-say-two-words-to-you-thermoplastic-tapes (Accessed January 1, 2018).
Solvay Composite Materials HQ (2017). Technical Data Sheet APC (PEKK-FC). Alpharetta, GA, United States. Available at: https://www.solvay.com/en/product/apcpekk-fcs2
Toray Advanced Composites (2020).Toray Cetex(R) TC1225 Product Data Sheet. Morgan Hill, CA, United States. Available at: https://www.toraytac.com/product-explorer/products/gXuK/Toray-Cetex-TC1225
Wang, P., Hamila, N., Pineau, P., and Boisse, P. (2014). Thermomechanical Analysis of Thermoplastic Composite Prepregs Using Bias-Extension Test. J. Thermoplast. Compos. Mater. 27, 679–698. doi:10.1177/0892705712454289
Keywords: thermoplastic composite, unidirectional, characterization, forming, processing, bias extension, in-plane shear
Citation: Brands D, Wijskamp S, Grouve WJB and Akkerman R (2022) In-Plane Shear Characterization of Unidirectional Fiber Reinforced Thermoplastic Tape Using the Bias Extension Method. Front. Mater. 9:863952. doi: 10.3389/fmats.2022.863952
Received: 27 January 2022; Accepted: 26 April 2022;
Published: 02 June 2022.
Edited by:
Stephen Hallett, University of Bristol, United KingdomReviewed by:
Philippe Boisse, Institut National des Sciences Appliquées de Lyon (INSA Lyon), FranceZoltan Major, Johannes Kepler University of Linz, Austria
Copyright © 2022 Brands, Wijskamp, Grouve and Akkerman. This is an open-access article distributed under the terms of the Creative Commons Attribution License (CC BY). The use, distribution or reproduction in other forums is permitted, provided the original author(s) and the copyright owner(s) are credited and that the original publication in this journal is cited, in accordance with accepted academic practice. No use, distribution or reproduction is permitted which does not comply with these terms.
*Correspondence: D. Brands, ZC5icmFuZHNAdXR3ZW50ZS5ubA==; W. J. B. Grouve, dy5qLmIuZ3JvdXZlQHV0d2VudGUubmw=