 Jesse Zhao
- Dougherty Valley High School, San Ramon, CA, United States
Density is a fundamental material property that can be used to determine a variety of other properties and the material’s feasibility for various applications, such as with energetic materials. However, current methods for determining density require significant resource investment, are computationally expensive, or lack accuracy. We used the properties of roughly ∼15,000 inorganic crystals to develop a highly accurate machine learning algorithm that can predict density. Our algorithm takes in the desired crystal’s chemical formula and generates 249 predictors from online materials databases, which are fed into a gradient boosted trees model. It exhibits a strong predictive power with an R2 of ∼99%.
Introduction
As the demand for newer materials increases, being able to determine their properties quickly and accurately becomes a critical step in the development process. The density of a crystal is of great significance as it impacts its feasibility for certain functionalities in industrial settings. For instance, crystal density heavily affects the detonation velocity and detonation pressure of energetic materials, meaning that an accurate estimation of detonation performance relies on accurate density (Keshavarz et al., 2015). There are presen tly several large databases that store the density as well as other important properties of large numbers of crystals to help researchers (Bruno et al., 2017). However, there is still data that is not readily available to researchers due to the innovative nature of materials science, requiring them to calculate properties like density themselves.
Currently, there are no fast and reliable methods to assess the density of a crystal before it has been synthesized. Researchers are forced to rely on a battery of tests based on trial and error, which consumes large amounts of time and resources. Developing a material from scratch and realizing it does not have the appropriate properties after a long testing period is simply not viable long-term. Only computational methods predicting material properties in silico are still valid. Generally, present in silico calculations use crystal structure prediction (CSP) to find the density of a single crystal, use “group addition” methods (GAM), or use density functional theory (DFT) in combination with quantitative structure-property relationship (QSPR) (Wang et al., 2020). CSP based on first-principle calculations can provide reliable information, but it is often very computationally expensive as it requires sampling numerous space groups and unit cells to create a set of candidate structures, then calculating the global minimum energy to predict a plausible crystal packing (Graser et al., 2018; Oganov et al., 2019). Deep learning variations of CSP offer a faster alternative but at the cost of predictive accuracy (Ryan et al., 2018; Liang et al., 2020). GAM fails to take account of predictors that are needed to determine density and requires manually identifying substructures, making it inaccurate and unfeasible for processing large datasets (Wang et al., 2020). DFT + QSPR models are used the most, but most instances are trained on <300 samples and few predictors, leading to inaccuracy (Wang et al., 2020).
Accurate density estimation requires an approach that allows the utilization of large amounts of predictors to draw patterns. Machine learning (ML) approaches have been exceptionally proficient at analyzing trends in data to create highly accurate estimates. In particular, the large number of estimators present in tree-based ensemble algorithms allows for highly complex conclusions to be made from relatively small data sets. There have been many past instances where ML approaches have been successful in predicting the properties of materials, including melting temperatures (Seko et al., 2014), bandgap (Xie and Grossman, 2018), wettability (Kim and Li, 2022), and many others (Sumpter and Noid, 1996; Pilania et al., 2013; Srinivasan and Rajan, 2013; Meredig et al., 2014; Menon et al., 2019; Manzoor et al., 2021; Viatkin et al., 2021). While there have been no research on ML approaches in predicting the density of inorganic crystals, ML models have been created to estimate the crystal density organic compounds distinguished as high explosives using chemical structures, achieving a maximum performance of an R2 of 0.914 and root mean square error (RMSE) of 0.044 (Nguyen et al., 2021).
This paper presents an ML model that can estimate the density of stable inorganic crystals at ground state given its chemical formula. Using gradient boosted trees, we achieve a good test accuracy with an R2 of ∼0.99 and an RMSE of 0.31. Our model is certainly not as accurate in predicting a specific subset of materials as the RMSE is significantly greater than previous models predicting crystal density of high explosives. However, our model has a higher R2 value, suggesting greater generalizability to a variety of applications. The mean absolute percentage error of our model is just 4%. These accuracies are ultimately not comparable due to the significantly different factors affecting crystal structure and density between organic and inorganic compounds. We use predictors generated from the crystal’s chemical composition. Given polymorphism, the model’s output is always of the most stable polymorph with the lowest energy above hull. This model can be integrated into a high-throughput screening of possible inorganic crystals, whether for their candidacy as energetic material or for other purposes. Its estimations of crystal density are applicable to the tap density of powder materials, where porosity rather than crystal density is the biggest source of error. However, it cannot be used in applications such as in cantilever resonators, where highly accurate densities are required. The model also provides insight into the main factors that affect the density of inorganic crystals.
Methods
Data collection and featurization
Using pymatgen (Ong et al., 2013), we initially retrieved approximately 32,000 inorganic crystals from the Materials Project database (Jain et al., 2013) along with their corresponding densities and energies above hull. To solve for polymorphism, we kept only the polymorphs with the lowest energy above hull. To ensure less noise in our data from unstable compositions, we also filtered out all crystals with an energy above hull of above 0.05 eV/atom, leaving roughly 15,000 crystals.
We extracted each crystal’s features using MatMiner, an open-access Python library that is designed for data mining material properties (Ward et al., 2018). To keep the model applicable, we chose from the composition-based featurizers that MatMiner offers. We used the “ElementProperty” class with the “Magpie” preset to extract statistics (i.e., average deviation, range, minimum, maximum, and mode) of 22 different elemental features, such as the number of valence electrons in each orbit and electronegativity, calculated by rule of mixture. We chose this preset because it accounts for a wide range of properties in various aspects, including chemical and magnetic, from which the algorithm can learn. It should, however, be noted that some of the features are based on condensed matter properties. The “Magpie” preset returns features like melting temperature and bandgap, which are not inherent to any element. These properties are likely calculated from pure compounds. However, MatMiner returns constant values for each property with respect to elemental fractions. We also used several other composition-based packages, including the “Stoichiometry” and “ElementFraction” packages, which include numerous additional features that provide information about specific elemental ratios, valence orbit ratios, etc., for a total of 249 features. A full list of features can be found in Table 1. These features were used as parameters used to predict density. Any null values were imputed with 0.
TABLE 1. List of predictors used in the machine learning modeling.
Machine learning
To model the data, we used the gradient boosted trees regressor implemented in the XGBoost Python package (Chen and Guestrin, 2016). We randomly split the data in the ratios of 90 and 10% for training and testing, respectively. No preprocessing was performed on the data.
We optimized hyperparameters including the number of estimators, the max depth of each tree, the learning rate, and the column subsampling proportion using the randomized search algorithm implemented in the scikit-learn Python package. Greater depth and number of estimators mean that the model can model the data with greater complexity, thus reducing “bias”. However, it also means the model may be subject to overfitting in which they learn noise, increasing “variance”. Other hyperparameters like column subsampling proportion are used to decrease variance, regularizing the model. These hyperparameters were crucial in reducing bias without overly compromising variance.
Results and discussion
Regression model
The gradient boosted trees algorithm is an ensemble algorithm that combines weak learners into a single strong learner iteratively. Decision trees evaluate an input based on conditions at each node, which are determined through model training. They can be thought of as a nested if-else statement or as a piecewise function. In the gradient boosted trees algorithm, a decision tree is fitted to the data, and successive decision trees are fitted to the residual of their predecessors, hence “boosting” the model with every iteration (Friedman, 2001).
We chose to use the XGBoost implementation of gradient boosted trees due to its high performance in learning complex, localized relationships, as well as its good generalizability (Nielsen, 2016). The complexity is required because the model must learn the sophisticated interactions of atoms in crystals to create a generalized function for density. Small changes in the interactions may change crystal structure, and therefore density, completely. XGBoost can adapt the sizes of local “neighborhoods”, which can be thought of as the subfunctions inside a piecewise function, to fit the data (Nielsen, 2016). Its adaptiveness allows it to learn both general trends as well as individual areas of complexity, meaning it can maintain a balance between bias and variance (Nielsen, 2016). Our data is also highly varied. For instance, some predictors such as mean atomic weight are dense by nature while others like elemental fraction are sparse. The data occupies drastically different scales as well. Mean atomic weight stretches from 0 to upwards of 200 while elemental fraction spans only from 0 to 1. This heavily skews feature importance towards large features while neglecting smaller ones. Traditional methods would require preprocessing the data through normalization and transformations. XGBoost is generalizable to a wide assortment of data, including dense and sparse data (Nielsen, 2016). In addition, decision trees treat features individually, removing the problem of differing scales. These characteristics make XGBoost highly applicable to the problem at hand.
Figure 1 shows the results of the regressor in predicting density over the test set. The average R2 value is ∼0.99 with a margin of error of 0.001 at 95% confidence, showing a very strong predictive power. The average RMSE is ∼0.31. More detailed information on the accuracy of this and other models based on several metrics are summarized in Supplementary Material.
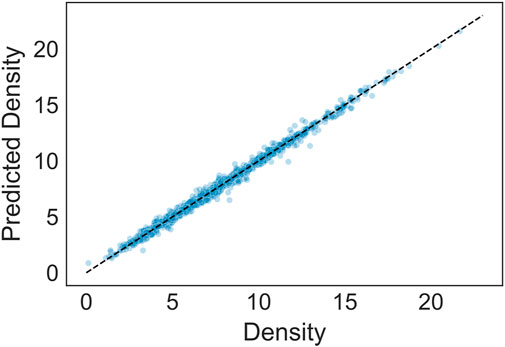
FIGURE 1. Results of regression model predicting density (g/cm3). The prediction accuracy (R2) is approximately 0.99.
Feature importance
Given a trained model, the relative importance of each of the predictors can be calculated via permutation-based feature importance (Altmann et al., 2010). The values of a predictor are randomly shuffled, thus randomizing its value while preserving the distribution of the variable. The change in the model’s performance is then calculated, and the shuffled predictors that impact performance the most are consequently the most important predictors.
Table 2 describes the mean impacts of the ten most important predictors on R2 calculated via permutation-based feature importance. Note that R2 had an original value of 0.99 over the entire dataset with the model used. The mean number of valence electrons in the f-orbital is clearly shown to be the most important predictor by a significant margin. As shown in Figure 2, there is a remarkable relationship between the mean number of f-valence electrons and density. The number of f-valence electrons is naturally correlated with density, as a greater number of f-valence electrons suggests a greater atomic weight. The correlation can also be explained by the bond valence model, which describes an inverse relationship between bond valence and bond distance (Brown, 1978). With more f-valence electrons, the bond distance of crystals would decrease, leading to tighter crystal packing and greater density. Notice that the model uses the mean number of f-valence electrons in the crystal above other representations, while it prefers the fraction of the total valence electrons for s-valence electrons and p-valence electrons. The second most important predictor, specific volume at ground state, is more clearly associated with density as it helps provide the model with a ballpark regarding the volume of the crystal. Most of the strongest predictors are either associated with mass or valence electrons. While the effects of microstructure are also essential to calculating the density of materials, they are outside of the scope of this study.
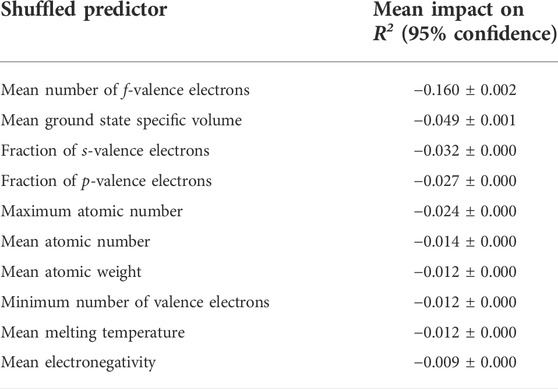
TABLE 2. Mean impacts on R2 for the ten most important predictors using permutation-based feature importance. R2 originally had an approximate value of 0.99
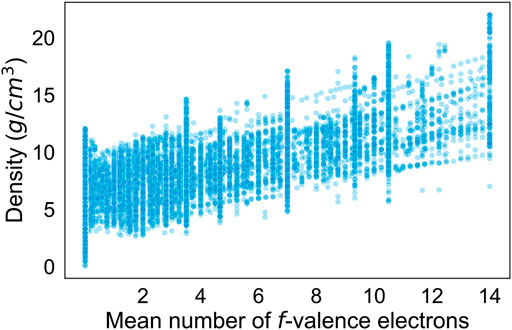
FIGURE 2. Scatterplot of the density (g/cm3) versus the mean number of f-valence electrons in crystals.
XGBoost models also provide their own built-in methods for computing feature performance. It provides a slightly different picture of the ranking of the most important predictors. One example is that the fraction of ground state specific volume is ranked as the sixth most important predictor rather than the second most. XGBoost uses gain-based importance, which is derived from the training dataset. Because gain-based importance is not calculated using unseen data, it does not take overfitting into account. Based on the discrepancies between the rankings, we observe that predictors relating to melting temperature among others tend to be overfit. A table of the top ten most important predictors as calculated by XGBoost can be found in Supplementary Material.
224 of the predictors used had a measured impact of less than 0.001 on R2. We used the calculated feature importance to distill the model by iteratively removing insignificant predictors, training the model, and measuring accuracy. We also removed mean atomic weight, as it is highly correlated with mean atomic number but considered less important. While multicollinearity is not an issue for boosted tree algorithms, this served to further distill the predictors needed, leaving a total of 7. These predictors were the 7 most important predictors as listed in Table 2, not including mean atomic weight. Using just the 7 predictors, the model was able to achieve an accuracy of ∼0.97. Figure 3 shows the results of the distilled regressor in predicting density over the test set.
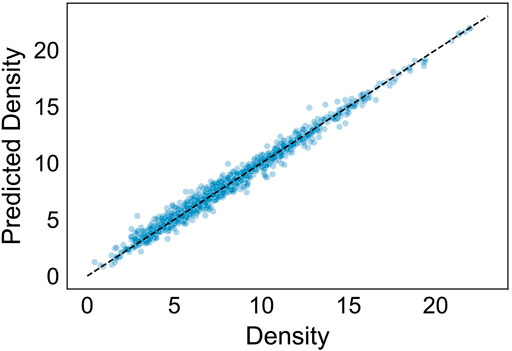
FIGURE 3. Results of distilled regression model predicting density (g/cm3). The prediction accuracy (R2) is approximately 0.98.
Extrapolation to crystals with higher energy above hull
There may come instances where calculating the densities of unstable or metastable crystals is necessary. Figure 4A depicts the results of the regressor in predicting crystals with an energy above hull over the trained threshold of 0.05 eV/atom. The model has a significantly worse accuracy of approximately −0.40. The residuals show a clear diverging trend of overprediction, which provides the greatest source of error in the model. We trained a new regressor using the same parameters and hyperparameters, but on all crystals, regardless of energy above hull. As portrayed in Figure 4B, the results of the new regressor in predicting the test set were also relatively poor, with an accuracy of approximately 0.70. There is a clear diverging trend of overprediction as well.
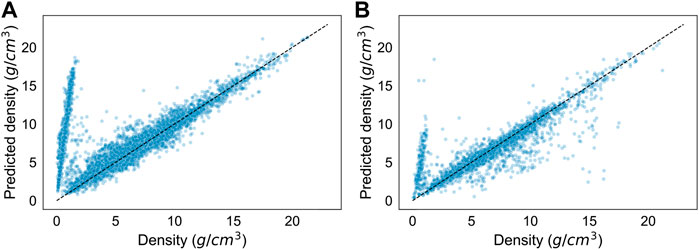
FIGURE 4. Results of extrapolation to crystals with higher energies above hull. (A) Results of the regression model predicting densities (g/cm3) of all crystals with an energy above hull above 0.05 eV/atom. It has a prediction accuracy (R2) of approximately −0.40. (B) Results of a regression model trained on all crystals predicting the densities of the test set, which is sampled from all crystals. It has a prediction accuracy (R2) of approximately 0.70.
The cause is evident when considering Figure 5, which shows the scatterplot between density and mean atomic mass of the crystals in the dataset at several different energy caps. The higher the energy cap, the stronger the diverging trend, indicating that unstable crystals in the dataset have a strong association with having an abnormally low density. Given their low density, these crystals are most likely two-dimensional crystals. Analysis of individual datapoints that fall within the trend shows that most crystals are in either the mmm or the 4/mmm point groups, and many are part of the orthorhombic crystal system. Two-dimensional crystals do not have a well-defined volume, so the model can not feasibly predict their density.
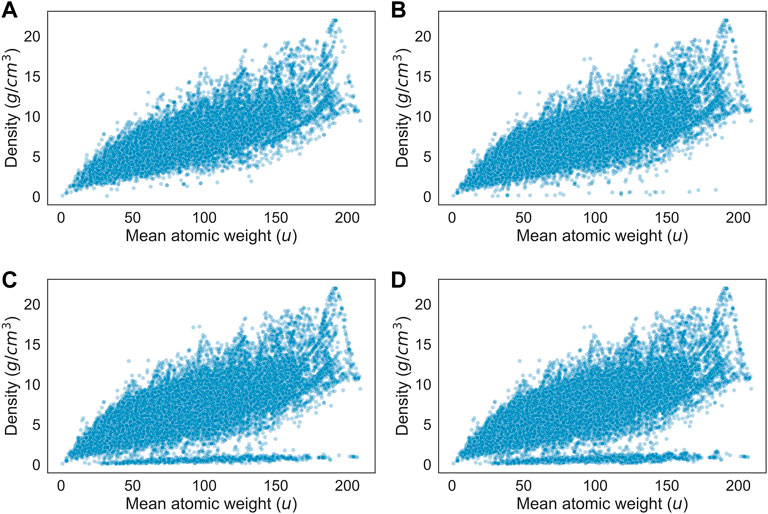
FIGURE 5. Scatterplot of density (g/cm3) versus mean atomic weight (u) for all crystals with an energy above hull below (A) 0.05 eV/atom (B) 0.5 eV/atom (C) 2.5 eV/atom (D) no limit.
However, we can still extrapolate the model to metastable crystals. Figure 6 illustrates the change in model accuracy across higher maximum energy above hull value caps. The model maintains a acceptable predictive power of over 0.80 for crystals with an energy above hull up to 0.65 eV/atom, demonstrating a level of generalizability. Initially training the model on crystals with an energy above hull below 1.0 eV/atom leads to better results, with an accuracy of 0.97 on the test set. However, note that there are less crystals with a greater energy above hull, so they are underrepresented in the test set. Training on all crystals regardless of energy above hull is also ultimately not viable because it reduces accuracy for stable crystals as well. Figure 4B shows how, while the diverging trend is overpredicted on, there is also a light spread of outliers that are underpredicted on as well. These datapoints are estimated with much greater accuracy with the original model. The performance of various models trained and tested as such is summarized in Supplementary Material.
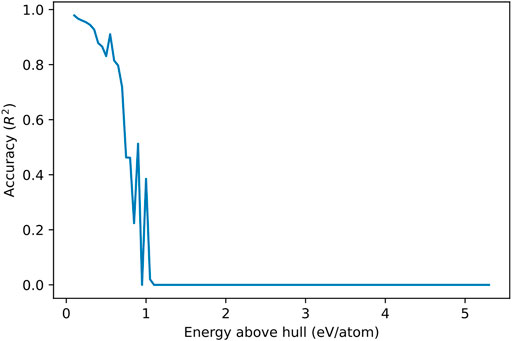
FIGURE 6. Prediction accuracy (R2) of the regression model versus energy above hull of crystals (eV/atom). The performance of the model was calculated on crystals with steps of 0.05 eV/atom. The performance decreases far below 0, but a minimum of 0 is applied on the graph for the sake of clarity.
Conclusion
We have developed an ML model that can predict the densities of inorganic crystals based on chemical composition using the XGBoost implementation of the gradient boosted trees algorithm. After training on ∼15,000 datapoints retrieved from the Materials Project database with an energy above hull of below 0.05 eV/atom, we have achieved a testing accuracy of ∼0.99. Using the model, we have identified the key predictors, which provide insight into the factors affecting density and crystal structure. We have also found that the model is unable to generalize to two-dimensional crystals. However, most two-dimensional crystals in the dataset are unstable, suggesting that the model can accommodate at least metastable crystals with relatively low error. In this paper, we have demonstrated that ML can be used to create models that provide highly accurate estimations of the density of inorganic crystals, for stable ground states.
Data availability statement
Publicly available datasets were analyzed in this study. This data can be found here: https://materialsproject.org/.
Author contributions
JZ retrieved the data, conducted the research, optimized the prediction model, analyzed the results, and drafted the manuscript.
Acknowledgments
The author thanks Dr. Ju Li for his guidance and insights, as well as Frank Shi for his help with coding.
Conflict of interest
The author declares that the research was conducted in the absence of any commercial or financial relationships that could be construed as a potential conflict of interest.
Publisher’s note
All claims expressed in this article are solely those of the authors and do not necessarily represent those of their affiliated organizations, or those of the publisher, the editors and the reviewers. Any product that may be evaluated in this article, or claim that may be made by its manufacturer, is not guaranteed or endorsed by the publisher.
Supplementary material
The Supplementary Material for this article can be found online at: https://www.frontiersin.org/articles/10.3389/fmats.2022.922566/full#supplementary-material
References
Altmann, A., Toloşi, L., Sander, O., and Lengauer, T. (2010). Permutation importance: A corrected feature importance measure. Bioinformatics 26, 1340–1347. doi:10.1093/bioinformatics/btq134
Brown, I. D. (1978). Bond valences—A simple structural model for inorganic chemistry. Chem. Soc. Rev. 7, 359–376. doi:10.1039/CS9780700359
Bruno, I., Gražulis, S., Helliwell, J. R., Kabekkodu, S. N., McMahon, B., and Westbrook, J. (2017). Crystallography and databases. Data Sci. J. 16, 38. doi:10.5334/dsj-2017-038
Chen, T., and Guestrin, C. (2016). “XGBoost: A scalable tree boosting system,” in Proceedings of the 22nd ACM SIGKDD International Conference on Knowledge Discovery and Data Mining, 785–794. doi:10.1145/2939672.2939785
Friedman, J. H. (2001). Greedy function approximation: A gradient boosting machine. Ann. Stat. 29, 1189–1232. doi:10.1214/aos/1013203451
Graser, J., Kauwe, S. K., and Sparks, T. D. (2018). Machine learning and energy minimization approaches for crystal structure predictions: A review and new horizons. Chem. Mat. 30, 3601–3612. doi:10.1021/acs.chemmater.7b05304
Jain, A., Ong, S. P., Hautier, G., Chen, W., Richards, W. D., Dacek, S., et al. (2013). Commentary: The materials Project: A materials genome approach to accelerating materials innovation. Apl. Mater. 1, 011002. doi:10.1063/1.4812323
Keshavarz, M. H., Soury, H., Motamedoshariati, H., and Dashtizadeh, A. (2015). Improved method for prediction of density of energetic compounds using their molecular structure. Struct. Chem. 26, 455–466. doi:10.1007/s11224-014-0502-7
Kim, S. Y., and Li, J. (2022). Machine learning of metal-ceramic wettability. J. Materiomics 8, 195–203. doi:10.1016/j.jmat.2021.03.014
Liang, H., Stanev, V., Kusne, A. G., and Takeuchi, I. (2020). CRYSPNet: Crystal structure predictions via neural networks. Phys. Rev. Mater. 4, 123802. doi:10.1103/PhysRevMaterials.4.123802
Manzoor, A., Arora, G., Jerome, B., Linton, N., Norman, B., and Aidhy, D. S. (2021). Machine learning based methodology to predict point defect energies in multi-principal element alloys. Front. Mat. 8. doi:10.3389/fmats.2021.673574
Menon, A., Thompson-Colón, J. A., and Washburn, N. R. (2019). Hierarchical machine learning model for mechanical property predictions of polyurethane elastomers from small datasets. Front. Mat. 6. doi:10.3389/fmats.2019.00087
Meredig, B., Agrawal, A., Kirklin, S., Saal, J. E., Doak, J. W., Thompson, A., et al. (2014). Combinatorial screening for new materials in unconstrained composition space with machine learning. Phys. Rev. B 89, 094104. doi:10.1103/PhysRevB.89.094104
Nguyen, P., Loveland, D., Kim, J. T., Karande, P., Hiszpanski, A. M., and Han, T. Y.-J. (2021). Predicting energetics materials’ crystalline density from chemical structure by machine learning. J. Chem. Inf. Model. 61, 2147–2158. doi:10.1021/acs.jcim.0c01318
Nielsen, D. (2016). Tree boosting with xgboost-why does xgboost win" every" machine learning competition? (Master’s thesis). Trondheim, Norway: NTNU.
Oganov, A. R., Pickard, C. J., Zhu, Q., and Needs, R. J. (2019). Structure prediction drives materials discovery. Nat. Rev. Mat. 4, 331–348. doi:10.1038/s41578-019-0101-8
Ong, S. P., Richards, W. D., Jain, A., Hautier, G., Kocher, M., Cholia, S., et al. (2013). Python materials genomics (pymatgen): A robust, open-source python library for materials analysis. Comput. Mater. Sci. 68, 314–319. doi:10.1016/j.commatsci.2012.10.028
Pilania, G., Wang, C., Jiang, X., Rajasekaran, S., and Ramprasad, R. (2013). Accelerating materials property predictions using machine learning. Sci. Rep. 3, 2810. doi:10.1038/srep02810
Ryan, K., Lengyel, J., and Shatruk, M. (2018). Crystal structure prediction via deep learning. J. Am. Chem. Soc. 140, 10158–10168. doi:10.1021/jacs.8b03913
Seko, A., Maekawa, T., Tsuda, K., and Tanaka, I. (2014). Machine learning with systematic density-functional theory calculations: Application to melting temperatures of single and binary component solids. Phys. Rev. B 89, 054303. doi:10.1103/PhysRevB.89.054303
Srinivasan, S., and Rajan, K. (2013). Property phase diagrams” for compound semiconductors through data mining. Materials 6, 279–290. doi:10.3390/ma6010279
Sumpter, B. G., and Noid, D. W. (1996). On the design, analysis, and characterization of materials using computational neural networks. Annu. Rev. Mat. Sci. 26, 223–277. doi:10.1146/annurev.ms.26.080196.001255
Viatkin, D., Garcia-Zapirain, B., Méndez-Zorrilla, A., and Zakharov, M. (2021). Deep learning approach for prediction of critical temperature of superconductor materials described by chemical formulas. Front. Mat. 8. doi:10.3389/fmats.2021.714752
Wang, L., Zhang, M., Chen, J., Su, L., Zhao, S., Zhang, C., et al. (2020). Corrections of molecular morphology and hydrogen bond for improved crystal density prediction. Molecules 25, 161. doi:10.3390/molecules25010161
Ward, L., Dunn, A., Faghaninia, A., Zimmermann, N. E. R., Bajaj, S., Wang, Q., et al. (2018). Matminer: An open source toolkit for materials data mining. Comput. Mater. Sci. 152, 60–69. doi:10.1016/j.commatsci.2018.05.018
Keywords: crystal density, crystal density predictions, density prediction, inorganic crystal, density prediction model
Citation: Zhao J (2022) Estimation of inorganic crystal densities using gradient boosted trees. Front. Mater. 9:922566. doi: 10.3389/fmats.2022.922566
Received: 18 April 2022; Accepted: 19 July 2022;
Published: 02 September 2022.
Edited by:
Mathieu Doucet, Oak Ridge National Laboratory (DOE), United StatesReviewed by:
Pradeep R. Varadwaj, The University of Tokyo, JapanMalcolm Guthrie, Oak Ridge National Laboratory (DOE), United States
Copyright © 2022 Zhao. This is an open-access article distributed under the terms of the Creative Commons Attribution License (CC BY). The use, distribution or reproduction in other forums is permitted, provided the original author(s) and the copyright owner(s) are credited and that the original publication in this journal is cited, in accordance with accepted academic practice. No use, distribution or reproduction is permitted which does not comply with these terms.
*Correspondence: Jesse Zhao, anpoYW84NDZAZ21haWwuY29t