 Vojtěch Enev
 Petr Sedláček
 Marek Řihák
 Miloslav Pekař
- Instiutute of Physical and Applied Chemistry and Materials Research Centre, Faculty of Chemistry, Brno University of Technology, Brno, Czechia
Isothermal thermogravimetry in a kinetic mode and time-resolved infrared spectroscopy was used to characterize water and its binding in hydrogels formed by interactions between hyaluronan and micelles of Septonex, an oppositely charged surfactant. Thermogravimetry provided detailed insight into the dehydration kinetics of the gel and thus brought indirect information on the strength of water binding in the hydrogel network. Infrared (IR) spectroscopy complemented the study with a direct analysis of structural changes occurring in the gel during its dehydration. IR spectroscopy thus contributed to understanding the processes which were observed in thermogravimetry, qualitatively, on the molecular level. This study can contribute to a broader application of the combined thermogravimetry–IR approach in the study of hydrogel materials and the development of their applications, especially in bio-related areas where water is among the key players.
Introduction
Hydrogels are ubiquitous materials studied theoretically and for their practical applications (Ullah et al., 2015). The application areas are mainly pharmaceutics and medicine, cosmetics, the food industry, agriculture, and environmental technologies (Li and Mooney, 2016; Nordgard and Draget, 2017; Mayr et al., 2018; Garcia and Kiick, 2019; Dreiss, 2020; Khan et al., 2022). Bio-related applications are based on the similarity of hydrogels to biological environments linked to the high content of water in hydrogels and living structures. For example, hydrogels can mimic some properties of biological tissues or can be used as scaffolds in tissue engineering. Water itself is an extraordinary compound with several tens of specific properties and propensity to form physical substructures by hydrogen bonding (Ball, 2008a,b; Gallo et al., 2016).
Water content is one of the principal characteristics of hydrogels determined by simple gravimetry before and after hydrogel drying. More detailed knowledge of water binding and structure in hydrogels is an interesting topic of hydrogel research and practical applications. From numerous works, we mention a long-lasting debate on freezing and non-freezing water often based on differential scanning calorimetry (Ahmad and Huglin, 1994; Kocherbitov, 2016). Spectroscopic techniques enable a different insight into water structure and behavior even in hydrogels. Inspired by the work of Grossutti and Dutcher (2016), we recently applied IR spectroscopy to study water in hydrogels formed by physical crosslinks between cationized dextran and anionic surfactant in micellar form (Enev et al., 2019). The analysis was based on the measurement of IR spectra of the gels during drying, extended by (isothermal) thermogravimetric analysis of the drying kinetics and supported by the deconvolution of a broad water band in IR spectrum found between 3,800 and 3,000 cm−1 (OH stretching). The thermogravimetric technique was inspired by a study which used it to characterize water in cells (Uribelarrea et al., 1985). Isothermal thermogravimetry can be used also in other water-related investigations such as water confinement in nanospaces (Lisuzzo et al., 2019). In combination with (fluorescence) spectroscopy, thermogravimetry was used to characterize micelles formed in a hybrid surfactant/clay system (Lisuzzo et al., 2022). The dextran–surfactant hydrogels are representatives of a broader class of polyelectrolyte–surfactant systems (complexes). They are formed mainly by the electrostatic interactions between oppositely charged polyelectrolyte chains and surfactant molecules (Kizilay et al., 2011; Gradzielski and Hoffmann, 2018). At certain compositions and usually when the surfactant is present in micellar form, hydrogels can probably be formed with micelles as multifunctional crosslinking points. Water in polyelectrolyte–surfactant hydrogels is supposed to form a dispersion medium and further create hydration shells around polyelectrolyte chains and on micellar surfaces and thus participate in the hydrogel network.
This study aimed at the application of the previously developed methodology (Enev et al., 2019) to a polyelectrolyte–surfactant system with reversed charges—anionic biopolymer and cationic surfactant. Hyaluronan was selected as a naturally negatively charged polyelectrolyte studied in our and other laboratories and also from the point of view of its interactions with oppositely charged surfactants, including the formation of hydrogels (Tolentino et al., 2013; Bračič et al., 2015; Buchold et al., 2017; Venerová and Pekař, 2017; Smilek et al., 2019).
Materials and Methods
Preparation of Polyelectrolyte-Surfactant Hydrogels
In this study, two types of hyaluronan (in the sodium salt form), with high (HMW) and low (LMW) average molecular weight, were used as model anionic polyelectrolytes. The hyaluronan was selected on the basis of preliminary tests as a representative of anionic polysaccharides, which formed hydrogels with cationic surfactants. Dry polyelectrolytes were purchased from Contipro Company (Czech Republic) and used without any further treatment. The weight-averaged molecular weight (1,204 ± 14 and 310 ± 16 kDa, HMW and LMW, respectively) of the hyaluronan was determined via gel size exclusion chromatography (Agilent, Infinity 1260 system, PLgel MIXED-C column) with multiangle light scattering (Wyatt Technology, Dawn Heleos II) and Differential Refractive Index (Wyatt Technology, Optilab T-rEX) detection. The model cationic surfactant used was Septonex (carbethoxypendecinium bromide). This surfactant was purchased from GBNchem Company (Czech Republic) in Czech Pharmacopoeia quality and used as received.
Polysaccharide/surfactant hydrogels were prepared via mixing a stock solution of hyaluronan and a stock solution of Septonex in a volume ratio of 1:1. The resulting mixtures were left on a shaker overnight to complete the crosslinking process of hydrogel, after which the system was centrifuged. Next, the supernatant was discarded, and the gel was collected for further experimental use. All the stock solutions were prepared in ultra-pure water (Purelab Flex, ELGA system, Lane End, United Kingdom). The exact composition of the formed hydrogels was calculated on the basis of the residual component contents using calibration FTIR curves for individual substances in the supernatant. The composition of hydrogels is summarized in Table 1. The detailed information on the determination of the composition is described in Supplementary Materials.
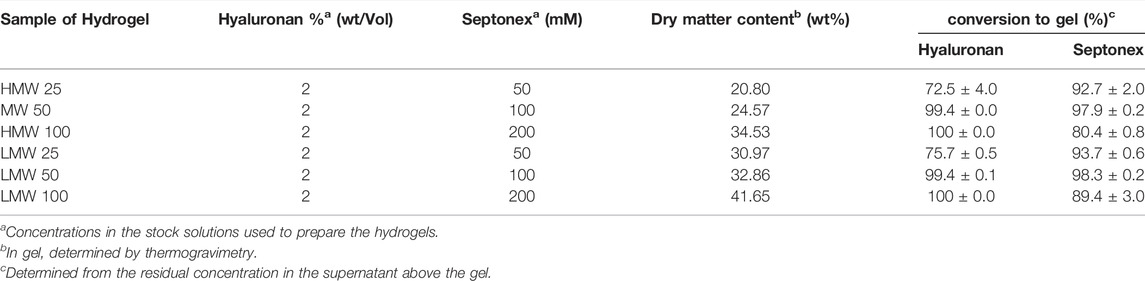
TABLE 1. Summary of the gel preparation (concentration of the gelling component in the stock solution, effectivity of conversion of the components to the hydrogel gel) and the dry matter content of the resulting hydrogels.
Thermogravimetric Analysis
Thermogravimetry of the hyaluronan/Septonex hydrogels was performed using a Q5000 TG analyzer (TA Instruments, New Castel, DE, United States). Approximately 20 mg of fresh hydrogel was weighed into the platinum pan. After inserting the pan into the TG analyzer, the sample was either heated from room temperature at a defined heating rate in the nitrogen atmosphere or the sample temperature was instantaneously equilibrated and maintained at 40°C in a nitrogen atmosphere. The isothermal drying process took place for a total of 360 min. Furthermore, the heating temperature was increased from 40 to 120°C with a heating rate of 5°C min−1. This drying step evaporated all the residual moisture in the analyzed hydrogels. The isothermal thermogravimetry of the hydrogels was performed under the nitrogen and balance gas flow rate of 25 ml min−1 and 10 ml min−1, respectively. The relative sample weight was recorded with ± 0.1% mass accuracy. The thermogravimetric records are shown in Supplementary Materials.
Infrared Spectroscopy
The attenuated total reflectance (ATR)–FTIR technique was used for deeper structural information and studying the subpopulation of water molecules in prepared hyaluronan/Septonex hydrogels. Steady-state and time-resolved FTIR spectra were obtained by means of an ATR technique using a Nicolet iS50 spectrometer (Thermo Fisher Scientific, Waltham, United States). All experiments were performed at room temperature, at 25°C, which was controlled using air-conditioner. Steady-state FTIR spectra were recorded over the range of 4,000–400 cm−1 at 4 cm−1 resolutions and represented an average of 256 scans. The spectrum of the clean dry diamond ATR crystal in an ambient atmosphere was used as the background for infrared measurement.
The time-resolved FTIR spectra were collected at regular time intervals while water evaporated from the hydrogels. The individual time-resolved ATR spectrum was collected every 5 s as an average of eight scans with a resolution of 4 cm−1 over the course of the drying experiment (total time 600 min at maximum). The raw absorption spectra were evaluated with no artificial processing, such as baseline or ATR corrections, or subtraction of atmospheric residues (i.e., carbon dioxide and air humidity). The assignment of the observed bands to various functional groups is summarized in Supplementary Table S1 (Supplementary Material).
Results and Discussion
In our previous work, we introduced the combination of FTIR spectroscopy and isothermal thermogravimetry as a powerful analytical tool to study water desorption from hydrogels. In the current study, we applied this original analytical approach to the hydrogels prepared by crosslinking the negatively charged chains of hyaluronic acid with two different molar weights via electrostatic interactions with the cationic surfactant (Septonex) at various concentrations of the crosslinker. The gels were characterized as described in previous publications (Venerová and Pekař, 2017; Klučáková et al., 2019; Smilek et al., 2019). The dry matter content, which is directly related to the water content (and the swelling degree by mass), is given in Table 1.
Isothermal Thermogravimetry
First, hydrogels were subjected to isothermal drying at 40°C, while their weight was monitored in time by a standard TGA analyzer (Supplementary Figure S4 in the Supplementary Material). Results from this assay are shown in Table 1 and illustrated for different hydrogel samples in Figures 1 and 2. Commonly, TGA is applied on hydrogels merely to determine their dry contents. The dry contents of the hydrogels studied here are presented in Table 1 (the values represent the final relative weight of the respective sample at the end of secondary drying at 110°C). As expected, the dry content values increase with the concentration of the surfactant used for the gel preparation. This indicates a higher content of the cationic surfactant entrapped in the hydrogel matrix; however, it cannot be directly concluded based on these data whether the higher content of surfactant in the gel results in a higher density of electrostatic crosslinks in the network as far as the surfactant micelles involved in the crosslinking and those freely dispersed in the gel, respectively, cannot be distinguished. Surprisingly, higher dry contents were determined for gels prepared from low molecular weight HA for all tested surfactant additions. As far as the weight concentration of both HA were identical, this might demonstrate a more effective crosslinking of the LMW HA networks.
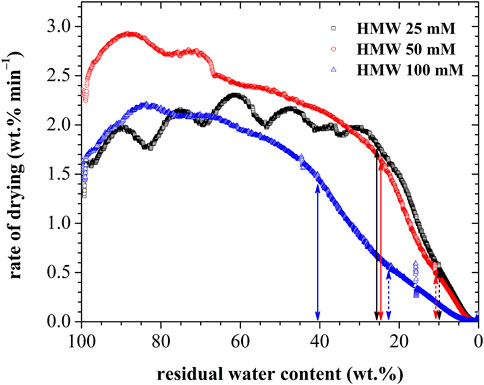
FIGURE 1. Results of isothermal thermogravimetry for HMW hyaluronan–based hydrogels presented as the rate of drying (time derivation of the residual water content) plotted as a function of the residual water content).
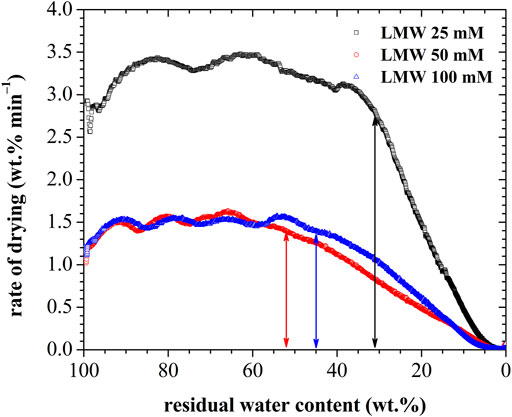
FIGURE 2. Results of isothermal thermogravimetry for LMW hyaluronan–based hydrogels presented as the rate of drying (time derivation of the residual water content) plotted as a function of the residual water content.
The main benefit of the proposed TGA assay beyond the common determination of the total water content is demonstrated by the drying curves provided in Figures 1 and 2. The drying curve is presented as a rate of drying (RD), that is, the time derivation of the residual water content in the sample, plotted vs. actual residual water content. Depicted in this way, the drying curves supplement the primary quantitative outcome from TGA (total water content) with the valuable qualitative information about the drying process. Obviously, the rate of water evaporation from the gel is affected by the strength of its binding to the dispersed gel components. Therefore, the initial period of the drying, which is for all analyzed gels manifested by the highest RD only slightly changing as the drying proceeds, can be attributed to the evaporation of the least bound fraction of the gel water (the initial apparent increase in RD corresponds to the equilibration of the sample temperature at the required constant value). As can be seen in Figure 1, among all the analyzed samples, the gel prepared from LMW with the lowest content of crosslinking surfactant (25 mM) deviates with its substantially (almost two-fold) higher RD at this step. Another distinguishing factor for the analyzed gels can be found in the actual change of RD with the residual water content in this initial drying step. On the one hand, all the gels prepared from the HMW HA, and also the LMW HA crosslinked with the lowest concentration of Septonex, show the initial RD oscillating around the nearly constant value. This indicates that for these materials, the mechanism of the drying process is not affected by the increasing relative content of the dispersed gel components. On the other hand, for the remaining LMW HA gels, an obvious decrease in the RD can be observed, indicating that the differentiation of the water according to the strength of its binding to the other gel components manifests even in this initial drying step.
As can be clearly seen in Figures 1 and 2, for each analyzed gel at a certain point (represented by a particular residual water content), the course of the drying curve changes. The RD starts to decrease steeply, indicating a change in the drying mechanism. The “critical” water content (i.e., the residual water content at which this change occurs) then represents the relative content of a more strongly bound fraction of water where the ongoing drying is severely influenced by the increasing relative content of dispersed gel components. Among the gels prepared from the HMW HA, the gel prepared with the highest concentration of surfactant stands out with a significantly higher critical water content (about 40% of water) as compared to the other two materials (near 25% of water). For the LMW HA–derived gels, the range of critical water content varies from 30 to 50%, whereby the lowest content of the strongly bound water corresponds to the gel prepared with the lowest content of surfactant. From a deeper look at the drying curves of the HMW HA gels, another change in the drying curve trend can be found for even lower water contents (at about 15% of water for 25 and 50 mM Septonex and about 25% water for 100 mM Septonex). This could represent another fraction of hydration water, apparently not present in the LMW HA gels; nevertheless, it could as well be caused by a change in the gel structure affecting the drying process.
As can be seen, the isothermal thermogravimetry represents a simple but valuable instrumental tool for monitoring drying of the soft-matter materials such as hydrogels. Nevertheless, both qualitative and quantitative aspects of information derived from this assay are difficult to interpret without support from an analytical tool, directly aiming at the structural changes that occur in the material during the drying. Therefore, in our study, we complemented TGA analyses with the time-resolved ATR-FTIR analysis of the drying process.
Time-Resolved FTIR Spectroscopy
Time-resolved FTIR spectra collected in the course of the free drying of the prepared hyaluronan–Septonex gels are shown in Figure 3, whereby the black and the red spectra represent those recorded at the start and the end of the experiment, respectively. As expected, drying of the sample is accompanied by decreasing intensity of the characteristic vibration bands of water molecules, in particular in the spectral region from 3,000–3,700 cm−1 (O–H stretching modes), 1,640 cm−1 (water bending modes), and at the spectral edge below 1,000 cm−1 (water rocking). These absorption bands predominate in the spectra collected at the beginning of the experiment and make a more detailed interpretation of the spectra of the highly hydrated samples impossible.
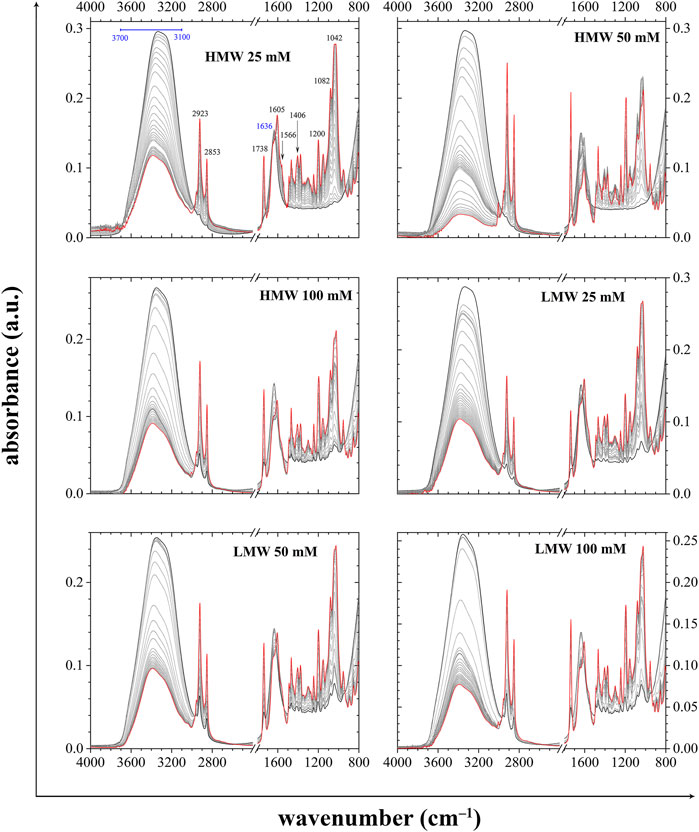
FIGURE 3. Development over time of the ATR-FTIR spectra of tested hyaluronan–Septonex hydrogels; black line: time zero, red line: final time.
On the contrary, in the last collected spectra, contributions from structural moieties found in the dispersed components of the gels are clearly visible. The first set of spectral attributes includes bands assigned to functional groups from a polysaccharide, that is, low and high molecular weight hyaluronan. The presence of carboxylate groups is revealed by the bands at 1,605 cm−1 and 1,406 cm−1, which are attributed to asymmetric and symmetric –
The second set of spectral features refers to surfactant, which was used as a crosslinking agent for forming hydrogels. The long aliphatic chains of surfactant (i.e., Septonex) are evaluated in the 3,000–2,800 cm−1 spectral range. The presence of aliphatic moieties is revealed by the two bands at 2,923 cm−1 and 2,853 cm−1, which are attributed to asymmetric and symmetric C–H stretching in –CH2– functional groups. The deformation vibration modes of methylene and methyl groups occur in the spectra at 1,467 cm−1 and 1,375 cm−1. A sharp band at around 1738 cm−1 is attributed to symmetric C=O stretching in alkyl–ester. Another characteristic ester absorption band is located at 1,245 cm−1 and can be ascribed to the symmetric C–C–O stretching of C–CO–O functional groups. All the spectra of hyaluronan hydrogels contain a sharp and intensive absorption band at 1,200 cm−1, corresponding to the C–N stretching of tertiary amine groups, which are in the form of salts.
When comparing the spectra of dried LMW HA–based gels, it can be seen that the relative intensity of characteristic bands of the two gel components changes corresponding to the increasing content of surfactant in the gel. This can be illustrated, for example, by the increasing relative height of the band at 1738 cm−1 (Septonex) compared to the intensity at 1,605 cm−1 (hyaluronan). However, among the gels prepared from HMW hyaluronan, the gel prepared with a 50 mM concentration of the surfactant obviously stands apart from this anticipated trend. It can be seen that in the last collected spectrum of this material, the vibration bands corresponding to Septonex are uncommonly sharp and are also more intensive than those corresponding to the total content of the surfactant. This interesting feature could be ascribed to the separation of the surfactant from the matrix of the dehydrated gel and its crystallization, as far as the crystallization is commonly accompanied by narrowing and intensification of the corresponding absorption bands (Sedláček et al., 2019; Jančíková et al., 2021).
In order to provide a more detailed resolution of the temporal course of the gel dehydration from the collected FTIR spectra, Figure 4 shows intensities of the absorption bands at selected characteristic vibration frequencies plotted as a function of time. The intensity of absorption at 3,300 cm−1 mainly represents the contribution of –OH groups and hence allows for monitoring the dehydration of the sample, while the signals of glycosidic bond (absorbance at 1,150 cm−1) and primary alcohols (1,020 cm−1) were chosen to follow the relative contribution of hyaluronan on the spectra over time. In addition, a 2D view of the spectra in the OH region in the course of time can be seen in Figure 5. Several interesting features can be found in the comparison of the time courses of the characteristic FTIR signals. First, in the initial period of drying, the gels show two types of behavior. For some of them (HMW 25 and 50 mM, LMW 25 mM), water signal starts to decrease immediately after the experiment starts. On the other hand, the remaining gels show more or less constant water-to-hyaluronan signal over quite a long period of time. This evidences higher stability of these gels against evaporative loss of water and, consequently, it indicates stronger binding of water in their matrix. Interestingly, these results are well consistent with the results of TGA, where the same gels (LMW 50 and 100 mM, HMW 100 mM) differed from the remaining group of three with the more intensive signs of water binding in their structure (lower RD, higher critical water content) as described earlier in more detail.
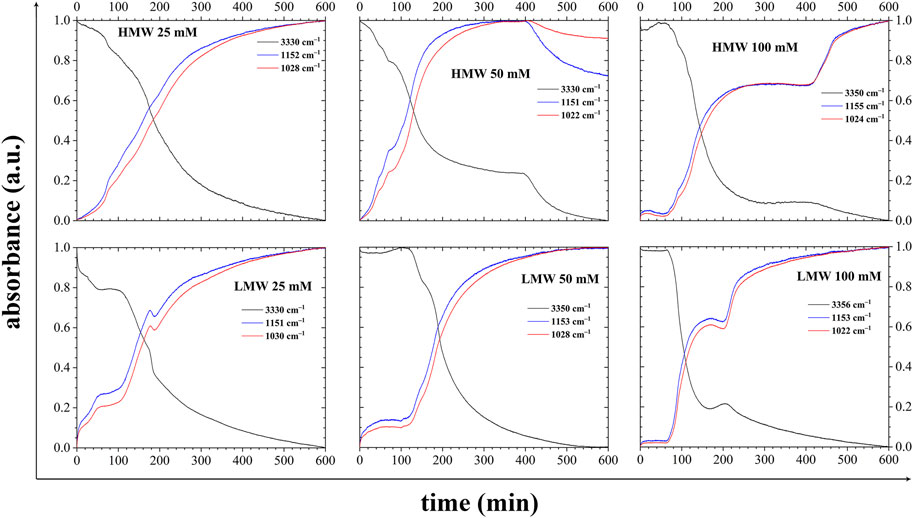
FIGURE 4. Time dependences of absorbances at frequencies characteristic for water (–OH at 3,360–3,330 cm−1) and for dry-matter content (glycosidic bond at 1,155–1,151 cm−1 and alcoholic bond at 1,030–1,022 cm−1), respectively, during the FTIR-assisted drying of the hydrogels.
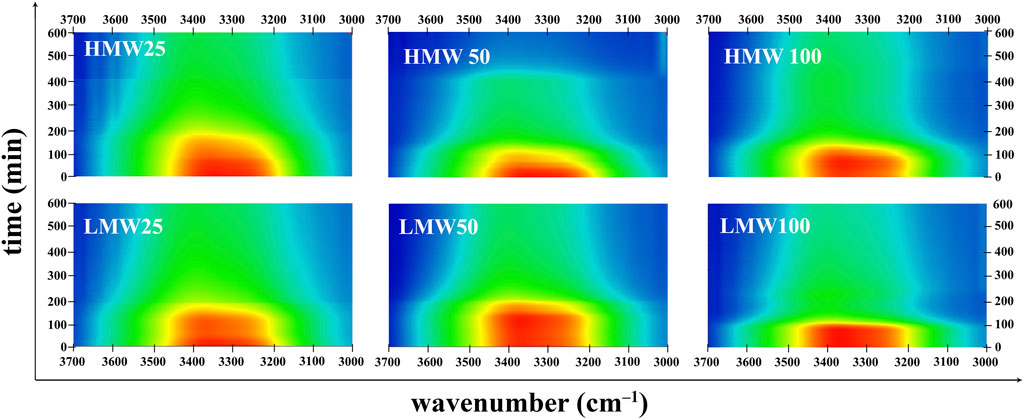
FIGURE 5. 2D time-resolved FTIR spectra of the drying of tested hyaluronan–Septonex hydrogels. Detail on the spectral region with characteristic water molecules vibration band (3,700–3,000 cm−1).
Moreover, the results shown in Figure 4 again confirm that the drying of the studied gels is not a continuous process, but it happens through several easily distinguishable steps. Most of them can hardly be interpreted without the support of another experimental approach. In particular, the steep significant change in the drying course that occurs at a drying time of about 400 h for HMW 50 and 100 mM deserves special attention. In the case of HMW HA–based gel prepared with 50 mM of Septonex, this sudden acceleration of the dehydration process is most pronounced, and it is accompanied by a decrease of the relative signal of hyaluronan. As far as the intensification of the surfactant signal and the manifestation of the spectral signs of its crystallization were described for this particular gel, it can be deduced that this increase in the dehydration rate may be connected with a liberation of the surfactant from the gel matrix and its solidification. Furthermore, this could indicate lower compatibility (or, in another perspective, lower strength of binding) between the surfactant and HMW hyaluronan as compared to its LMW counterpart. Finally, last but not least, looking back to the drying curves of HMW gels, this HA–surfactant separation could also be considered as a potential explanation for the additional change in the drying trend, which was observed only for the HMW HA–based gels (marked with dashed arrows in Figures 1 and 2).
In summary, the contributions of the two techniques are as follows: Thermogravimetry (in the described isothermal mode) was proved to be able to provide detailed insight into the dehydration kinetics of the gel and, thus, to bring indirect information on the strength of water binding in the hydrogel network. On the other hand, time-resolved IR spectroscopy complemented the study with a direct analysis of structural changes occurring in the gel during its dehydration. In this way, IR spectroscopy contributed to understanding the processes observed in thermogravimetry on the molecular level.
Conclusion
Water is an essential component of hydrogels and one of the main reasons why hydrogels are attractive for bio-related applications. Water in hydrogels is usually analyzed only for its amount and reported as mass content. The water content is determined by simple gravimetry—by weighing a hydrogel in its swollen state and after drying (water removal). Using a bit more complex but widely available instrumentation—thermogravimetry—more detailed insight into water binding within the hydrogel matrix can be obtained, and different types of binding can be distinguished. This approach is recommendable particularly for relative comparisons, for example, for comparison of hydrogels differing in their comparison, as illustrated in this work. However, thermogravimetry is a quantitative technique, and it does not provide information on the chemical or molecular basis of phenomena observed on thermograms. Thus, it is highly recommended to combine thermogravimetry with a spectroscopic technique providing qualitative chemical information. Here, we used another widely available and simply applicable technique—infrared spectroscopy in the ATR (ATR-FTIR) version. To support and add the thermogravimetry, infrared spectroscopy should be applied on hydrogels with different water content but otherwise the same composition. As shown in this work, this can be easily accomplished just with the ATR technique, which enables taking hydrogel spectra in time during its drying due to the free evaporation of water.
We hope that this “editorial view” will contribute to a broader application of the combined TG-IR approach in the study of hydrogel materials and the development of their applications, especially in bio-related areas where water is among the key players. Moreover, this work can be viewed as a specific example of the application of a combination of various physico-chemical and structure-mapping approaches in a non-traditional way (for example, thermogravimetry-kinetics for water binding), which we see as an underexplored area in hydrogel material research. We believe that such combinations could move further the frontiers of the development of advanced hydrogels for advanced applications. Deepening our understanding of the interconnections between the material internal structure, supramolecular architecture, and resulting application-relevant properties, such as the mechanical and transport performance, is crucial for the preparation of the tailor-made materials.
Data Availability Statement
The raw data supporting the conclusion of this article will be made available by the authors, without undue reservation.
Author Contributions
MP, VE, and PS contributed to the conception and design of the study. VE, MŘ, and MK performed the experiments. VE, PS, and MK performed the data analysis. PS wrote the first draft of the manuscript. MP and VE wrote sections of the manuscript. MP, PS, and VE revised and finalized the manuscript. All authors contributed to manuscript revision, read, and approved the submitted version. MP acquired the funding support.
Funding
This work was supported by the Czech Science Foundation (project No. 16-12477S).
Conflict of Interest
The authors declare that the research was conducted in the absence of any commercial or financial relationships that could be construed as a potential conflict of interest.
Publisher’s Note
All claims expressed in this article are solely those of the authors and do not necessarily represent those of their affiliated organizations, or those of the publisher, the editors, and the reviewers. Any product that may be evaluated in this article, or claim that may be made by its manufacturer, is not guaranteed or endorsed by the publisher.
Supplementary Material
The Supplementary Material for this article can be found online at: https://www.frontiersin.org/articles/10.3389/fmats.2022.931303/full#supplementary-material
References
Ahmad, M. B., and Huglin, M. B. (1994). DSC Studies on States of Water in Crosslinked Poly(methyl Methacrylate-Co-N-Vinyl-2-Pyrrolidone) Hydrogels. Polym. Int. 33, 273–277. doi:10.1002/pi.1994.210330306
Ball, P. (2008a). Water as an Active Constituent in Cell Biology. Chem. Rev. 108, 74–108. doi:10.1021/cr068037a
Bračič, M., Hansson, P., Pérez, L., Zemljič, L. F., and Kogej, K. (2015). Interaction of Sodium Hyaluronate with a Biocompatible Cationic Surfactant from Lysine: A Binding Study. Langmuir 31, 12043–12053. doi:10.1021/acs.langmuir.5b03548
Buchold, P., Schweins, R., Di, Z., and Gradzielski, M. (2017). Structural Behaviour of Sodium Hyaluronate in Concentrated Oppositely Charged Surfactant Solutions. Soft Matter 13, 2253–2263. doi:10.1039/c6sm02742c
Dreiss, C. A. (2020). Hydrogel Design Strategies for Drug Delivery. Curr. Opin. Colloid & Interface Sci. 48, 1–17. doi:10.1016/j.cocis.2020.02.001
Enev, V., Sedláček, P., Jarábková, S., Velcer, T., and Pekař, M. (2019). ATR-FTIR Spectroscopy and Thermogravimetry Characterization of Water in Polyelectrolyte-Surfactant Hydrogels. Colloids Surfaces A Physicochem. Eng. Aspects 575, 1–9. doi:10.1016/j.colsurfa.2019.04.089
Gallo, P., Amann-Winkel, K., Angell, C. A., Anisimov, M. A., Caupin, F., Chakravarty, C., et al. (2016). Water: A Tale of Two Liquids. Chem. Rev. 116, 7463–7500. doi:10.1021/acs.chemrev.5b00750
Garcia Garcia, C., and Kiick, K. L. (2019). Methods for Producing Microstructured Hydrogels for Targeted Applications in Biology. Acta Biomater. 84, 34–48. doi:10.1016/j.actbio.2018.11.028
Gradzielski, M., and Hoffmann, I. (2018). Polyelectrolyte-surfactant Complexes (PESCs) Composed of Oppositely Charged Components. Curr. Opin. Colloid & Interface Sci. 35, 124–141. doi:10.1016/j.cocis.2018.01.017
Grossutti, M., and Dutcher, J. R. (2016). Correlation between Chain Architecture and Hydration Water Structure in Polysaccharides. Biomacromolecules 17, 1198–1204. doi:10.1021/acs.biomac.6b00026
Jančíková, S., Dordevič, D., Sedláček, P., Nejezchlebová, M., Treml, J., and Tremlová, B. (2021). Edible Films from Carrageenan/orange Essential Oil/trehalose—Structure, Optical Properties, and Antimicrobial Activity. Polymers 13 (332), 1–19. doi:10.1007/s00253-018-09584-z
Khan, F., Atif, M., Haseen, M., Kamal, S., Khan, M. S., Shahid, S., et al. (2022). Synthesis, Classification and Properties of Hydrogels: Their Applications in Drug Delivery and Agriculture. J. Mater. Chem. B 10, 170–203. doi:10.1039/d1tb01345a
Kizilay, E., Kayitmazer, A. B., and Dubin, P. L. (2011). Complexation and Coacervation of Polyelectrolytes with Oppositely Charged Colloids. Adv. Colloid Interface Sci. 167, 24–37. doi:10.1016/j.cis.2011.06.006
Klučáková, M., Jarábková, S., Velcer, T., Kalina, M., and Pekař, M. (2019). Transport of a Model Diffusion Probe in Polyelectrolyte-Surfactant Hydrogels. Colloids Surf. A 573, 73–79.
Kocherbitov, V. (2016). The Nature of Nonfreezing Water in Carbohydrate Polymers. Carbohydr. Polym. 150, 353–358. doi:10.1016/j.carbpol.2016.04.119
Li, J., and Mooney, D. J. (2016). Designing Hydrogels for Controlled Drug Delivery. Nat. Rev. Mater 1, 1–17. doi:10.1038/natrevmats.2016.71
Lisuzzo, L., Cavallaro, G., Milioto, S., and Lazzara, G. (2022). Halloysite Nanotubes as Nanoreactors for Heterogeneous Micellar Catalysis. J. Colloid Interface Sci. 608, 424–434. doi:10.1016/j.jcis.2021.09.146
Lisuzzo, L., Cavallaro, G., Pasbakhsh, P., Milioto, S., and Lazzara, G. (2019). Why Does Vacuum Drive to the Loading of Halloysite Nanotubes? the Key Role of Water Confinement. J. Colloid Interface Sci. 547, 361–369. doi:10.1016/j.jcis.2019.04.012
Mayr, J., Saldías, C., and Díaz Díaz, D. (2018). Release of Small Bioactive Molecules from Physical Gels. Chem. Soc. Rev. 47, 1484–1515. doi:10.1039/c7cs00515f
Nordgård, C. T., and Draget, K. I. (2017). The Use of Hydrocolloids in Physical Modelling of Complex Biological Matrices. Food Hydrocoll. 68, 102–107. doi:10.1016/j.foodhyd.2016.09.033
Sedláček, P., Slaninová, E., Enev, V., Koller, M., Nebesářová, J., Krzyzanek, V., et al. (2019). What Keeps Polyhydroxyalkanoates in Bacterial Cells Amorphous? A Derivation from Stress Exposure Experiments. Appl. Microbiol. Biotech. 103, 1905–1917. doi:10.1016/j.carbpol.2017.04.087
Smilek, J., Jarábková, S., Velcer, T., and Pekař, M. (2019). Compositional and Temperature Effects on the Rheological Properties of Polyelectrolyte-Surfactant Hydrogels. Polym. (Basel) 11 (927), 1–19. doi:10.3390/polym11050927
Tolentino, A., Alla, A., Ilarduya, A. M. d., and Muñoz-Guerra, S. (2013). Comb-like Ionic Complexes of Hyaluronic Acid with Alkyltrimethylammonium Surfactants. Carbohydr. Polym. 92, 691–696. doi:10.1016/j.carbpol.2012.09.042
Ullah, F., Othman, M. B. H., Javed, F., Ahmad, Z., and Akil, H. M. (2015). Classification, Processing and Application of Hydrogels: A Review. Mater. Sci. Eng. C 57, 414–433. doi:10.1016/j.msec.2015.07.053
Uribelarrea, J. L., Pacaud, S., and Goma, G. (1985). New Method for Measuring the Cell Water Content by Thermogravimetry. Biotechnol. Lett. 7, 75–80. doi:10.1007/bf01026672
Keywords: hydration, hydrogel, IR spectroscopy, thermogravimetry, water binding
Citation: Enev V, Sedláček P, Řihák M, Kalina M and Pekař M (2022) IR-Supported Thermogravimetric Analysis of Water in Hydrogels. Front. Mater. 9:931303. doi: 10.3389/fmats.2022.931303
Received: 28 April 2022; Accepted: 30 May 2022;
Published: 06 July 2022.
Edited by:
Jie-Sheng Chen, Shanghai Jiao Tong University, ChinaReviewed by:
Giuseppe Cavallaro, University of Palermo, ItalyArtur J. M. Valente, University of Coimbra, Portugal
Copyright © 2022 Enev, Sedláček, Řihák, Kalina and Pekař. This is an open-access article distributed under the terms of the Creative Commons Attribution License (CC BY). The use, distribution or reproduction in other forums is permitted, provided the original author(s) and the copyright owner(s) are credited and that the original publication in this journal is cited, in accordance with accepted academic practice. No use, distribution or reproduction is permitted which does not comply with these terms.
*Correspondence: Miloslav Pekař, cGVrYXJAZmNoLnZ1dC5jeg==