 Guomeng He1
 Qianmiao Bu
- 1Sichuan Expressway Company Limited Chengyu Branch, Chengdu, China
- 2Rioh Traffic Safety Co., Ltd, Beijing, China
To improve the protective performance of old combined bridge barriers with non-standard sections, this article has improved the guardrail scheme. The newly improved guardrail is evaluated by finite element simulation, yield line theory calculation, and a crash test to see whether it reaches class SA protection. The results show that the blocking, redirecting, and buffering functions of the improved scheme meet the Standard for Safety Performance Evaluation of Highway Barriers (JTG B05-01-2013), and its protection class reaches class SA. The bridge barrier with strict deformation control cannot be evaluated by the yield line theory calculation alone. Thus, the evaluation should be assisted with finite element simulation and a crash test. The improved scheme has been successfully applied to engineering practice. With simple construction, safety, and reliability, the scheme effectively reduces engineering costs and improves the protective performance of old combined bridge barriers with non-standard sections.
Introduction
In 1994, China issued the Specification for Design and Construction of Expressway Safety Appurtenances, which became the first design specification for traffic safety facilities (JTJ 074-94, 1994). The first expressway on the Chinese mainland—the Shanghai–Jiading expressway—was completed in October 1988. According to the Technical Standard of Highway Engineering (JTJ 01-1988), the bridge of the highway designed before the release of the Specification for Design and Construction of Expressway Safety Appurtenances (JTJ 074-94, 1994) should be set up with a guardrail. However, this version of the standard has not clearly stipulated the form, shape, and protection class of the guardrail. As domestic traffic develops, the Design Specifications for Highway Safety Facilities (JTG D81-2006, 2006) and the Design Specifications for Highway Safety Facilities (JTG D81-2017, 2017) have been issued successively, stipulating the form, shape, and protection class of the guardrail.
For some combined bridge barriers built before 1994, the collision surface of their concrete base is different from the one recommended by JTJ 074-94, 1994, JTG D81-2006, 2006, and JTG D81-2017, 2017, which is a non-standard collision surface. Pursuant to the Technical Guide for Special Action for Enhancing Protective Ability of Highway Bridges (Highway Bureau of the Ministry of Transport, 2019), the safety performance shall be evaluated in accordance with the theoretical calculation method stipulated in the Appendix D of the Design Guidelines for Highway Safety Facilities (JTG/T D81-2017, 2017) or the Standard for Safety Performance Evaluation of Highway Barriers (JTG B05-01-2013, 2013) (hereinafter referred to as the “Standard”). For those that really need to be lifted, the method of yield line theoretical calculation can be used to design the structure of the guardrail lifting scheme. If sch1 conditions permit, a real vehicle collision test can be carried out.
In recent years, many studies on improving the protective performance of bridge barriers have been conducted at home and abroad (Huang et al., 2020; Mousavi et al., 2021; Zhang et al., 2022). Through finite element simulation and a crash test, Zhao et al. (2020a) determined an improvement scheme for the combined guardrail that connects the original concrete guardrail base with three beams. According to relevant specifications and standards, the strength of the guardrail components, the strength of the weak flange deck, and the anti-overturning performance of the guardrail were theoretically calculated. The finite element simulation of the guardrail was performed to constantly optimize the guardrail components and parameters. The safety performance of the guardrail was verified through a crash test, which showed that the protection class of the guardrail reached SS. Through deformation and energy absorption, the upper steel beam and column and the anti-obstruction block could effectively reduce the collision load transmitted to the bridge deck, and the weak flange deck met the bearing requirements.
To improve the protection class of NJ bridge barriers, Zhao et al. (2020b) analyzed and optimized six guardrail improvement schemes, one by one, with 3D finite element simulation, and finally determined a safe, applicable, and economical combined guardrail. This kind of guardrail has been applied to engineering practice and has achieved the expected effect.
To enhance the performance of a road–railway bridge barrier, Gong et al. (2021) studied the requirements for such bridges and found that they need to prevent small overturning from vehicle collisions and have high protection class. Therefore, Gong carried out survey analysis, finite element simulation, and a full-scale crash test. They concluded that the original guardrail did not meet the protection requirements. To solve this problem, they proposed a guardrail improvement scheme and verified its safety and reliability. The results showed that the protection class of the improved guardrail reached class SS and met the special requirements for the bridge barrier to protect against overturning.
After full investigation and research, Liu et al. (2021) used the original concrete guardrail base to make a transformed and reinforced guardrail. The full-scale crash test was conducted in accordance with the Standard for Safety Performance Evaluation of Highway Barriers. The test showed that the protection class of the transformed guardrail reached class SS, indicating that the bridge barrier is both reliable and safe.
The Transportation Research Board (TRB) published the Design and Management of Historic Roads (McCahon et al., 2012), which studied the design and management of operating roads and the improvement methods of bridge barriers.
The Indiana Department of Transportation and Purdue University released the Guardrails for Use on Historic Bridges (Frosch,et al., 2016; Frosch and Morel, 2016) in 2016, which investigated the current situation of numerous bridge barriers, and proposed modified schemes and detailed design drawings.
However, few studies have focused on the improvement of old combined bridge barriers with non-standard sections (Bai et al., 2021; Zhou et al., 2022). This study has designed a guardrail improvement scheme and evaluated its class SA protective ability with finite element simulation, yield line theory calculation, and a crash test.
Analysis of the collision surface of combined bridge barriers
Figure 1 shows the collision surface of the improved combined bridge barrier (F) and the basic combined bridge barrier (NJ) recommended by JTJ 074-94, 1994, JTG D81-2006, 2006, and JTG D81-2017, 2017. The slope toe is 55°, and the point of gradient change is 84°. As for the collision surface of the old combined bridge barrier with a non-standard section, the slope toe is 45°, and the point of gradient change is 81°.
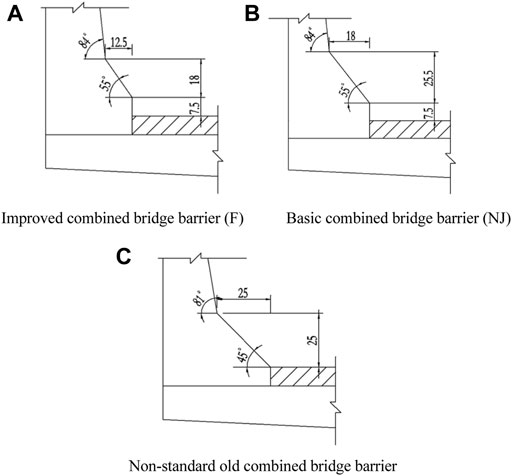
FIGURE 1. Collision surface of combined bridge barriers. (A) Improved combined bridge barrier (F). (B) Basic combined bridge barrier (NJ). (C) Non-standard old combined bridge barrier.
F is slightly better than the NJ. This is due to the smaller height and width of the slope, on which the front wheels of the truck will not climb (JTJ 074-94, 1994).
The concrete section at the lower part of the NJ barrier is the type recommended by JTG 074-94, with a slope toe angle of 55°. After the collision, the vehicle can easily climb the NJ section and steer out of the barrier, so it can reduce the damage to the vehicle and protect passengers in the vehicle. However, the NJ barrier cannot stop the high-speed heavy vehicle from crossing the guardrail and rushing out of the road (JTJ 074-94, 1994).
For the non-standard old combined bridge barrier, the concrete slope toe is 45°, and the slope is bigger, making it easier for the vehicle to climb onto the guardrail. After design and optimization, the optimal scheme is obtained through finite element simulation and theoretical research. Then, a crash test is performed to verify the results.
Evaluating indicators
The Appendix D, Scheme 1–3 belongs to Design Guidelines for Highway Safety Facilities (JTG/T D81-2017, 2017) specifies the method for evaluating the bridge barriers: When the bearing capacity of the bridge barrier components is greater than or equal to the standard value of the vehicle collision load, the bearing capacity of the guardrail will meet the requirements.
The finite element simulation and a crash test for vehicle safety are carried out to test the bridge barrier based on the standard. All indicators shall meet the standards for the blocking, redirecting, and buffering functions of the guardrail.
To verify the bridge barrier improvement scheme, the collision points of car and passenger bus (including extra bus) should be located at 1/3 length from the starting point to the terminal of the standard guardrail, along the driving direction of the test vehicle (Gu et al., 2022; Lu et al., 2022).
The blocking, redirecting, and buffering functions of the guardrail are tested and analyzed based on the crash test (the crash test results are shown in Table 1).
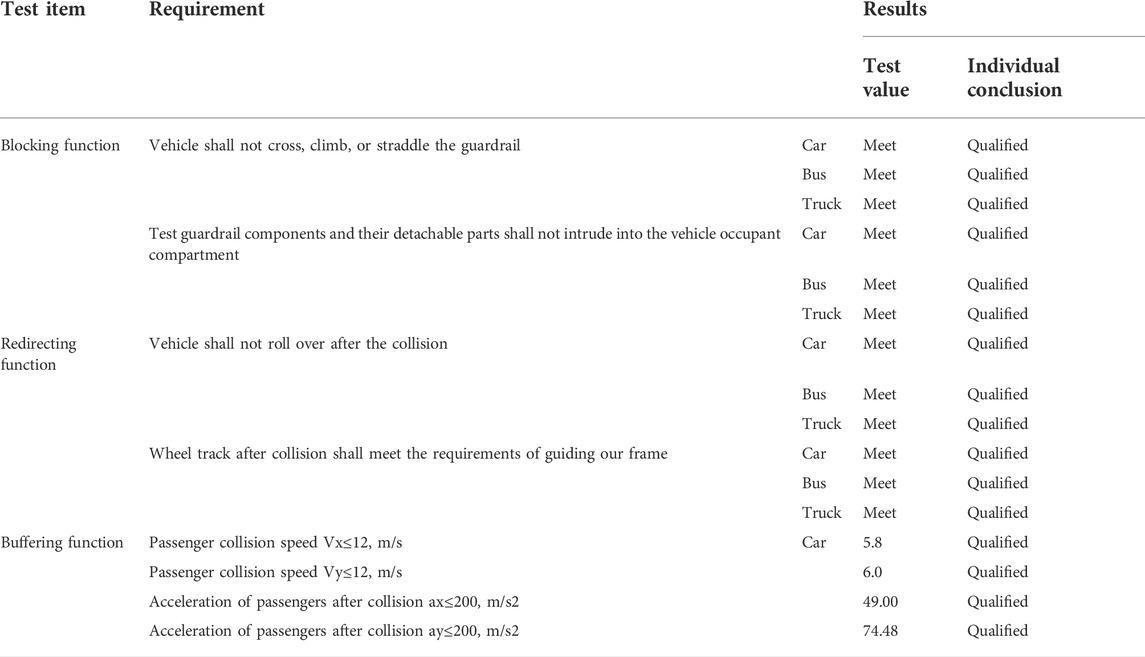
TABLE 1. Crash test results.
The blocking function requires the guardrail to prevent the vehicle from crossing, climbing, or straddling the guardrail. During the test, fragments of the guardrail system cannot penetrate the passenger compartment. Both indicators of the blocking function are evaluated by collision videos and post-collision photos.
The buffering function requires that both the Y-axis and X-axis components of the passenger collision speed shall not exceed 12 m/s. After the collision, the Y-axis and X-axis components of the passenger acceleration shall not exceed 200 m/s2.
The redirecting function requires that the vehicle shall not turn over after the collision, and the trajectories of the vehicle after leaving the exit point shall meet the requirements of the exit box.
Design of the improvement schemes
The guardrail base of the non-standard collision surface is 56 cm high, and the angle of the slope toe is 45°. The beam-column structure is added to the upper part of the guardrail base by implanting steel bars. To improve the protective ability of the guardrail, three beam-column improvement schemes (schemes 1, 2, and 3) are designed (Figure 2)
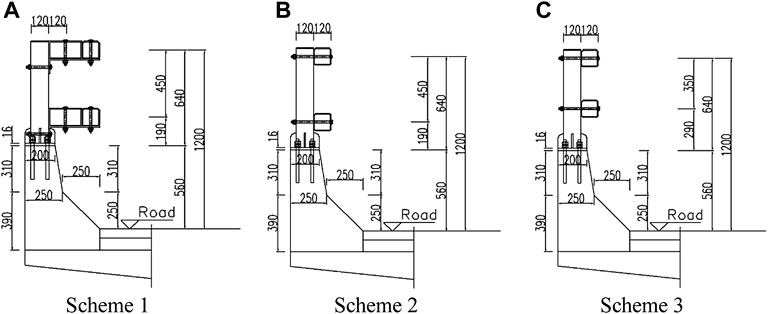
FIGURE 2. Beam-column improvement schemes. (A) Scheme 1. (B) Scheme 2. (C) Scheme 3.
Scheme 1 has removed the upper old steel beams and steel columns of the old bridge barrier with the non-standard section and retained the original concrete base. Two beams and flange columns are added in the upper part so that the center height of the upper beam is 120 cm, and the center height of the lower beam is 75 cm. To fully use the beam, a long anti-obstruction block is used to make the collision surface of the beam and the elevation of the lower concrete slope toe at the same level. The spacing between the columns is 2 m, and the beams are connected with splice bolts.
Scheme 2 is an improved version of scheme 1. It has removed the long anti-obstruction block and directly connects the beams and the flange columns with bolts. The center height of the beams remains unchanged.
Scheme 3 is a modified version of scheme 2. It has lifted the lower beam up by 10 cm to shorten the net distance between the upper and lower beams. This approach makes the installation of the lower flange column more convenient and effectively reduces the chances of the vehicle colliding with the columns. The central height of the upper beam is still 120 cm.
Analysis of the protective ability of the improvement schemes
Finite element simulation
The finite element simulation model is established. The material of beams and columns includes multilinear, elastic-plastic, and isotropic Q235 steel, with a density of 7.85 kg/m3, a Poisson ratio of 0.25, and the elastic modulus of 210 GPa. The section property selects the Belytschko–Tsay shell element with a thickness of 6 mm. The guardrail and bridge flange plate is made of concrete. C25 concrete is for the guardrail, and C40 concrete is for the bridge flange plate. The section property selects the solid element. The steel bar selects the line element. The material characteristics are the same as beams and flange columns. The contact among implanting bolts, steel bars, and concrete is calculated by the Lagrangian algorithm. The upper structure and the lower guardrail adopt the single contact, and the guardrail and the vehicle adopt the surface-to-surface contact.
Figure 3 shows the guardrail with the non-standard section in the three improvement schemes. After the class SA 14-ton bus impacts the guardrail at a speed of 80 km/h, it does not cross, climb, or straddle the guardrail. The blocking function of the guardrail in all three improvement schemes meets the standard. Moreover, scheme 2 is more convenient than scheme 1, after the anti-obstruction block is removed. Scheme 3 is more convenient than scheme 2 after the lower beam is installed higher than before. Thus, scheme 3 is selected to undergo the next test.
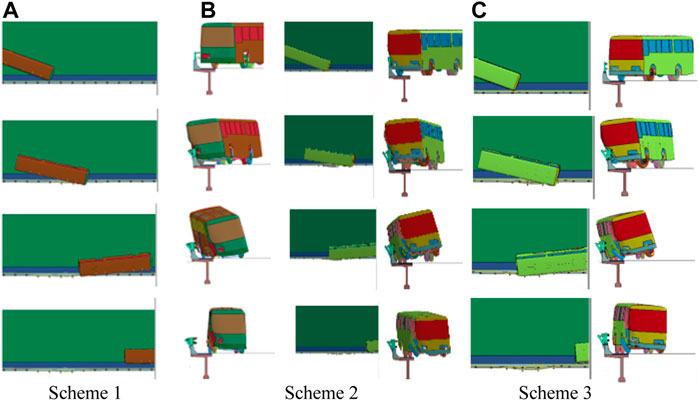
FIGURE 3. Driving process of the bus impacting the guardrail with the non-standard section. (A) Scheme 1. (B) Scheme 2. (C) Scheme 3.
Figure 4 shows the results of the class SA 18-ton truck and the class SA 1.5-ton car impacting the guardrail in scheme 3 at a speed of 60 km/h and 100 km/h, respectively. Both the truck and the car do not cross, climb, or straddle the guardrail. Instead, they drive off the guardrail normally to the roadway. Therefore, the blocking and redirecting functions of the guardrail meet the standard.
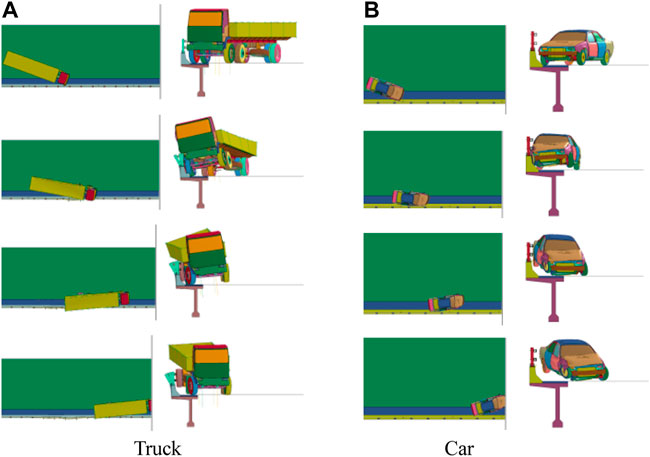
FIGURE 4. Driving process of the truck and car impacting the guardrail in scheme 3. (A) Truck. (B) Car.
Theoretical calculation
The protective ability of scheme 3 is improved according to the yield line theory calculation in Appendix D of the Design Guidelines for Highway Safety Facilities (JTG/T D81-2017, 2017).
Based on the formula of the standard section, the bearing capacity of the lower non-standard concrete collision surface (Rw) in case of failure is 448 kN.
Rw——the bearing capacity of concrete in case of failure
Lt——load distribution length
Lc——the critical length at which the yield line forms
Mb——the additional bending bearing moment of the beam at the top of the guardrail except for Mw
Mw——the bending bearing moment of the guardrail about its vertical axis
Mc——the bending bearing moment of the cantilever guardrail about the longitudinal axis of the bridge
H——the effective height of the guardrail
The critical length at which the yield line forms, namely, the top failure length of the concrete (Lc), is 2.5 m.
The failure mode of the beam is the three-span failure, and the bearing capacity (RR) is 70 kN.
RR——ultimate resistance of the one-span beam
Mb——bending moment of the inelastic yield line of all beams constituting the plastic hinge
Pp——shear force is borne by a single column corresponding to Mpost
Mpost ——plastic bending bearing moment of a single post
N——beam span
L——post spacing
After combining the bearing capacity of the upper beam and column with the bearing capacity of the lower non-standard concrete collision surface, the failure of the metal beam midspan occurs first after the vehicle collision, and the total bearing capacity of the guardrail (
Pursuant to the Design Guidelines for Highway Safety Facilities (JTG/T D81-2017, 2017), the standard load for the vehicle’s transverse collision with the class SA bridge barrier is 410 kN. After theoretical calculation, the bearing capacity of Scheme 3 reaches Class SA.
Verification of the crash test
Based on the class SA crash test stipulated in the standard, a crash test of scheme 3 is verified. The condition of the crash test is the same as that of finite element simulation.
Figure 5 shows how the car, bus, and truck crash into the guardrail, respectively. They do not cross, climb, or straddle the guardrail. Instead, all of them drive off the guardrail normally to the roadway. This proves that the blocking function of the guardrail meets the standard.
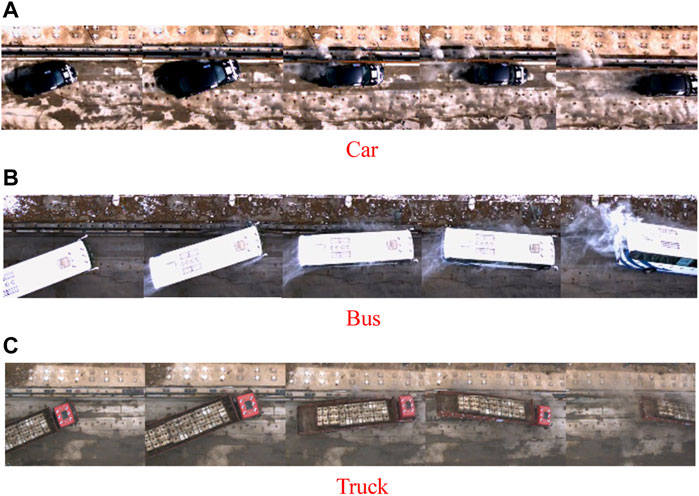
FIGURE 5. Schematic diagram of the driving process of the car, bus, and truck (left to right). (A) Car. (B) Bus. (C) Truck.
Figure 6 shows the wheel trajectories of the car, bus, and truck after they leave the exit point. The trajectories meet the requirements of the exit box, indicating that the redirecting function of the guardrail meets the standard.
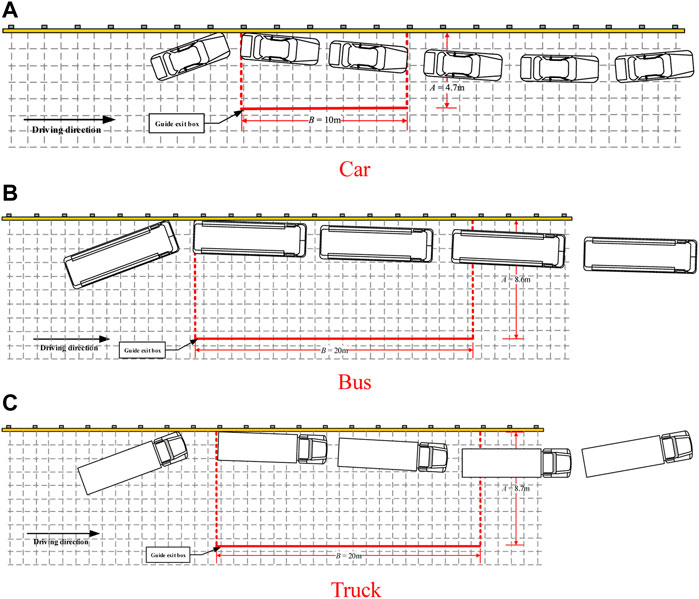
FIGURE 6. Vehicle trajectories of the car, bus, and truck (left to right). (A) Car. (B) Bus. (C) Truck.
Figure 7 shows the time history curve of the Y-axis and X-axis accelerations at the CG of the car. Using the acceleration at CG, the absolute values of the Y-axis and X-axis components of the passenger collision speed are calculated as vx = 5.8 m/s and vy = 6.0 m/s, respectively. Both of them are less than 12 m/s, meeting the standard. The maximum absolute values of the 10-ms interval average value of the Y-axis and X-axis accelerations after the collision of the Car are ax = 49 m/s2 and ay = 74.48 m/s2, respectively. Both of them are less than 200 m/s2, meeting the standard. This shows that the buffering function of the guardrail meets the standard.
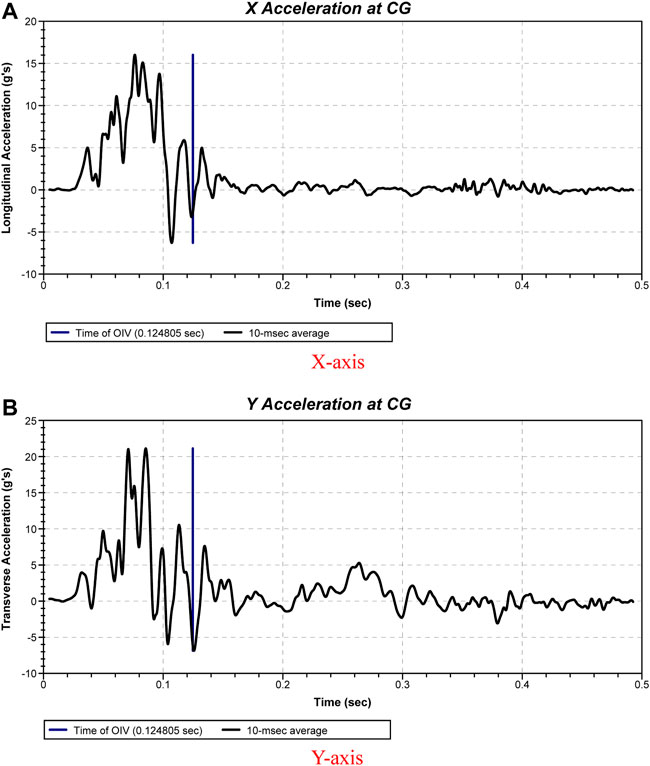
FIGURE 7. Time history curve of the Y-axis and X-axis accelerations at CG of the car. (A) X-axis. (B) Y-axis.
Comparative analysis of the verification methods
According to the finite element simulation, yield line theory calculation, and the crash test, the protective ability of scheme 3 reaches class SA. The calculation results of the three verification methods are slightly different, especially the yield line theory calculation. This is because the yield line theory calculation is a simplified method for non-visual verification that cannot intuitively obtain the effect after the guardrail collision. Finite element simulation and real vehicle crash tests are highly visualized. The combination of yield line theory calculation and finite element simulation can effectively improve the success rate of the crash test.
Three indicators are used to compare the results of the verification methods and they are the critical length at which the yield line forms, the number of damaged spans of the beam, and the maximum transverse dynamic deformation of the beam.
As shown in Figure 8, the number of damaged spans of the beam is 3 by yield line theory calculation; the number of damaged spans of the bus is 3 by finite element simulation; and the failure mode of the beam of the truck is the three-span failure, which agrees with the theoretical calculations. The yield line theory can neither calculate the number of damaged spans of the beam based on different vehicle types nor can it obtain the deformation value of the beam.
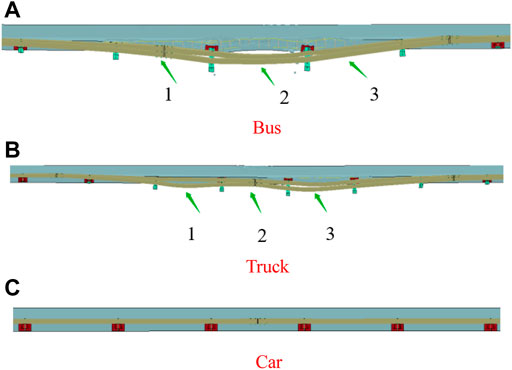
FIGURE 8. Number of damaged spans of the beam by finite element simulation. (A) Bus. (B) Truck. (C) Car.
Under finite element simulation, the beam failures of the bus and truck are different (Figure 9). After the impact of the bus, the second beam midspan shows a maximum beam deformation of 51.4 cm. After the impact of the truck, the first and the third beam midspans also show large deformation values of 38.8 and 46.3 cm, respectively. This is due to the truck body and the rear container’s impact on the guardrail. The upper beam has no deformation after the impact of the car. After the crash test, the maximum dynamic deformation of the beam is 45 cm for the bus, 61 cm for the truck, and 0 cm for the car.
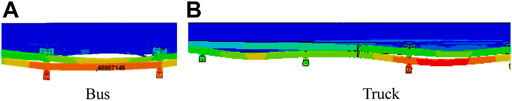
FIGURE 9. Beam deformation by finite element simulation. (A) Bus. (B) Truck.
The top concrete failure length is 2.5 m by yield line theory calculation (Figure 10). The finite element simulation shows that three spans of the guardrail are damaged by the crash of the bus, with a length of 5 m; and three spans are damaged by the truck, with a length of only 3 m. The bus has a longer damage length and higher damage degree than the truck. The damaged spans by the car can be ignored. The crash test shows that the bus has damaged 6 m of the concrete guardrail, with three spans and four columns involved. The truck has crashed and damaged three spans of the concrete guardrail, with a length of 6 m. The length and degree of the damage to the truck are basically the same as those to the bus. The crash of the car has not damaged the guardrail system.
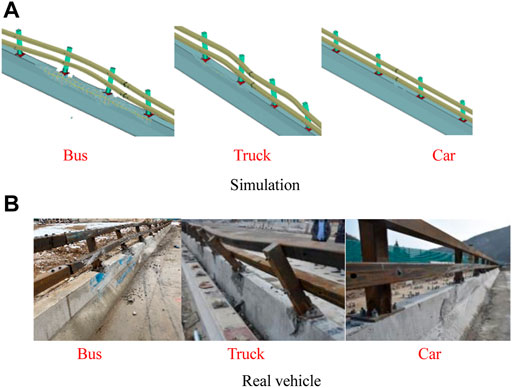
FIGURE 10. Critical length at which the yield line forms. (A) Simulation. (B) Real vehicle.
The damage forms of the concrete and the upper beam by finite element simulation and a crash test are further compared, as shown in Figure 11. The finite element simulation of the three models is basically consistent with the real car collision test, and the class SA crash test results verify the effectiveness of finite element simulation.
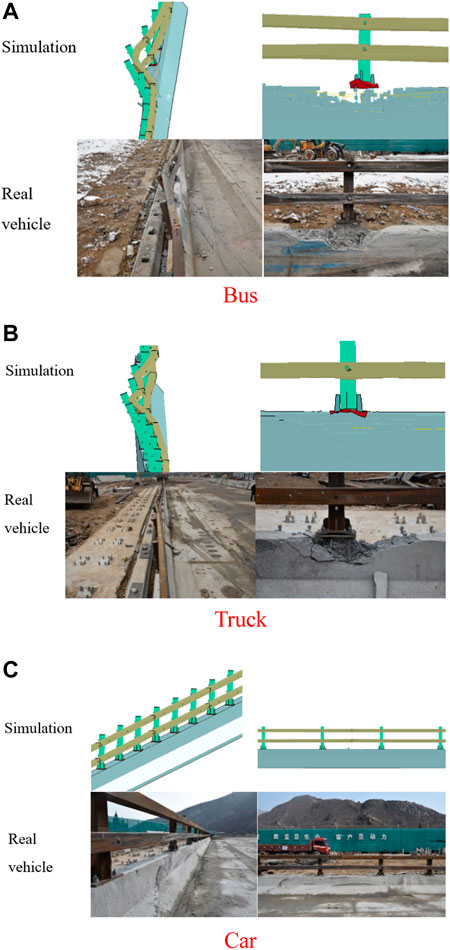
FIGURE 11. Comparison of the guardrail damage by a crash test and finite element simulation.
According to the analysis of the damaged guardrail, it is found that the elevated bridge guardrail will transmit the collision force to the beam after the vehicle hits the beam. The beam will then disperse the collision force to the column, which will be transmitted to the flange column, and then to the concrete base until it is transmitted to the bridge deck. As shown after the collision of the bus and the truck, the large deformation of the beam and the column absorbs part of the collision energy. The concrete base is also damaged in the triangular area at the flange column, as shown by the damaged concrete at the flange after the impact of the bus and the truck, which dissipates part of the collision energy. The overall protection capacity of the guardrail after the final lifting is effectively improved.
The critical length at which the yield line forms, the number of damaged spans of the beam, and the maximum transverse dynamic deformation value of the beam by yield line theory calculation, finite element simulation, and the crash test are summarized in Table 2. The similarity rates of the three indicators by finite element simulation and the crash test are 83.33%, 100%, and 75.9%, respectively; the similarity rates of the three indicators by yield line theory calculation and the crash test are 41.67% and 100%, respectively.
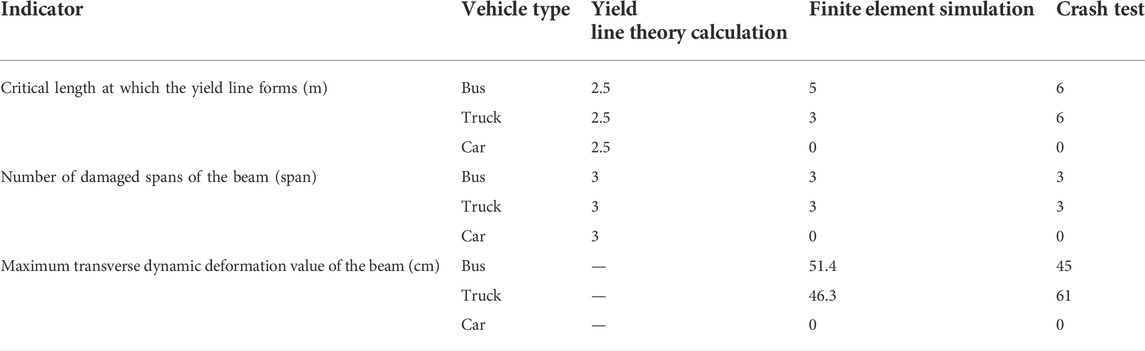
TABLE 2. Comparative analysis of the three verification methods.
As for the length of the critical yield line, the similarity between the simulation analysis and real vehicle collision test is 83.33%, which is better than the theoretical calculation method of 41.67%. It is preferable to combine simulation analysis with a real vehicle collision test. According to the analysis of the damaged beam span, the simulation analysis and the theoretical analysis are consistent with the real vehicle crash test. However, the theoretical calculation method cannot analyze the maximum dynamic deformation of the beam, and only the auxiliary simulation and real vehicle collision test can be used.
Engineering application
After verification by the crash test, the protective ability of scheme 3 reaches class SA, so the scheme can be applied to engineering practice. Scheme 3 has already been applied to pilot projects and can be widely promoted in the future.
Before the implementation, managing traffic at the construction workplace is an important part of site safety. During the operation, original beams and columns on the upper part are removed. Then, the original anti-collision guardrail base is drilled with a 22-mm drill bit. The drilling depth is 25 cm. After clearing the holes, the bolts (M20 mm 300 mm, Q235 steel) are implanted at a depth of 25 cm. After the complete solidification of implanting adhesive, flange columns are installed (flange plate 200 × 300 × 16, column 120 × 120 × 5.75 × 696 mm, Q235 steel). The next step is to install the beams (120 × 120 × 5.75 × 5,990 mm) and connect the columns and the beams with the connecting bolts (16 × 280 mm, level 8.8). Beam casings (100 mm × 100 × 5.75 × 500 mm) are used for transverse connection, and splicing bolts (M16 × 160 mm, level 8.8), for fixing. Photographs of the site construction are shown in Figure 12.
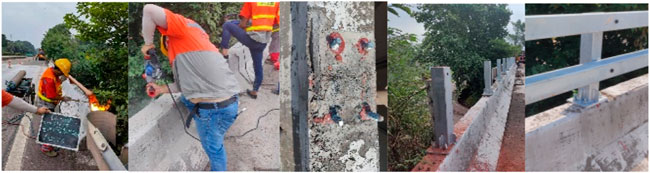
FIGURE 12. Photographs of site construction.
The installation works have improved the old combined bridge barrier with a non-standard section to class SA (Figure 13). The study provides a reference for improving the bridge barrier’s collision surface to satisfy the new specification. This study uses the base of the original bridge barrier with a non-standard section. In this way, the loss of resources is largely avoided, and the construction time becomes shorter. Moreover, it reduces the demolition construction cost and the traffic organization cost. The method of guardrail construction has lower difficulty and safety risks during construction.
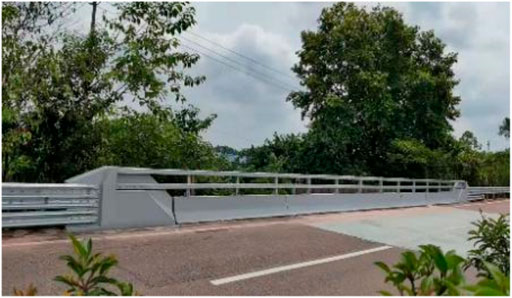
FIGURE 13. Pilot installation effect.
Summary
(1) In this article, an improvement scheme of an old combined bridge barrier with a non-standard section has been designed, and its class SA protective ability is evaluated by finite element simulation, yield line theory calculation, and a crash test. The results show that the blocking, redirecting, and buffering functions of the improvement scheme meet the standard, and its protection class reaches SA.
(2) For the bridge barrier that has strict deformation control, using yield line theory calculation alone cannot achieve the best evaluation and verification effect. Thus, it should be assisted with the finite element simulation and the crash test.
(3) The improvement scheme has been successfully applied to engineering practice. With simple construction, safety, and reliability, the scheme effectively reduces engineering costs and improves the protective performance of the old combined bridge barriers with non-standard sections.
Data availability statement
The original contributions presented in the study are included in the article/Supplementary Material; further inquiries can be directed to the corresponding author.
Ethics statement
Written informed consent was obtained from the individual(s) for the publication of any potentially identifiable images or data included in this article.
Author contributions
GH contributed to the conception and design of the study. YR, CS, YD, YT, and QD organized the database. GH, CW, and QB performed the statistical analysis. GH wrote the first draft of the manuscript. All authors contributed to manuscript revision, read, and approved the submitted version.
Funding
This work was supported by the “Study on old bridge barrier and highway barriers of the median opening of Cheng-Yu Expressway” [No. CYHL].
Conflict of interest
Authors GH, YR, CS, YD, YT, and QD are employed by the Sichuan Expressway Company Limited Chengyu Branch. Authors CW and QB are employed by Rioh Traffic Safety Co., Ltd.
The authors declare that the research was conducted in the absence of any commercial or financial relationships that could be construed as a potential conflict of interest.
Publisher’s note
All claims expressed in this article are solely those of the authors and do not necessarily represent those of their affiliated organizations, or those of the publisher, the editors, and the reviewers. Any product that may be evaluated in this article, or claim that may be made by its manufacturer, is not guaranteed or endorsed by the publisher.
References
Bai, Y., Nardi, D. C., Zhou, X., Picón, R. A., and Flórez-López, J. (2021). A new comprehensive model of damage for flexural subassemblies prone to fatigue. Computers & Structures 256, 106639. doi:10.1016/j.compstruc.2021.106639
Frosch, R. J., Kreger, M. E., and Clauss, A. J. (2016). Guardrails for use on historic bridges volume 1—replacement strategies. Indiana, United States: Purdue University. Joint Transportation Research Program.
Frosch, R. J., and Morel, A. J. (2016). Guardrails for use on historic bridges volume 2—bridge deck overhang design. Indiana, United States: Purdue University. Joint Transportation Research Program.
Gong, S., Guo, H., Liu, H., Kang, H. J., Yang, F. Y., and Yan, S. M. (2021). Study on improving the safety performance of highway barrier cross railway bridge. Highway 4, 321–326.
Gu, M., Mo, H., Qiu, J., Yuan, J., and Xia, Q. (2022). Behavior of floating stone columns reinforced with geogrid encasement in model tests. Front. Mater. 9, 980851. doi:10.3389/fmats.2022.980851
Highway Bureau of the Ministry of Transport (2019). Technical Guide for special action for enhancing protective ability of highway bridges. Beijing, China: China Communications Press.
Huang, H., Huang, M., Zhang, W., Pospisil, S., and Wu, T. (2020). Experimental investigation on rehabilitation of corroded RC columns with BSP and HPFL under combined loadings. J. Struct. Eng. 146 (8), 4020157. doi:10.1061/(ASCE)ST.1943-541X.0002725
JTG B05-01-2013 (2013). Standard for safety performance evaluation of highway barriers. Beijing, China: China Communications Press.
JTG D81-2006 (2006). Design specifications for highway safety Facilities. Beijing, China: China Communications Press.
JTG D81-2017 (2017). Design specifications for highway safety Facilities. Beijing, China: China Communications Press.
JTG/T D81-2017 (2017). Design Guidelines for highway safety Facilities. Beijing, China: China Communications Press.
JTJ 074-94 (1994). Specification for Design and Construction of expressway safety Appurtenances. Beijing, China: China Communications Press.
Liu, H., Ma, Q., Kang, H. J., Gong, S., Deng, B., and Yan, S. M. (2021). Improvement and application of old-type combined bridge barrier. Highway 2021 (2), 114–118.
Lu, S., Ban, Y., Zhang, X., Yang, B., Liu, S., Yin, L., et al. (2022). Adaptive control of time delay teleoperation system with uncertain dynamics. Front. Neurorobot. 16, 928863. doi:10.3389/fnbot.2022.928863
McCahon, M. E., Sutherland, L., and Shaup, S. (2012). Design and management of historic roads. Washington, DC: The National Academies Press.
Mousavi, A. A., Zhang, C., Masri, S. F., and Gholipour, G. (2021). Structural damage detection method based on the complete ensemble empirical mode decomposition with adaptive noise: A model steel truss bridge case study. Structural Health Monitoring 21 (3), 887–912. doi:10.1177/14759217211013535
Zhang, W., Liu, X., Huang, Y., and Tong, M. N. (2022). Reliability-based analysis of the flexural strength of concrete beams reinforced with hybrid BFRP and steel rebars. Archiv.Civ.Mech.Eng 22, 171. doi:10.1007/s43452-022-00493-7a
Zhao, Q. Y., Bu, L. T., Wu, J. P., Meng, T., and Wang, C. H. (2020a). Simulation and experimental study of a 3-beam combined bridge barrier. Highw. Eng. 45 (5), 135–141. doi:10.19782/j.cnki.1674-0610.2020.05.023
Zhao, Q. Y., Zhang, Y. Q., Meng, T., and Bu, Q. M. (2020b). Design optimization of combined bridge barrier based on simulation analysis. J. China & Foreign Highw. 40 (6), 145–149. doi:10.4028/www.scientific.net/AMM.97-98.100
Keywords: non-standard collision surface, old bridge barrier, finite element, yield line theory calculation, a crash test
Citation: He G, Ren Y, Sun C, Deng Y, Tan Y, Deng Q, Wang C and Bu Q (2022) Experimental research and application of old combined bridge barriers with non-standard sections. Front. Mater. 9:948914. doi: 10.3389/fmats.2022.948914
Received: 08 July 2022; Accepted: 01 September 2022;
Published: 23 September 2022.
Edited by:
Jie Xu, Tianjin University, ChinaCopyright © 2022 He, Ren, Sun, Deng, Tan, Deng, Wang and Bu. This is an open-access article distributed under the terms of the Creative Commons Attribution License (CC BY). The use, distribution or reproduction in other forums is permitted, provided the original author(s) and the copyright owner(s) are credited and that the original publication in this journal is cited, in accordance with accepted academic practice. No use, distribution or reproduction is permitted which does not comply with these terms.
*Correspondence: Qianmiao Bu, cWlhbm1pYW9idUAxNjMuY29t