 Muhammad Monirul Islam
 Junji Sawahata
 Katsuhiro Akimoto1
- 1Faculty of Pure and Applied Sciences, University of Tsukuba, Tsukuba, Japan
- 2Alliance for Research on the Mediterranean and North Africa (ARENA), University of Tsukuba, Tsukuba, Japan
- 3National Institute of Technology, Ibaraki College, Hitachinaka, Japan
Silicon (Si) films were obtained through aluminothermic reduction of the quartz (SiO2) substrates, where the surface of the quartz in contact with the deposited aluminum (Al) layer has been converted to film Si during high-temperature annealing following reduction reaction. X-ray diffraction (XRD) patterns and Raman spectra show dominating peaks corresponding to elemental Si in the obtained films. Energy dispersive spectroscopy (EDS), as well as XRD of the obtained Si layer, suggests that reduction products consist of mainly elemental Si mixed with oxides of Al-related phases. Both the higher reaction temperature and high initial Al-content (larger thickness of Al film in Al/SiO2 structure), studied in this paper, were found in favor of obtaining higher contents of Si in the obtained films. Thus, crystallinity and quality of the obtained Si-layer improve with the increase of both reduction temperature as well as thickness of the Al layer, as confirmed by XRD and Raman spectra. The aluminothermic reduction mechanism has been discussed using XRD as well as a ternary phase diagram of the constituent elements, obtained from EDS data. Crystalline nature (nanocrystal to microcrystal to polycrystal) and the crystalline quality of the obtained Si layers were found to be affected by the thickness of the deposited Al layer on SiO2 substrates.
Introduction
Silicon (Si) is the second most abundant element in the earth’s crust, found mainly in the form of silica (SiO2). Thus, Si becomes the most used semiconductor material that contributes to various fields ranging from large-scale to micro-electronics including photovoltaics, energy storage devices, photonics, bioelectronics, etc. (Birner et al., 2001; Teki et al., 2009; Rockett, 2010; Han et al., 2011; Yamaguchi et al., 2018). However, the application of Si largely depends on its crystalline nature which varies from nanocrystalline silicon (nc-Si) to polycrystalline silicon (poly-Si) to bulk crystals. Due to its relatively larger bandgap and strong luminescent properties in the visible range, nc-Si is used in the field of microelectronics, energy conversion devices (Gribov et al., 2017), anodic materials in Li-ion batteries (Green et al., 2003), sensors, light-emitting devices, catalytic materials (De La Torre et al., 2003; Gonzalez and Veinot, 2016; Potemkin et al., 2018), etc. While poly-Si and single-crystalline bulk silicon are widely used in photovoltaics, and various fields of electronics.
In general, silicon oxides such as silica and silicates are commonly utilized to prepare Si materials via a high-temperature reduction process.
The reduction reaction of any oxides to produce free metal is decided by the Gibbs free energy (ΔG) of a reaction, which is a measure of the thermodynamic driving force to make a reaction to occur. A given metal can reduce the oxides of all other metals when the reduction reaction is associated with a negative value of ΔG. The more the negative value, the more spontaneous the reaction is. An Ellingham diagram is a plot of ΔG of metal oxidation reaction versus temperature. It shows the temperature dependence of the stability of metal oxides (Ellingham, 1944). According to Ellingham diagram, solid carbon can work as a reducing agent for most of the metal oxides at very high temperature. Thus, for commercial applications, currently, high-purity Si is obtained through the carbothermic reduction of SiO2 at ∼ 2000°C (Zulehner et al., 1995). The carbothermic reduction process, which uses solid carbon or coke as a reducing agent and is involved with multiple steps, leads to significant energy consumption along with a considerable amount of carbon-dioxide emissions, thus eventually poses great concerns to the environment. In addition, for specific applications, poly-Si is obtained through the crystallization of amorphous Si using various technology, e.g., solid-phase crystallization (SPC), laser-induced crystallization (LIC), and aluminum (Al) induced crystallization, etc (Matsuyama et al., 1996; Gall et al., 2002; Huang et al., 2013). On the other hand, nc-Si has been obtained through recrystallization of amorphous Si, or direct deposition of nc-Si using various complex methods including plasma-enhanced chemical vapor deposition (CVD), hot wire CVD, glow-discharge CVD, sputtering, etc. (Goncalves et al., 2002; Funde et al., 2008). According to the Ellingham diagram, other than carbon, several other materials, such as lithium (Li), calcium (Ca), magnesium (Mg), and aluminum (Al), etc. Can be used as reductant metals to reduce SiO2 and liberate elemental Si by removing O2 (Ellingham, 1944). Several researchers have already reported the magnesiothermic reduction of SiO2 at a temperature as low as around the melting temperature of magnesium (Entwistle et al., 2018; Tan et al., 2021). Mg is supposed to be a better reductant compared to Al, since Gibbs’s free energy for the reaction with Mg and SiO2 is more negative compared to that of the reaction between Al and SiO2 (Ellingham, 1944). However, Al is lower in price compared to Mg. In addition, Al based oxides and composite materials have got huge interests in the metallurgical and commercial application, which attracted many researchers to study on the aluminothermic reduction of various metal oxides. More specifically, the aluminothermic reduction of silica (SiO2) has been used since the early 19th century, although those study mainly focused on the production of Al-based ferroalloys, composite materials of Al with Si, etc. (Alcock, 1961; Loehman et al., 1996; Saiz et al., 1999; Deqing and Ziyuan, 2001). The reduction was mainly done through the liquid-liquid reaction of Al and SiO2 at high-temperature furnace above melting temperature of SiO2 (Standage and Gani, 1967; Prabriputaloong and Piggott, 1973a; Prabriputaloong and Piggott, 1973b).
According to the Ellingham diagram, aluminum should be thermodynamically feasible to reduce silica to make elemental silicon at a temperature as low as 650°C, with free Gibbs energy of −180 kJ (Lynch, 2009). Thus, the reaction is thermodynamically spontaneous and highly exothermic. This value of Gibbs energy is considerably more negative compared to those in the Siemens process. Brondyke et al. first studied the effect of molten aluminum on silica refractories and formulated the chemical reaction between them as follows (Brondyke, 1953):
Very recently, researchers have been considering the aluminothermic reduction method to produce Si from SiO2, mainly for use in the field of energy storage devices, e.g., as anode materials in secondary ion batteries. As a source of silicon, commercial quartz powder (SiO2), waste glasses, and also rice husk have been reported (Radwan et al., 2005; Okutani, 2009; Lin et al., 2015; Zhou et al., 2016; Nuruddin et al., 2020). All of the reported works, so far, have focused on the powder metallurgical route to produce Si powder through this method. Apart from typical application in energy devices, the direct formation of Si film on the quartz (SiO2) substrates might contribute to the field of Si on insulators (SOI), Si/SiO2 superlattice, photonic crystals, etc. (Pavesi, 2003; Okamoto, 2012). Although magnesiothermic reduction of quartz or silica substrates has been reported to produce Si thin film (Wong et al., 2012; Ma et al., 2016; Tsuboi et al., 2017), works on the formation of Si thin film on quartz substrate through aluminothermic reduction of quartz have been lacking. For example, Prabriputaloong and Piggott et al. (Prabriputaloong and Piggott, 1973b) studied aluminothermic reduction of SiO2 plates, however thickness of Al layer on SiO2 was limited up to 100 nm. The obtained layer was studied using electron diffraction. Nguyen et al. also reported aluminothermic reduction of mesoporous silica films templated by cellulose nanocrystals, although the study focused on to improve the hardness of mesoporous silica, rather than to obtain pure Si-films (Nguyen et al., 2016). Nevertheless, detail elemental compositions of obtained layers, and reduction mechanism in terms of phase diagram were not properly understood yet. In this study, we have investigated the formation of Si thin films on quartz substrates based on aluminothermic reduction process. Here, deposited Al layer on the quartz-substrate converts the adjacent surface of the substrates to the elemental Si making Si/SiO2 structures. To understand the aluminothermic reduction mechanism in relation to the quality of the obtained Si, Al/SiO2 structure with various thickness of Al layer (different initial Al content) was used during the reduction process. In addition, the reduction temperature was varied to perform the reduction reaction at the solid-state or solid-Al liquid condition to understand the reduction mechanism and also to control and optimize the reduction products. Finally, the structural and optical properties were studied in relation to the reduction parameters.
Materials and methods
Al thin films were deposited on quartz (SiO2) substrates using RF magnetron sputtering in the Ar atmosphere at a pressure of 0.26 Pa. An Al-target with a purity of 99.999% was used as a source of Al during the sputtering. Sputtering was performed at room temperature (RT) with radio frequency (RF) power for the sputtering set at 50 W. To investigate the effect of starting Al-content on the formation of Si-films through reduction of the quartz substrates, Al-films with various thicknesses ranging from 1 to 4 µm were deposited on quartz substrates making several Al/SiO2 structures. The Al/SiO2 structures were then transferred to a thermal annealing system, where it was annealed at 650–700°C for 4-h in the vacuum with a pressure of 5.0 × 10⁻⁴ Pa. The high temperature annealing initiates the aluminothermic reduction process according to Eq. (1), where deposited Al layer plays the role of reductant and the surface of the quartz substrates reduced to become Si-film. The amount of the Al content in the thin films is assumed to be small enough to be consumed completely during the long reduction process and contribute to the formation of Si layer by liberating the O2 from the quartz surface. In addition, to study the effect of reduction temperature, we have used two different temperatures, namely 650 and 700 C during the annealing of the Al/SiO2 structures. The melting temperature of Al is ∼660°C (Tiryakioğlu, 2018). Thus, annealing of Al/quartz (SiO2) structure at 650°C allows the aluminothermic reduction of quartz substrates, i.e., the reaction between Al and SiO2 to occur at solid-state conditions. On the other hand, annealing of Al/SiO2 structure at 700°C allows the reduction reaction to occur at liquid-solid conditions, where liquid Al reacts with solid SiO2. Later, structural properties and elemental composition of the obtained Si-films on quartz substrates were characterized by scanning electron microscopy (SEM) and energy-dispersive X-ray spectroscopy (EDS), attached to the SEM system. EDS was performed at the acceleration voltage of 15 kV, which roughly corresponds to the depth of few hundred nm below the surface of the films. Crystal properties of the Si films were studied using X-ray diffraction (XRD) technique. XRD was taken at θ-2θ mode in the range of 10°–90° (SmartLab, Rigaku) using Cu-Kα (α = 1.541,837 Å) radiation operated at 40 kV and 30 mA. Optical properties were investigated using Raman spectroscopy. An Nd: YAG laser line with a wavelength of 532 nm and having a focus size of several μm was used for the Raman measurement. All the characterizations of obtained Si-films were performed at RT. A schematic diagram of the aluminothermic reduction process, along with cross sectional view of a sample before and after reduction (i.e., annealing) has been shown in Figure 1.
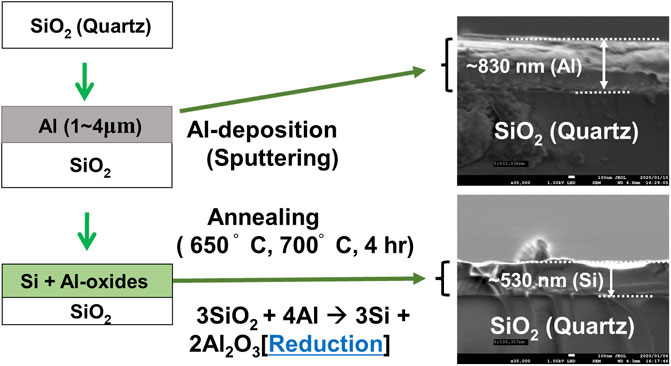
FIGURE 1. A schematic diagram of the aluminothermic reduction process. The left panel shows the reduction process. Right SEM images show cross-sectional viewes of a representative sample with an 830 nm-thick Al layer deposited with the sputtering technique. The top SEM image shows Al/SiO2 structure before annealing. The bottom SEM image shows the same sample after annealing at 700°C for 4 h. As the film was heated to 700°C, the Al diffused into the SiO2 substrates following the aluminothermic reduction reaction (Eq. 1) and make the Si layer after liberating O2. After reduction, a 530 nm thick Si layer appears to be formed which might be mixed with some oxides of Al. The detailed reduction mechanism has been discussed in the main text.
Results and discussion
Structural and crystal properties
To confirm the formation of the Si layer through direct aluminothermic reduction of quartz substrates, we have performed the XRD on annealed Al/quartz structure. To compare the aluminothermic reduction at solid-state and at solid-Al liquid conditions, we have performed the annealing (i.e., performing aluminothermic reduction) of the Al/quartz structure at high temperatures of 650°C and 700°C. Shown in Figure 2 is the XRD pattern of the Si-layer, obtained through aluminothermic reduction of the Al/quartz structure, where the thickness of the sputtered Al film in the structure is set at 4 µm. The XRD pattern of a crystalline Si has also been plotted in the same figure as a reference (ICDD standard: 00-027-1402). As seen from the figure, the positions of the dominant peaks in the annealed samples are in agreement with the peaks from the reference crystalline Si. It confirms that the surface of the quartz substrates turns to become a Si layer through aluminothermic reduction of the quartz (i.e., SiO2) after annealing at high temperatures. At the reflection angle, 2θ ∼ 22° a broad peak which corresponds to the amorphous SiO2, presumably comes from the quartz substrates, has been observed in all the samples. Peaks around 2θ = 28.53°, 47.5°, and 56.1° correspond to (111), (220), and 311) crystal planes of diamond structured Si, respectively. Furthermore, some additional peaks were seen in the XRD pattern of the obtained silicon layers. Particularly reflection peaks at 2θ ∼ 37.7° and 46° can be attributed to the Al2.67O4 phases (γ-alumina) (Zhou and Snyder, 1990), and a peak at 2θ ∼ 38.36° can be attributed to the elemental Al, and plausibly originating from unreacted Al during the reduction process (Popović et al., 1992).
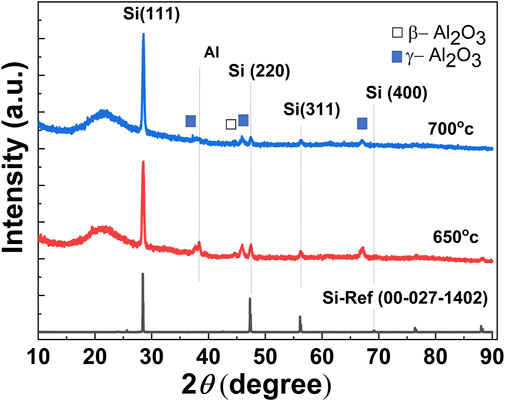
FIGURE 2. XRD patterns taken at the θ-2θ mode of the Si-layers obtained through aluminothermic reduction of quartz (SiO2) substrates at two different annealing (reaction) temperatures (650°C and 700°C).
As seen from the figure, the intensity of Si (111) peaks increases when the annealing temperature was increased from 650°C to 700°C. Also, at higher annealing temperatures, there is a significant reduction of the unreacted Al peak (2θ ∼ 38.36°) and γ-alumina (2θ ∼ 37.7° and 46°). At first, the formation of the Si layer at an annealing temperature of 650°C suggests that aluminothermic reduction occurs at solid-state conditions before the melting temperature of the Al around 660°C. As we will discuss in the next section, the atomic percent (at%) of elemental Si increased with an increase in the reaction temperature, while at the same time at% of Al and O reduced. Thus, a higher annealing temperature seems to be favorable for the completion of the reaction through the aluminothermic reduction to transform the SiO2 into elemental Si. Thus, more Al is consumed at higher temperatures to produce Si with a higher yield.
Later, we have considered the XRD pattern of several Si layers obtained at the reduction temperature of 700°C for 4 h, where thickness of the deposited Al layers on quartz substrates was varied from 1 to 4 µm. XRD pattern of a Si sample, reduced with a very thin Al layer of 90-nm thickness was also plotted in the same figure for comparison (Figure 3) As shown in the figure, the sample deposited with 90-nm thick Al film does not show any XRD peaks related to the Si-phase, plausibly due to the formation of a very thin layer of Si, while XRD peaks of all the other samples show dominant peaks correspond to the various reflection planes of Si-phase. As seen from the figure, in general, the intensity of the Si (111) peak increases with the increase of the Al film thickness. It suggests that the amount of obtained Si, i.e., the thickness of the obtained Si layer might depend on the initial thickness (i.e., initial content) of the sputtered Al films on the quartz substrates, and the thickness of the obtained Si layers get increased with an increase of the thickness of Al films. In addition to the Si-related peaks, the intensity of peaks related to the oxides of Al was also found to be increased with an increase in the Al-film thickness.
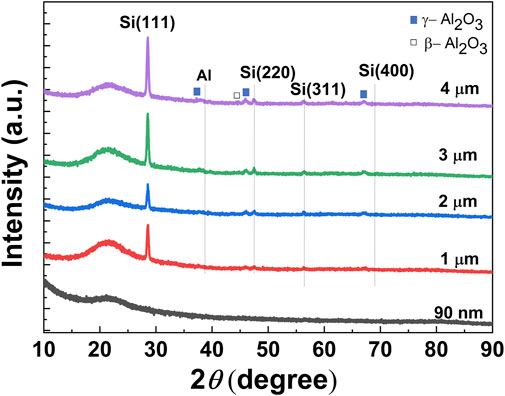
FIGURE 3. XRD patterns taken at the θ-2θ mode of the Si-layers obtained through aluminothermic reduction of quartz substrates at the annealing temperature of 700°, and with various thicknesses of the Al-film at Al/quartz structure (thicness of Al films from 90 nm to 4 μm).
It is to be mentioned that the dominant (111) peaks in XRD of obtained Si layer shows slight right shift comparing to the reference Si peak at 2θ = 28.43°. For example, Gaussian fitting of the (111) peak of the sample with 1 µm Al layer shows peak position at 2θ = 28.54°, while peak shift reduced to 2θ = 28.53° when thickness of Al layer was increased to 4 µm. To investigate the peak shift, we have calculated lattice parameter of each sample from (111) peak position. The lattice parameter for the samples was estimated around 0.541 nm, which is slightly smaller than that of reference Si (0.543 nm). Thus, peak shift to the higher angle can primarily be attributed to the lattice contraction in obtained Si layers comparing to the bulk Si. In addition, to investigate the effect of any inhomogeneous lattice strain in Si layers on the peak shift, we have calculated the macrostrain (ε) of the films from the broadening of (111) diffraction peak following the equation (Kumar and Rao, 2013),
Here, β is the broadening or full width at half the maximum (radians) of the X-ray diffraction peak obtained from Gaussian fitting of the (111) peak, and θ is the Bragg diffraction angle (in degree). The value of Microstarin was found as ε = 6.9 × 10⁻³ radian for the Si layer obtained with 1 µm thick Al layer, while strain slightly reduced to ε = 6.2 × 10⁻³ radian when thickness of Al layer increased to 4 µm. Thus, both the lattice contraction and microstrain in the obtained Si films are responsible for XRD peak shift to higher angle observed in this study. Later, we considered the (111) peak to evaluate the grain size and crystallinity of the obtained Si layer. The crystallite sizes of the obtained Si were calculated from the broadening (FWHM) of the (111) peak using Scherrer’s equation (Patterson, 1939),
Here, D represents the average size of the crystallites or coherently ordered crystalline domain (nm) in the Si-films, λ is the wavelength of the CuKα1 radiation with the value of 1.54056 Å, which has been used for the XRD measurement. K is considered a constant, which is related to crystallite shape, usually taken as 0.94 for the cubic structure. The calculated results of the crystalline size using the fitting parameters were found in the range of 21–24 nm. It is worth mentioning that Scherrer’s formula roughly estimates the average of the lower limit of the crystallite size, which may be smaller or equal to the grain size or particle size, thus may not directly correspond to the grain size measured by different methods. In addition, Gaussian fitting of the (111) peaks shows that in general, FWHM decreases with an increase of the Al thickness (not shown). Thus, higher intensity and lower FWHM of (111) peak, along with slightly reduced lattice contraction and smaller value of microstrain in the Si-films obtained with increased Al thickness suggests that crystallinity of the obtained Si-films increases with an increase of the initial Al contents available for the reduction.
Elemental composition
Later, to study the elemental composition of the Si-layers obtained through aluminothermic reduction of quartz, and also to understand the reduction mechanism, we performed EDS measurements of the two samples with the thickness of deposited Al-films 1 and 4 μm, respectively. In addition, to understand the effect of reaction temperature, we have investigated EDS mapping of the samples through aluminothermic reduction done at 650°C and 700°C. Shown in Figure 4 is the EDS mapping of the normalized elemental composition of the two samples, obtained through aluminothermic reduction at a temperature of 650°C for 4 h. Top Figures 4A–D and bottom panel Figures 4E–H show the elemental composition of the Si-layers, obtained with the thickness of Al film 1 and 4 μm, respectively. As is consistent with the XRD pattern, the observation of the elemental Si (Figures 4D–H) at a temperature of 650°C suggests that the reduction of quartz (SiO2) through Al starts at solid-state conditions, before the melting temperature of Al. Shown in Figure 5 is the EDS mapping of the normalized elemental composition of a similar set of samples, obtained through aluminothermic reduction at a high temperature of 700 °C for 4 h, i.e., reaction at solid quartz-liquid Al condition. The top and bottom panel of Figure 5 show the elemental composition of the Si-layers obtained with Al-films having thicknesses of 1 and 4 μm, respectively. As shown in SEM images and EDS mapping of both figures (Figure 4 and Figure 5), the brighter region of the SEM images is corresponding to the formation of elemental Si in the obtained layer. Thus, it is apparent from figures that the distribution of the Si as well as morphology of the obtained films may not be homogeneous on the surface of the films. Si appears to have consisted of droplets or cluster of Si crystals; and these Si-droplets or Si-clusters become larger and more homogeneous with an increase in the thickness of the initial Al layer. In addition, the brighter region in SEM images, i.e., the quantity of the obtained elemental Si seems to be higher for the films annealed at a higher temperature of 700°C, when the reaction starts at the solid-liquid Al interface. Thus, both initial Al-content and reaction-temperature play roles in the final yield of the Si, obtained through the aluminothermic reduction process.
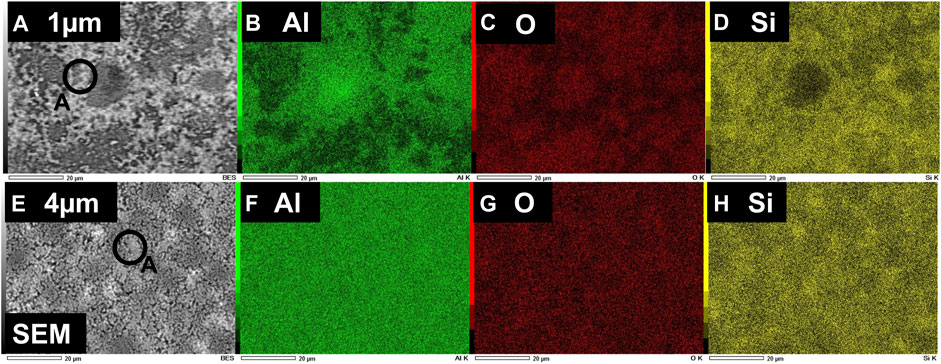
FIGURE 4. EDS mapping of the normalized composition of elemental Si, O, and Al in the Si-layers obtained through aluminothermic reduction of quartz substrates at the annealing temperature of 650°C. Top (A–D) and bottom panel (E–H) show the mapping of elemental composition for Si-layers, obtained with the thickness of Al-films 1 and 4 μm, respectively.
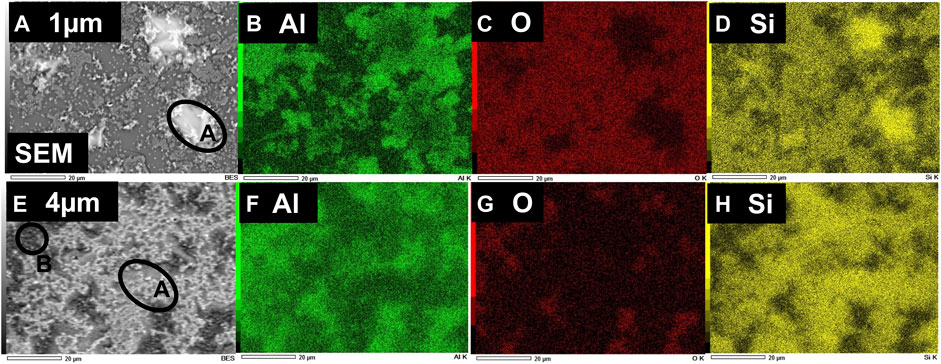
FIGURE 5. EDS mapping of the normalized composition of elemental Si, O, and Al in the Si-layers obtained through aluminothermic reduction of quartz substrates at the annealing temperature of 700°C. Top (A–D) and bottom panel (E–H) show the mapping of elemental composition for Si-layers, obtained with the thickness of Al-films 1 and 4 μm, respectively.
To get a quantitative idea about the elemental composition, we have plotted in Figure 6 the compositional data obtained from the brighter region (e.g., circled area, A in all SEM images of Figure 4 and Figure 5) of the samples, where the at % of Si has been found as maximum. As shown in the figure, with an increase of the Al layer thickness from 1 to 4 μm, the elemental composition of Si increases from 59.6 at. % to 72.5 at. % in case of annealing at 700°c. It should be mentioned that since annealed samples were not treated with acid or alkali to remove any unreacted Al or oxide phases, which might form after high-temperature annealing, both samples contain elemental Al and O to a certain level, as is consistent with the observation from XRD patterns in Figures 2, 3. Thus, Al content was found as 10 at% and 14.9 at % for the samples with initial Al-layer thickness of 1 and 4 μm, respectively. On the other hand, elemental O content was found as 30.4 at % and 12.5 at % for the samples with Al layer thickness set as 1 and 4 μm, respectively. It should be noted that Si is very reactive to ambient O2, which may oxidize the obtained Si layer and contribute to the total content of O at% obtained from EDS.
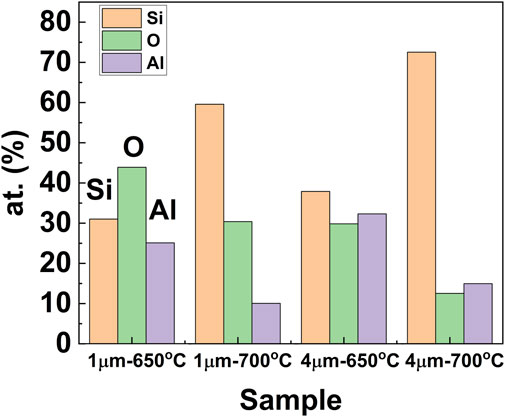
FIGURE 6. Compositional data (in wt%) of elemental Si, Al, and O in the Si-layers obtained from the brighter region (e.g., circled area, A in all SEM images of Figure 4 and Figure 5).
In addition, reduction temperature (i.e., annealing temperature) seems to play a vital role during the reduction process of SiO2 in transforming SiO2 to Si. As can be seen from the figure, with an increase in the reaction temperature from 650°C to 700°C, there is a significant improvement in the yield of the elemental Si in both samples. When the reduction condition was changed from all-solid-state (650°C) to solid-liquid state (700°C), the amount of Si increased from 31 at% to 59.6 at % for the film with an initial Al layer of 1 µm-thickness, while Si-content increased from 37.9 to 72.5 at % for the sample with an initial Al layer thickness of 4 µm. The increment of the Si amount at increased temperature is consistent with our XRD data where the intensity of the Si peaks was found to increase at the increased annealing temperature. In fact, it has been reported that aluminothermic reduction of quartz glass and aluminum powder at a temperature of 1260°C yielded 91%, while reduction for the same time but at an increased temperature of 1300°C yielded practically close to 100% of silicon (Lavrov et al., 2015; Shevko et al., 2018). Yoshikawa et al. studied the aluminothermic reduction kinetics of soda-lime glass beads using aluminum scrap (Yoshikawa et al., 2006). It has been reported in their studies that the reaction rate at 700°C is proportional to the square root of the reaction time, and the reaction rate increases when the reaction temperature increases (Yoshikawa et al., 2006). Thus, the conversion efficiency of Si from SiO2 is increased at the higher temperature of 700°C as can be seen from quantitative EDS data. It roughly suggests that reaction temperature should be optimized to improve the amount of the obtained Si in the films, and a higher reaction temperature even above 700°C may be useful to improve the crystallinity of the obtained Si-film.
Later, to discuss the inhomogeneity in EDS mapping, we have analyzed the elemental composition of various spots of the sample with starting Al-layer thickness of 4 µm and annealed at 700°C. Shown in Figure 7 is the elemental composition of the spot-A (bright-region), and spot- B (gray-region), of the similar sample shown in Figure 5E. It has been apparent from the figure that a brighter spot with higher Si contents (72.5 at %) (spot-A) is surrounded by a gray region (spot-B) with a relatively lower amount of Si (30.7 at %) and a higher amount of Al (34.2 at %) and O (34.9 at %). The eutectic reaction of Al and Si occurs at 12.6 wt% Si at a temperature of 577 ± 1°C with a maximum solubility of Si as 1.65 wt% (Murray and McAlister, 1984). However, XRD in Figures 2, 3 do not show any distinct peaks related to Al-Si except a plausible peak at 2θ ∼ 38.36° from Al0.988Si0.012 phase at an overlapping location of elemental Al (Senoo et al., 1976; Popović et al., 1992). Moreover, peaks from elemental Si are dominant in both XRD patterns. It roughly suggests that the composition of the gray spots mainly originated from oxides of Al. It has been discussed in the literature that reaction between Al and SiO2 at higher temperature is thermodynamically favorable for the formation of Si along with Al2O3 as final products, although mullite (3Al2O3. 2SiO2) or any other aluminosilicate may form in the intermediate stage of reaction before transforming to Al2O3 (Deqing and Ziyuan, 2001). Bachrach and Bauer et al. investigated the reaction between thin layers of aluminum and silicon dioxide (Bachrach and Bauer, 1979). Their results suggested that an intermediate oxidation state of aluminum was formed initially, followed by the formation of Al2O3 along with the formation of elemental Si. In addition, Dequing et al. (Deqing and Ziyuan, 2001) studied the aluminothermic reduction of SiO2 from a mixture of Al and SiO2 powder, while Nguyen et al. (Nguyen et al., 2016) investigated the aluminothermic reduction of photonic chiral nematic mesoporous silica through high-temperature annealing of Al-foil pieces wrapped around SiO2 slabs in a tube furnace. In both studies, the authors confirmed that the reduction mechanism of SiO2 occurs only at the contact area of Al and SiO2, and SiO2 was transferred to Si or Al2O3/Si composites. Saiz et al. explained that the formation of Si through the reduction of SiO2 by Al at high temperatures is primarily initiated through reactive penetration of Al to the SiO2 matrix starting at the interface of Al/SiO2 (Saiz et al., 1999). Thus, due to the larger affinity of Al towards oxygen compared to Si, the layer of SiO2 in touch with Al reacts with diffused Al to make a thin layer of Al2O3. Depending on the reaction temperature, the formation of Al2O3 might be associated with an intermediate stage of mullite formation. Thus, after the formation of Al2O3 with the O2 from the SiO2 matrix, liberated Si is transferred (diffused) into the Al-melt and upon solidification, precipitates as eutectic or primary crystals on the surface. Thus, although reduction occurs in solid-state at a temperature of 650°C making a thin layer of Al2O3, at the increased temperature of 700°C, both the penetration rate as well as the diffusion (assumably grain boundary diffusion) capability of the subsequent Al through the formed Al2O3 layer to the SiO2 matrix is increased. In addition, the lower thickness of Al (low content) limited the diffusion distance of Al and limit the reaction, while the increased thickness of the Al layer promotes rapid heating and increased reaction rate along with a higher probability of Al diffusion into the SiO2 matrix, thereby increasing the yield of obtained Si (Feng, 1994). Thus, in our study, as the sputtered Al layer has been in contact with the SiO2 substrates, the reduction reaction has been assumed to be uniform over the entire contact area at Al/SiO2 interface. Nevertheless, EDS mapping suggests that the content of the Si is not uniform in the obtained Si-layer. It has been reported that formed Al2O3 in the SiO2/Al2O3/Al structure is porous in nature (Roberts and Dobson, 1981), especially η or γ- Al2O3 are associated with a tetragonally deformed spinel lattice (Sun et al., 2006). Thus, Al diffusion (Al ion migration) routes through open structured Al2O3 to the SiO2 matrix in various spots of the sample might decide the homogeneities of the final elemental Si-yield at the surface of a similar sample.
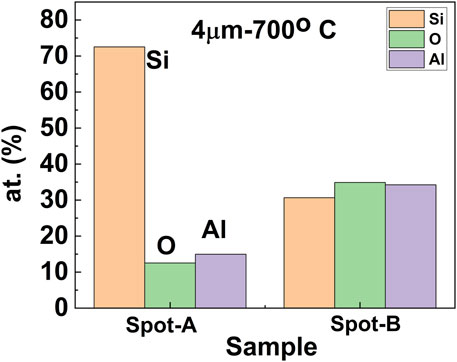
FIGURE 7. Compositional data (in wt%) of elemental Si, Al, and O of the two different locations: spot-A (bright-region) and spot-B (gray-region) of the Si-layer [circled area, A and B, respectively in Figure 5E obtained at annealing temperature of 700 °C with initial Al-layer thickness of 4 µm.
Finally, to understand more about the reduction mechanism of SiO2 to Si through aluminothermic reduction, we have plotted a ternary phase diagram of the composition data (spot-A, brighter-region) of two samples obtained from EDS as shown in Figure 8. The top pair of symbols correspond to the composition of films obtained at 650°C reduction temperature, while the bottom pair, closer to the Si-corner at the triangle, corresponds to the temperature of 700°C. As the XRD pattern of obtained samples (Figures 2, 3) is associated with strong peaks from Si-phase, we focused on the phase equilibrium in the Si-corner of the triangle. As we have already discussed, the amount of Si increased with an increase in the thickness of Al film (from 1 to 4 µm) and also with an increase in the reduction temperature (from 650 °C to 700°C), as we can see from the figure. In general, all the compositions are enclosed in the section of Al2O3-3Al2O3.2SiO2-Si-Al. The quasi-binary tie line Al2O3-SiO2 section contains ternary compound mullite (3Al2O3.2SiO2). However, no strong peaks related to mullite have been observed in XRD for any samples in Figures 2, 3. We consider that for the sample with 1-µm thick Al-film, composition at 650°C and 700°C lies mainly on the line of Al2O3 and Si. Thus, reduction products can be considered to be consisted of the elemental Si, oxides of Al, and a trace amount of unreacted Al. With an increase in temperature, composition moves closer to the Si-corner of the triangle. On the other hand, for the sample with 4-µm thick Al film, reduction products lie mainly on the line of Al2O2 and elemental Si, while composition moves to Si-corner (i.e., the yield of Si increased) with the increase of reduction temperature from 650°C to 700°C. Thus, the possible reduction reaction of the samples can be explained using the following equations as follows (Alcock, 1961; Prabriputaloong and Piggott, 1973b):
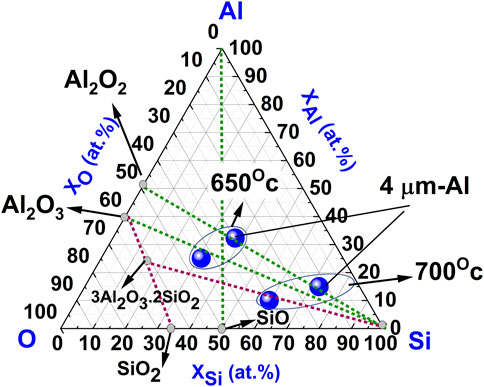
FIGURE 8. Ternary phase diagram of the composition data (spot-A, brighter-region) of two samples obtained from EDS in Figure 6. Encircled two points at the top and bottom suggest composition of Si films obtained at annealing temperature of 650°C and 700°C, respectively. Two points at right sides correspond to Si films obtained with 4- µm thick Al layer (indicated in the figure). While rest two points at left sides correspond to Si films obtained with 1- µm thick Al layer.
Reaction (4) and (5) are energetically favorable as Gibb’s free energy is negative and should occur at increased temperature and relatively at low pressure used in this study. In the case of the sample with 1-µm thick Al film, reduction mechanism mainly follows reaction path (4) in the above equation, while excess Al in the sample with 4-µm thick Al film induces additional reaction with liberated O2 following (Eqs. 5, 6) making oxides of Al. The formation mechanism of Al-based suboxides as well as oxides other than Al2O3 is not well understood yet, particularly at low temperatures around 700°C. However, pressure during reaction might play an important role. In the work of K. Prabriputaloong et al., they reported the formation of gaseous Al2O during the aluminothermic reduction of SiO2 at a high vacuum at the temperature of 700–800°C (Prabriputaloong and Piggott, 1973b). S. Yamaguchi et al. (Yamaguchi, 1974), explained that due to the reason Al contains three valance electrons, i.e., 3s23p1 (Grube et al., 1949) it will be possible to form three types of oxides with Al and O, namely Al2O3, AlO, and Al2O. In fact, Yamaguchi et al. (Yamaguchi, 1974) reported the formation of Al2O and AlO by oxidizing Al foil just at 300°C. Thus, AlO and sub-oxides of Al are possible to form at the boundary between Al and γ-Al2O3 in the phase diagram of the Al-O section (Yamaguchi, 1974). Consequently, a solid solution of these oxides is possible to form in obtained films in this study. However, XRD data in Figures 2, 3 shows the existence of mainly Al2O3 in all samples, presumably due to the large coverage of sample spots (including bight and gray spots in all samples) during the XRD measurement. Nevertheless, considering the above discussion, it can be generalized in a simple way that the reduction products are consisted of mainly elemental Si and stable Al2O3 phases and may be mixed with a trace amount of Al in all the samples in this study. It should be noted that elemental composition, obtained through EDS measurement in this section, corresponds to the depth of the Si-layers in the subsurface region, which is roughly a few hundred nm below the surface region. Thus, the surface region and immediate subsurface region are expected to contain more Si in the obtained films. In addition, strong Si peaks in XRD of all the samples obtained both at 650°C and 700°C suggest that obtained Si is mainly crystalline in nature, while oxides of Al might be mixed of amorphous and some crystalline phases due to moderate reaction temperature, and/or less in quantity.
Raman spectroscopy
To study the optical properties of the obtained Si-films, we have performed µ-Raman spectroscopy of the Si-films obtained with deposited Al layers of various thicknesses as shown in Figure 9. Raman spectrum of single crystalline silicon (c-Si) wafer was also shown in the same figure as a reference. All the Raman intensity data were plotted after converting it to log scale. c-Si shows a sharp and symmetric peak around 521 cm−1 (Parker et al., 1967), which is associated with the Raman scattering by the Si optical phonon mode. The peak position of all the samples with Al layer thickness from 1 to 4 µm are in good agreement with the position of the Raman active mode of the c-Si, suggesting Raman scattering by the Si optical phonon mode in all samples. All the spectra were fitted with Gaussian distribution to extract information (not shown, except peak position) about the integrated intensity, peak position, and peak broadening (FWHM). In general, with an increase in the thickness of the Al layer (i.e., increased content of Al), the intensity of the phonon band becomes stronger, and the broadening of the peaks becomes narrower. It also suggests that the crystalline quality of the Si layers becomes better when aluminothermic reduction is performed with an increased amount of Al. This observation is also consistent with the XRD and EDS results as discussed before. From the inset of the figure, it can be seen that the Raman peak of the Si-layers obtained with relatively thinner Al layers slightly shifted to lower wavenumber (i.e., downshift) compared to the c-Si reference peak. With an increase in the thickness of the Al layer from 1 to 3 μm, Raman peaks of the obtained Si-layer move closer to the c-Si (right shift). On the other hand, for the sample with a 4 µm thick Al layer, the Raman peak shows a right shift compared to the c-Si sample, presumably due to increased compressive strain in the sample. It is to be noted that the position of the Raman peaks in Si materials can be affected by the laser heating during measurement (Islam et al., 2018; Islam et al., 2022), or local stress. Nevertheless, shifting of the optical phonon-band to a lower wavenumber in samples obtained with thinner Al-layers compared to that of single-crystal Si (bulk) roughly suggests the size-related quantum confinement effect due to the formation of microcrystalline or nanocrystalline phases (Fukata et al., 2005; Ristić et al., 2009). The larger downshift of the Raman peak is associated with a smaller crystallite size. Thus, a systematic shift of the Raman peak with the thickness of the Al layer suggests that the crystalline nature (nanocrystal to microcrystal to polycrystal) and also the quality of the crystallinity including the crystallite size of the obtained Si can be tuned or controlled by the initial Al content (i.e., the thickness of the Al layer) during the aluminothermic reduction process.
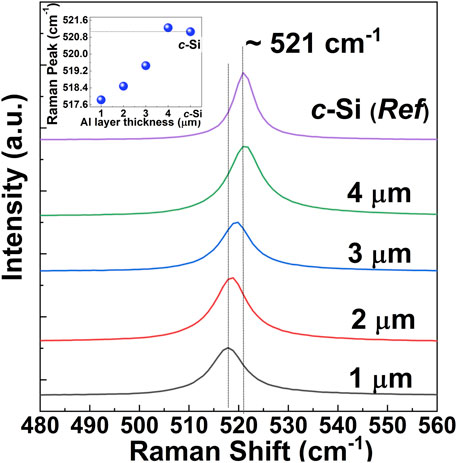
FIGURE 9. Raman spectra of Si-layers obtained through aluminothermic reduction of quartz substrates at the annealing temperature of 700°C, and with various thicknesses of the Al-film at Al/quartz structure. The inset of the figure shows the peak shift of the Raman active mode in Si layers as a function of the Al layer thickness.
Conclusion
We have studied the formation of Si thin films on quartz substrates through aluminothermic reduction, where the surface of the quartz substrate in contact with the Al layer has been converted to films Si during high-temperature annealing at vacuum conditions. The elemental composition obtained by EDS as well as XRD of the obtained Si-layer suggests that reduction products consist of mainly elemental Si and mixed phases of Al. Both the initial Al-content (thickness of Al layer on quartz substrates) and reduction temperature (annealing temperature) were found to play crucial roles in the final yield of Si in films, obtained through the aluminothermic reduction process. In comparison to perform the reduction reaction at solid-state condition (at 650°C), the amount of obtained Si becomes higher when aluminothermic reduction is performed at solid-liquid Al condition (at 700°C). Thus, a higher reduction temperature seems to be favorable for the completion of the reduction reaction at the solid SiO2/liquid Al interface, where diffusion of molten Al to the SiO2 matrix liberates Si making Al2O3. In addition, higher Al content (increased thickness of the Al layer) promotes rapid heating and increased reaction rate along with a higher probability of Al diffusion into the SiO2 matrix, thereby increasing the yield of obtained Si, while the lower thickness of Al is associated with limited diffusion distance of Al and limit the reaction, resulting in a lower yield of Si. Thus, both XRD and Raman spectra of the obtained Si-layer suggest that crystallinity and quality of the obtained Si-layer improve with the increase of both reduction temperature and thickness of the Al layer deposited on quartz substrates.
Data availability statement
The raw data supporting the conclusions of this article will be made available by the authors, without undue reservation.
Author contributions
MI conceived the concept of the research and designed the experiments. MI wrote the manuscript. JS carried out material synthesis. JS and MI performed material characterization. KA and TS provided project motivation, guidance and corrected the manuscript. All authors contributed to the article and approved the submitted version.
Conflict of interest
The authors declare that the research was conducted in the absence of any commercial or financial relationships that could be construed as a potential conflict of interest.
Publisher’s note
All claims expressed in this article are solely those of the authors and do not necessarily represent those of their affiliated organizations, or those of the publisher, the editors and the reviewers. Any product that may be evaluated in this article, or claim that may be made by its manufacturer, is not guaranteed or endorsed by the publisher.
References
Alcock, C. (1961). the formation of volatile oxides by furnace construction materials. Trans. Br. Ceram. Soc. 60, 147.
Bachrach, R., and Bauer, R. (1979). Surface reactions and interdiffusion. J. Vac. Sci. Technol. 16, 1149–1153. doi:10.1116/1.570179
Birner, A., Wehrspohn, R. B., Gösele, U. M., and Busch, K. (2001). Silicon‐based photonic crystals. Adv. Mat. 13, 377–388. doi:10.1002/1521-4095(200103)13:6<377::aid-adma377>3.0.co;2-x
Brondyke, K. (1953). Effect of molten aluminum on alumina‐silica refractories. J. Am. Ceram. Soc. 36, 171–174. doi:10.1111/j.1151-2916.1953.tb12860.x
De La Torre, J., Souifi, A., Poncet, A., Busseret, C., Lemiti, M., Bremond, G., et al. (2003). Optical properties of silicon nanocrystal leds. Phys. E Low-Dimensional Syst. Nanostructures 16, 326–330. doi:10.1016/s1386-9477(02)00612-4
Deqing, W., and Ziyuan, S. (2001). Aluminothermic reduction of silica for the synthesis of alumina-aluminum-silicon composite. J. Mater. Synthesis Process. 9, 241–246. doi:10.1023/a:1015295200586
Ellingham, H. J. (1944). Reducibility of oxides and sulphides in metallurgical processes. J. Soc. Chem. Ind. 63, 125
Entwistle, J., Rennie, A., and Patwardhan, S. (2018). A review of magnesiothermic reduction of silica to porous silicon for lithium-ion battery applications and beyond. J. Mat. Chem. A Mat. 6, 18344–18356. doi:10.1039/c8ta06370b
Fukata, N., Oshima, T., Murakami, K., Kizuka, T., Tsurui, T., and Ito, S. (2005). Phonon confinement effect of silicon nanowires synthesized by laser ablation. Appl. Phys. Lett. 86, 213112. doi:10.1063/1.1931055
Funde, A., Bakr, N. A., Kamble, D., Hawaldar, R., Amalnerkar, D., and Jadkar, S. (2008). Influence of hydrogen dilution on structural, electrical and optical properties of hydrogenated nanocrystalline silicon (nc-Si: H) thin films prepared by plasma enhanced chemical vapour deposition (Pe-Cvd). Sol. Energy Mater. And Sol. Cells 92, 1217–1223. doi:10.1016/j.solmat.2008.04.012
Gall, S., Muske, M., Sieber, I., Nast, O., and Fuhs, W. (2002). Aluminum-induced crystallization of amorphous silicon. J. Non-Crystalline Solids 299, 741–745. doi:10.1016/s0022-3093(01)01108-5
Goncalves, C., Charvet, S., Zeinert, A., Clin, M., and Zellama, K. (2002). Nanocrystalline silicon thin films prepared by radiofrequency magnetron sputtering. Thin Solid Films 403, 91–96. doi:10.1016/s0040-6090(01)01553-x
Gonzalez, C. M., and Veinot, J. G. (2016). Silicon nanocrystals for the development of sensing platforms. J. Mat. Chem. C Mat. 4, 4836–4846. doi:10.1039/c6tc01159d
Green, M., Fielder, E., Scrosati, B., Wachtler, M., and Moreno, J. S. (2003). Structured silicon anodes for lithium battery applications. Electrochem. Solid-State Lett. 6, A75. doi:10.1149/1.1563094
Gribov, B., Zinov’ev, K., Kalashnik, O., Gerasimenko, N., Smirnov, D., Sukhanov, V., et al. (2017). Production of silicon nanoparticles for use in solar cells. Semiconductors 51, 1675–1680. doi:10.1134/s1063782617130085
Grube, G., Schneider, A., Esch, U., and Flad, M. (1949). Zur kenntnis des aluminiumsuboxyds. Z. Anorg. Chem. 260, 120–126. doi:10.1002/zaac.19492600110
Han, G., Guo, P., Yang, Y., Zhan, C., Zhou, Q., and Yeo, Y.-C. (2011). Silicon-based tunneling field-effect transistor with elevated germanium source formed on (110) silicon substrate. Appl. Phys. Lett. 98, 153502. doi:10.1063/1.3579242
Huang, L., Jin, J., Shi, W., Yuan, Z., Yang, W., Cao, Z., et al. (2013). Characterization and simulation analysis of laser-induced crystallization of amorphous silicon thin films. Mater. Sci. Semicond. Process. 16, 1982–1987. doi:10.1016/j.mssp.2013.07.005
Islam, M. M., Abdellaoui, I., Moslah, C., Sakurai, T., Ksibi, M., Hamzaoui, S., et al. (2018). Electrodeposition and characterization of silicon films obtained through electrochemical reduction of SiO2 nanoparticles. Thin Solid Films 654, 1–10. doi:10.1016/j.tsf.2018.03.072
Islam, M. M., Said, H., Hamzaoui, A. H., Mnif, A., Sakurai, T., Fukata, N., et al. (2022). Study of structural and optical properties of electrodeposited silicon films on graphite substrates. Nanomaterials 12, 363. doi:10.3390/nano12030363
Kumar, V. S. S., and Rao, K. V. (2013). X-ray peak broadening analysis and optical studies of Zno nanoparticles derived by surfactant assisted combustion synthesis. J. Nano-and Electron. Phys. 5, 02026-1–02026-6.
Lavrov, N. N., Lavrov, B. A., and Serzhanov, G. M. (2015). Production of polycrystalline silicon by an aluminothermic method. Bull. St. Petersb. State Instit. Technol. 31 (57), 30.
Lin, N., Han, Y., Zhou, J., Zhang, K., Xu, T., Zhu, Y., et al. (2015). A low temperature molten salt process for aluminothermic reduction of silicon oxides to crystalline Si for Li-ion batteries. Energy Environ. Sci. 8, 3187–3191. doi:10.1039/c5ee02487k
Loehman, R. E., Ewsuk, K., and Tomsia, A. P. (1996). Synthesis of Ai2O3‐Ai composites by reactive metal penetration. J. Am. Ceram. Soc. 79, 27–32. doi:10.1111/j.1151-2916.1996.tb07876.x
Lynch, D. (2009). Winning the global race for solar silicon. Jom 61, 41–48. doi:10.1007/s11837-009-0166-8
Ma, B., Huang, Z., Mei, L., Fang, M., Liu, Y., and Wu, X. (2016). Investigation on a magnesiothermic reduction process for preparation of nanocrystalline silicon thin film. Surf. Eng. 32, 761–765. doi:10.1080/02670844.2016.1146443
Matsuyama, T., Terada, N., Baba, T., Sawada, T., Tsuge, S., Wakisaka, K., et al. (1996). High-quality polycrystalline silicon thin film prepared by a solid phase crystallization method. J. Non-Crystalline Solids 198, 940–944. doi:10.1016/0022-3093(96)00091-9
Murray, J. L., and McAlister, A. J. (1984). The Al-Si (Aluminum-Silicon) system. Bull. Alloy Phase Diag. 5, 74–84. doi:10.1007/BF02868729
Nguyen, T.-D., Hamad, W. Y., and Maclachlan, M. J. (2016). Hard photonic glasses and corundum nanostructured films from aluminothermic reduction of helicoidal mesoporous silicas. Chem. Mat. 28, 2581–2588. doi:10.1021/acs.chemmater.5b04700
Nuruddin, A., Yuliarto, B., Saputro, A. G., Badruzaman, B., and Ramelan, A. (2020). Preparation of polycrystalline silicon from rice husk by thermal decomposition and aluminothermic reduction. Molekul 15, 26–33. doi:10.20884/1.jm.2020.15.1.568
Okamoto, K. (2012). Progress and technical challenge for planar waveguide devices: Silica and silicon waveguides. Laser Phot. Rev. 6, 14–23. doi:10.1002/lpor.201100003
Okutani, T. (2009). Utilization of silica in rice hulls as raw materials for silicon semiconductors. J. Metals, Mater. Minerals 19, 51–59.
Parker, J., Feldman, D., and Ashkin, M. (1967). Raman scattering by silicon and germanium. Phys. Rev. 155, 712–714. doi:10.1103/physrev.155.712
Patterson, A. (1939). The scherrer formula for X-ray particle size determination. Phys. Rev. 56, 978–982. doi:10.1103/physrev.56.978
Pavesi, L. (2003). Will silicon Be the photonic material of the third millenium? J. Phys. Condens. Matter 15, R1169–R1196. doi:10.1088/0953-8984/15/26/201
Popović, S., Gržeta, B., Ilakovac, V., Kroggel, R., Wendrock, G., and Löffler, H. (1992). Lattice constant of the fcc Al‐rich Α‐phase of Al‐Zn alloys in equilibrium with gp zones and the Β (Zn)‐Phase. Phys. Stat. Sol. 130, 273–292. doi:10.1002/pssa.2211300203
Potemkin, D. I., Maslov, D. K., Loponov, K., Snytnikov, P. V., Shubin, Y. V., Plyusnin, P. E., et al. (2018). Porous nanocrystalline silicon supported bimetallic Pd-Au catalysts: Preparation, characterization, and direct hydrogen peroxide synthesis. Front. Chem. 6, 85. doi:10.3389/fchem.2018.00085
Prabriputaloong, K., and Piggott, M. (1973a). Reduction of SiO2 By molten Al. J. Am. Ceram. Soc. 56, 184–185. doi:10.1111/j.1151-2916.1973.tb12451.x
Prabriputaloong, K., and Piggott, M. (1973b). Thin‐film studies of the reduction of SiO2 by Al. J. Am. Ceram. Soc. 56, 177–180. doi:10.1111/j.1151-2916.1973.tb12449.x
Radwan, M., Rashad, M., and El-Tawil, S. (2005). Chemical upgrading and aluminothermic reduction of Egyptian sand, 5. European Journal Of Mineral Processing & Environmental Protection.
Ristić, D., Ivanda, M., and Furić, K. (2009). Application of the phonon confinement model on the optical phonon mode of silicon nanoparticles. J. Mol. Struct. 924, 291–293. doi:10.1016/j.molstruc.2008.10.054
Roberts, S., and Dobson, P. (1981). Evidence for reaction at the AI-SiO2 interface. J. Phys. D. Appl. Phys. 14, 524–1151. doi:10.1088/0022-3727/14/6/524
Rockett, A. A. (2010). The future of energy–photovoltaics. Curr. Opin. Solid State. Mater. Sci. 14, 117–122. doi:10.1016/j.cossms.2010.09.003
Saiz, E., Foppiano, S., Moberlychan, W., and Tomsia, A. (1999). Synthesis and processing of ceramic–metal composites by reactive metal penetration. Compos. Part a Appl. Sci. Manuf. 30, 399–403. doi:10.1016/s1359-835x(98)00126-2
Senoo, M., Mii, H., Fujishiro, I., and Fujikawa, T. (1976). Precise measurements of lattice compression of Al, Si and Al-Si alloys by high pressure X-ray diffractometry. Jpn. J. Appl. Phys. 15, 871–880. doi:10.1143/jjap.15.871
Shevko, V., Badikova, A., Amanov, D., Karataeva, G., and Lavrov, B. (2018). Investigation of an aluminothermic silicon separation from a corundum matrix. Rasayan J. Chem. 11, 1050–1057. doi:10.31788/rjc.2018.1132038
Standage, A., and Gani, M. S. (1967). Reaction between vitreous silica and molten aluminum. J. Am. Ceram. Soc. 50, 101–105. doi:10.1111/j.1151-2916.1967.tb15049.x
Sun, M., Nelson, A. E., and Adjaye, J. (2006). Examination of spinel and nonspinel structural models for Γ-Al2O3 By dft and rietveld refinement simulations. J. Phys. Chem. B 110, 2310–2317. doi:10.1021/jp056465z
Tan, Y., Jiang, T., and Chen, G. Z. (2021). Mechanisms and product options of magnesiothermic reduction of silica to silicon for lithium-ion battery applications. Front. Energy Res. 9, 98. doi:10.3389/fenrg.2021.651386
Teki, R., Datta, M. K., Krishnan, R., Parker, T. C., Lu, T. M., Kumta, P. N., et al. (2009). Nanostructured silicon anodes for lithium ion rechargeable batteries. Small 5, 2236–2242. doi:10.1002/smll.200900382
Tiryakioğlu, M. (2018). On the intrinsic fracture pressure of liquid and solid aluminum around its melting temperature. Metall. Mat. Trans. A 49, 5953–5955. doi:10.1007/s11661-018-4969-5
Tsuboi, Y., Ura, S., Takahiro, K., Henmi, T., Okada, A., Wakasugi, T., et al. (2017). Magnesiothermic reduction of silica glass substrate—chemical states of silicon in the generated layers. J. Asian Ceram. Soc. 5, 341–349. doi:10.1016/j.jascer.2017.06.010
Wong, D. P., Lien, H.-T., Chen, Y.-T., Chen, K.-H., and Chen, L.-C. (2012). Patterned growth of nanocrystalline silicon thin films through magnesiothermic reduction of soda lime glass. Green Chem. 14, 896–900. doi:10.1039/c2gc16459k
Yamaguchi, M., Lee, K.-H., Araki, K., and Kojima, N. (2018). A review of recent progress in heterogeneous silicon tandem solar cells. J. Phys. D. Appl. Phys. 51, 133002. doi:10.1088/1361-6463/aaaf08
Yamaguchi, S. (1974). Note on the aluminum suboxides. J. Appl. Phys. 45, 3207–3208. doi:10.1063/1.1663753
Yoshikawa, N., Nakano, Y., Sato, K., and Taniguchi, S. (2006). Fundamental study on reaction between waste glass and aluminun scrap, 70. Nippon Kinzoku Gakkaishi/Journal Of The Japan Institute Of Metals, 483
Zhou, Z.-W., Liu, Y.-T., Xie, X.-M., and Ye, X.-Y. (2016). Aluminothermic reduction enabled synthesis of silicon hollow microspheres from commercialized silica nanoparticles for superior lithium storage. Chem. Commun. 52, 8401–8404. doi:10.1039/c6cc03766f
Keywords: quartz, aluminothermic reduction, nanocrystalline silicon, silicon film, elemental composition, reduction mechanism, structural properties
Citation: Islam MM, Sawahata J, Akimoto K and Sakurai T (2022) Formation of silicon layer through aluminothermic reduction of quartz substrates. Front. Mater. 9:977869. doi: 10.3389/fmats.2022.977869
Received: 25 June 2022; Accepted: 01 September 2022;
Published: 19 September 2022.
Edited by:
Zhengfei Dai, Xi’an Jiaotong University, ChinaReviewed by:
Hock Jin Quah, University of Science Malaysia, MalaysiaWay Foong Lim, Universiti Sains Malaysia (USM), Malaysia
Yahui Tian, Anhui University, China
Copyright © 2022 Islam, Sawahata, Akimoto and Sakurai. This is an open-access article distributed under the terms of the Creative Commons Attribution License (CC BY). The use, distribution or reproduction in other forums is permitted, provided the original author(s) and the copyright owner(s) are credited and that the original publication in this journal is cited, in accordance with accepted academic practice. No use, distribution or reproduction is permitted which does not comply with these terms.
*Correspondence: Muhammad Monirul Islam, aXNsYW0ubW9uaXIua2VAdS50c3VrdWJhLmFjLmpw