 Chunxin Liu
 Taras Oriekhov2
- 1KTH Royal Institute of Technology, Department of Applied Physics, Stockholm, Sweden
- 2Nobula3D, Stockholm, Sweden
Additive manufacturing of glass is an emerging technology that is foreseen to have a big impact on glass fabrication for innovative solutions within research, as well as for industrial applications. One approach is 3D printing using glass filaments. This technique is similar to directed energy deposition (DED) of metal wires using laser melting, which is highly versatile in printing complex structures. For glass, however, the technique is still at an early stage of development. Printing complex multi-layer structures have been challenging, often resulting in poor control of print geometry, excessive evaporation, as well as low repeatability. In this work we present a systematic study of filament-based 3D printing of silica-glass using CO2-laser heating. The study focuses on the bonding width (wetting) during first-layer printing onto fused quartz substrates and during multi-layer printing, i.e., layer-to-layer bonding. The main printing parameters that have been investigated include printing speed, filament feed rate, and incident laser power. Bonding widths from 17 to 221 µm are achieved with 196 µm diameter fused silica filaments in single line printing. Using experimentally determined printing parameters for such filament, 3D printed objects consisting of more than 100 layers were subsequently demonstrated. The results presented here provide an approach in glass 3D printing, using the filament-based technique, enabling highly complex glass structures to be fabricated.
Introduction
The first synthetic glass was made before 2500 BC (Rasmussen, 2019) and today glass is a key material that can be found in all parts of society. Glass was also central to the scientific revolution (Nascimento, 2015) and is still vital for many scientific as well as industrial applications, with silicate glasses being the most common glass type. The importance of glass has been highlighted by declaring the year 2022 United Nations International Year of Glass. The properties that make glass such a valuable and versatile material include, e.g., optical (transparency), high thermal, mechanical, and chemical stability, as well as high dielectric strength. The underlying cause for these extraordinary properties is the strong covalent silicon-oxygen bond and amorphous structure. These properties also make glass a challenging material to shape and process during glass fabrication, especially for more complex objects such as micro-optics, electronic packaging, and lab-on-a-chip devices. Pure silica glass, e.g., has a softening temperature of around 1700°C and commercial production and processing of fused silica glass may require temperatures as high as 2200°C (Shelby, 2020), which is both challenging and costly. The brittle nature of glass makes machining challenging, and hydrofluoric acid is often the only chemical suitable for etching (Gupta, 2017). The successful development of glass additive manufacturing (AM) technologies would address many of these challenges. Additive manufacturing of, e.g., metals and polymers have seen a significant development, while glass AM, or glass 3D printing, considered the last frontier in AM, is still an emerging technology.
Early attempts of glass AM were based on direct laser melting/sintering of glass powders (Klocke et al., 2004) or powder-binder mixtures (Marchelli et al., 2011). These glasses, however, were not optically clear due to bubbles and porosity from non-complete sintering. Using the rod- or filament-feeding, optically clear glass structures were successfully made in 2014 (Luo, Pan and Kinzel, 2014) using CO2-laser heating and manually feeding 1 mm diameter glass rods used as feedstock, with later work automating the feeding process (Luo et al., 2018), and using thin fibers (John M. Hostetler et al., 2018; von Witzendorff et al., 2018; Kranert et al., 2020; Grabe et al., 2021; Capps et al., 2022). Glass 3D printing by melt extrusion was reported in 2015 (Klein et al., 2015; Inamura et al., 2018). Here molten soda-lime glass was gravity-fed through a nozzle at the bottom of the glass furnace crucible. The 3D printing is executed with motorized stages depositing layer-by-layer onto a build plate within a heated print-chamber. When complete, the printed object is placed in a furnace for post-annealing. As molten glass is highly corrosive, limiting the choice of nozzle material, the printing feedstock is typically restricted to glasses requiring lower processing temperatures, such as soda-lime glass or boro-silicate glass. A similar extrusion-based technique has been demonstrated using rod-feeding (Gal-Or et al., 2019; Bracha and Eran Gal-or, 2020). Because of the low glass viscosity during extrusion in combination with slow cooling dynamics of the system, due to large nozzle diameter and heated print chamber, 3D printing is typically limited to wall structures with low overhang. For low-temperature glasses 3D printing by fused deposition modeling (FDM) using glass filaments has also been demonstrated, including chalcogenide (Baudet et al., 2019) and phosphate glass (Zaki et al., 2020). To avoid the high-temperatures required for direct 3D printing of glass, alternative methods using photo-curable glass filled polymer resins or ink, or thermoplastics have been demonstrated using, e.g., stereolithography (SLA) (Kotz et al., 2017), two-photon polymerization (Kotz et al., 2021), direct-ink writing (DIW) (Nguyen et al., 2017), digital light processing (Moore et al., 2020), or FDM (Mader et al., 2021). Printing with these techniques produces a brown body, containing the glass powder and binder. The as-printed object is then heat-treated to remove the binder in order to obtain the porous green body, containing the remaining glass. The removal process when forming the green body (through drying, leaching, oxidation/combustion, or phase separation) also places limitations on the attainable thickness of printed parts, typically on the order of 1-2 mm. A sintering process at elevated temperatures is then performed in order to sinter the printed object into dense glass. These techniques enable high-resolution printing, although significant shrinkage during post-processing needs to be taken into consideration during print design. For further details and review on glass 3D printing techniques see (Zhang et al., 2020; Zhang et al., 2022).
In this work we present a systematic study on optimizing glass bonding and multi-layer deposition by filament-based glass 3D printing. Here a CO2-laser is used to locally heat fused silica glass filaments, with a diameter of 200 µm. Using non-contact laser heating avoids interaction between the nozzle and the molten glass, which enables printing of fused silica glass at temperatures in excess of 2000 C. The study focuses on the bonding width (wetting) during first-layer printing onto a fused quartz substrate and during multi-layer printing, i.e., layer-to-layer bonding. The main printing parameters that have been investigated include printing speed, filament feed rate, and incident laser power. Using experimentally determined printing parameters, 3D objects consisting of more than 100 layers have been demonstrated. The results presented here provide a pathway in glass 3D printing, using the filament-based approach, enabling highly complex glass structures to be fabricated. Due to the small diameter of the glass filaments in combination with the low coefficient of thermal expansion of fused silica, there is no need for post annealing, i.e., providing means for direct glass 3D printing.
Method, materials and experimental preparations
3D printer and filament
In early work on filament-fed 3D printing, using CO2-laser heating, a single laser beam was directed perpendicular to the print plate with the filament inserted at an angle (Luo et al., 2014). This asymmetry results in a directionally dependent glass deposition, which is detrimental when printing in a three-dimensional Cartesian coordinate system (XYZ). This was solved with the addition of a rotational stage, enabling unidirectional printing (John M. Hostetler et al., 2018; von Witzendorff et al., 2018). In order to achieve directionally independent printing, the filament should be fed perpendicular to the print plate, while being heated symmetrically. The glass 3D printer used in this work was based on this principle, with the hot-zone formed using four focused laser beams from a CO2-laser, similar to the system described in (Grabe et al., 2021), and is schematically shown in Figure 1. The glass filament was made using synthetic high purity fused silica (F300, Heraeus) and manufactured using a commercial optical fiber draw tower. The filament had a measured diameter of 196 ± 2 µm. The build plate (25 mm × 25 mm) was made of fused quartz glass. The filament was fed into the hot-zone, having a diameter of approximately 250-400 μm, and softened to enable direct line-by-line deposition onto the glass substrate. Using machine code, generated using commercial slicing software (e.g., Simplify3D, PrusaSlicer), the filament could be deposited layer-by-layer into a pre-determined 3D object.
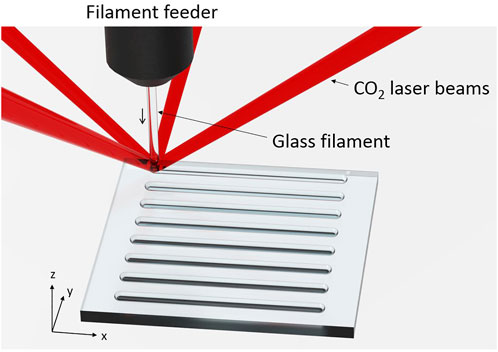
FIGURE 1. Schematic of the glass 3D printing process, showing the filament heated using four beams from a CO2-laser.
In operation, the printer is very similar to typical FDM printers used for thermoplastics. For FDM printers the height of a printed line is set by the position of the extrusion nozzle in direct contact with the molten thermoplastic, while the width is defined by the inner diameter of the nozzle and filament feed rate. However, when using non-contact laser heating the height and width of a printed line is affected by glass viscosity, surface tension (energy), wetting and material loss through evaporation. The print results are therefore highly dependent on the printing temperature. The main printing parameters include laser power, printing speed, and filament feed rate, which will determine layer width and layer height. Whereas FDM printers can use variable layer height, with a high degree of flexibility, filament-fed glass 3D printing is more stringent as the layer height must be known to enable multi-layer printing.
Laser power settings
During the deposition process, the laser locally heats both the substrate and the filament, and it is important to maintain a small temperature difference while fusing them together to ensure strong bonding. Due to the larger size, the print plate takes longer time to heat and is typically colder than the heated filament. Over-feeding the filament has shown to improve bonding, especially for the bonding of the first layer to the substrate. Consistent bonding, determined empirically, has been achieved using a feed rate of 150%, e.g. 100 mm/min printing speed using a filament feed rate of 150 mm/min. For this study, a suitable range of laser power settings were determined for different printing speeds in order to enable high quality printing. Single lines with a length of 15 mm were printed, with a separation of 1 mm, onto a quartz glass substrate. When the laser power is too high, significant evaporation of silica can occur, while if too low printed lines become unstable and wiggly due to insufficient heating (viscosity too high). Suitable power settings were then simply set to be the range between these two extremes, with examples shown in Figure 2. Figure 3 shows the resulting plot of suitable power settings in the range of 2.2–5.3 W as a function of printing speed, between 10 and 100 mm/min. For laser power measurements, the detector was placed at the position of the print plate. The laser power from the CO2-laser (ULR25 universal Laser Systems) was stable within ±2% during measurements. A filament feed rate of 150% was used throughout this work. Using the laser power settings from Figure 3 ensures consistent printing with wide bonding width for printing speeds between 10 and 100 mm/min. The laser power presents a near-linear growth as a function of printing speed.
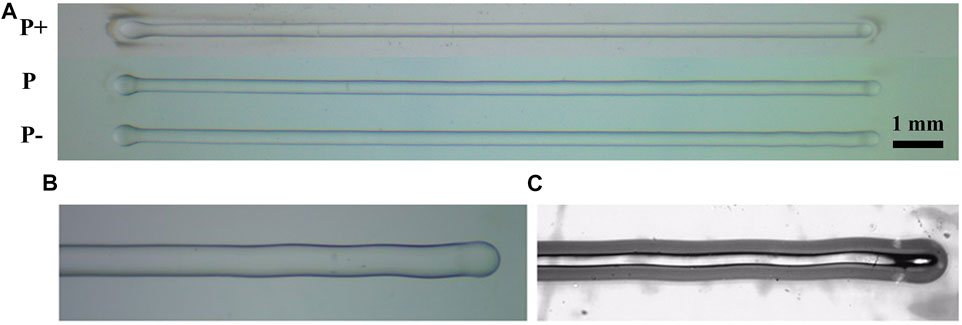
FIGURE 2. Microscope images of lines printed at 60 mm/min (A) when using (P+) too much laser power showing fumed silica deposits (P) suitable laser power, and (P-) using too low laser power showing wiggling. Note the wiggly phenomenon is more obvious towards the end due to the accumulated instability during the line printing. Magnified images of wiggles are shown when viewed from top (B) and from bottom (C), through the substrate.
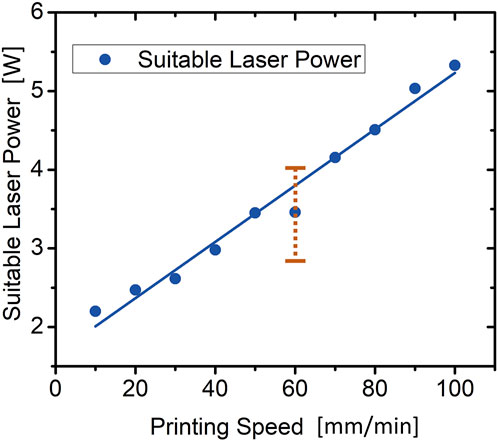
FIGURE 3. Laser power as a function of printing speed, at 150% filament feed rate, for good printing performance. The solid line represents a linear fit with a slope of 0.036, while the dotted line shows the P-range (between P+ and P-) of suitable power when printing at 60 mm/min.
Single line printing
In order to further understand the influence of printing parameters on the layer height and width, as well as bonding conditions, two sets of experiments were performed. In the first set of experiments the printing speed was held constant at 60 mm/min, while varying laser power in the range between 2.8 and 4.0 W, indicated by the dashed line in Figure 3. In the second set of experiments the printing speed was varied between 10 mm/min to 100 mm/min, in steps of 10 mm/min, using the previously determined suitable laser power settings (data points shown in Figure 3). Fused silica filaments with a diameter of 196 ± 2 µm and a feed-rate of 150% were used for both sets of experiments.
Multi-layer printing
When printing multi-layered wall structures, the first layer is bonded to the glass substrate while the subsequent layers are printed onto the previously deposited filament. Due to the large volume of the print plate compared to the small width of the printed line, we can expect that the ideal print parameters for first layer and subsequent layers differ. Less energy will be required to heat the thin wall structure, compared to the larger quartz plate. The first layer should therefore be printed at a higher laser power (5.3 W), enabling sufficient temperature increase of the build plate, while lower power (4.8 W) is used for subsequent layers. This is similar to FDM printing where the first layer is typically printed with higher printing temperature in order to ensure stable adhesion of the print to the build plate.
To evaluate multi-layer printing using the glass 3D printer a simple CAD model was used, consisting of a single filament wall cuboid structure with the dimensions of 10.5 mm (w) × 3.5 mm (d) × 21 mm (h). After printing the first layer to the substrate using higher laser power, the subsequent layers were printed at lower power using vase-mode, i.e. continuous printing of the wall structure using an uninterrupted length of filament with no infill.
Sample characterization and analysis
Printed samples were characterized using a calibrated optical microscope (Nikon Eclipse LV100) equipped with back illumination and polarizer/analyzer to examine stress induced birefringence. Analysis of printed line widths were performed using top view images, as shown in Figure 2A. By viewing through the print substrates (bottom view), as shown in Figure 2C, the bonding width between printed line and substrate could easily be measured and analyzed along the length of the printed line. To accurately measure the height of the printed line, samples were cut perpendicular to the printed line, using a high-speed dicing saw. Cross-sectional analysis also provided additional data regarding line width and bonding width.
For printed lines an estimation of material loss, due to evaporation, was performed by comparing the cross-sectional areas of the printed lines with calculated values. Following line printing, samples were cut, using the high-speed dicing saw, perpendicular to the lines to enable microscope imaging of the cross-sections. Height and width of each printed line, measured at several points along the line, were then attained by fitting an ellipsoid with the height axis perpendicular to the print plate. The cross-sectional areas were calculated assuming an elliptical shape with the average values of the measured width and height used as the major and the minor axes of the ellipse. For a filament diameter of 196 µm and printing with a feed rate of 150%, an ideal cylindrical line would have a diameter of 240 µm.
To estimate the material loss during multi-layer printing, the same model was printed ten times using identical printing parameters/machine code. Each print was then weighed using an analytical balance (Acculab, ATL-224), with the net weight of the printed part obtained by subtracting the weight of the substrate plate. As reference, the ideal weight of the printed object was calculated from the total length of filament used in the machine code, and assuming a diameter of 196 µm and a density of ρ = 2.201 g/cm3.
Experiments results
Single line printing
The results from single line printing using a constant printing speed of 60 mm/min, with different power levels, is shown in Figure 4. Microscope images of the printed lines using five different power settings are shown in Figure 4A (top view used for line width measurements) and Figure 4B (bottom-view used for bonding width measurements). The cross-section for the corresponding lines are shown in Figure 4C. The data extracted from the images in Figure 4 (height, width and bonding length) are plotted in Figures 5A,B.
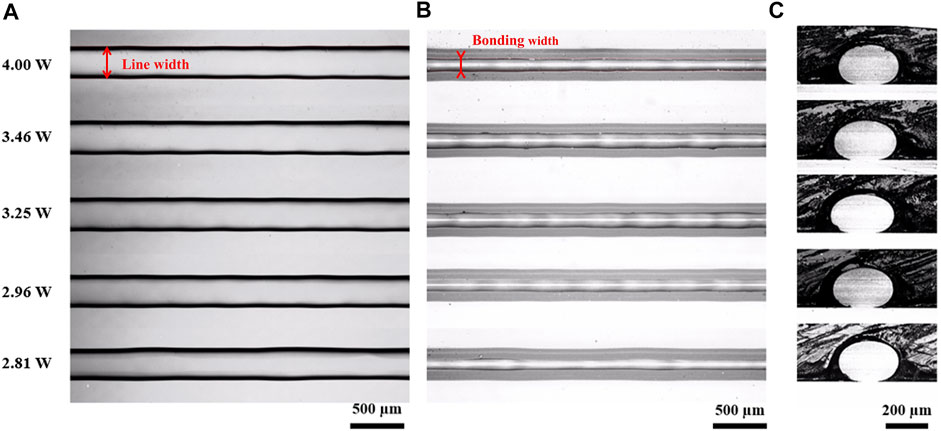
FIGURE 4. Top-view (A), bottom-view (B), and cross-sectional images (C) of lines printed at 60 mm/min. The corresponding laser power is indicated in (A).
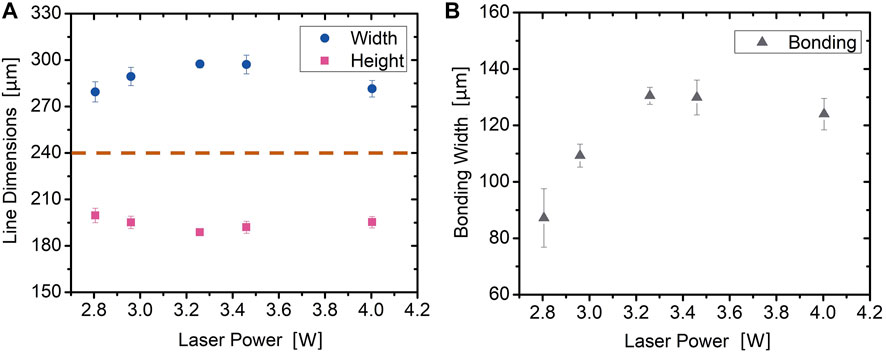
FIGURE 5. The measured line height and width (A) derived from Figure 4, with (B) the corresponding bonding width. The dashed line in (A) indicate height and width (240 µm) for an ideal cylindrical line. Error bars are standard deviation (n = 10).
With increasing power, the width of the printed line increases, reaching a peak around 3.4 W, after which it decreases slightly. The height shows opposite trend, with a minimum around 3.4 W. The bonding width between printed line and glass substrate increases in value, also peaking near 3.4 W, followed by a slight decrease with further increasing power.
The second set of experiments was performed at different printing speeds ranging from 10–100 mm/min, in steps of 10 mm/min. Here, the corresponding laser powers found suitable for line printing (shown in Figure 3) were used for the corresponding printing speed. The microscope images presented in Figure 6A show the top-view for 10 lines printed at different speeds (bottom-view not included), while Figure 6B shows the corresponding cross-sections. The data extracted from Figure 6 (height, width, and bonding width) are plotted in Figures 7A,B.
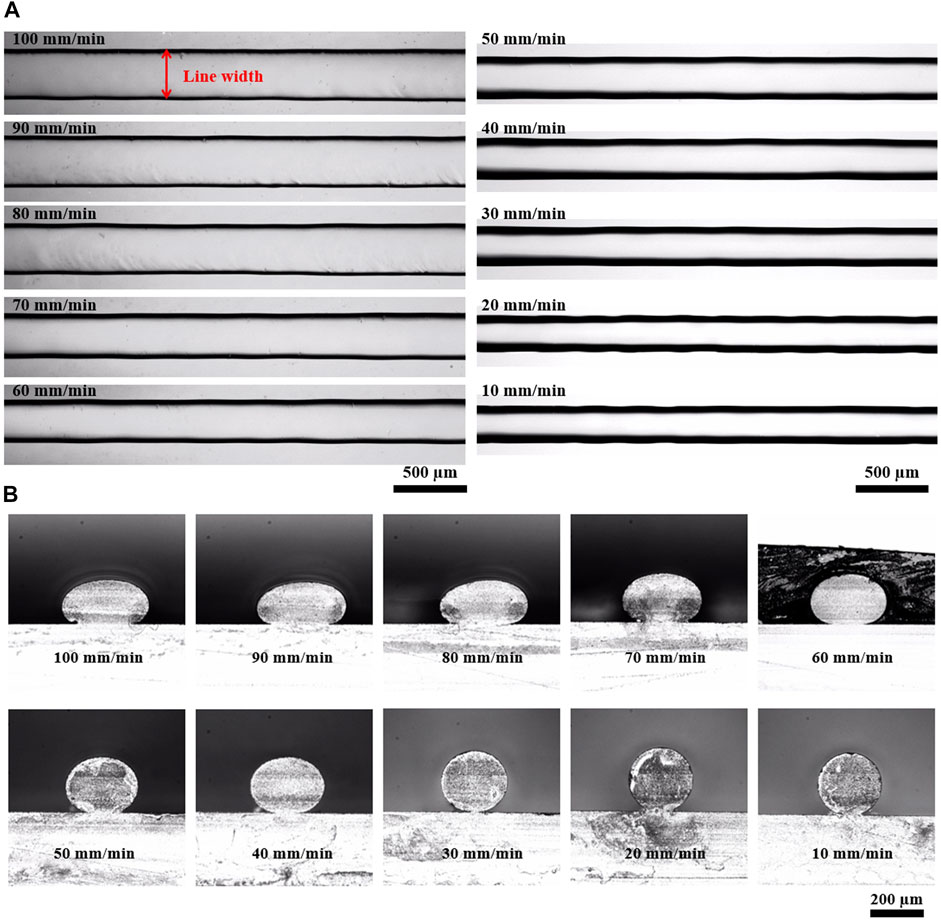
FIGURE 6. Top-view (A), and cross-sectional images (B) of lines printed at 10–100 mm/min with corresponding laser power plotted in Figure 3.
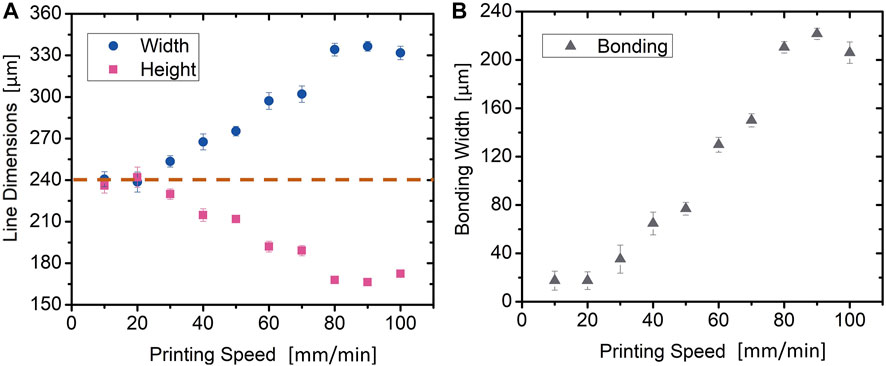
FIGURE 7. The measured line height and width (A) as a function of printing speed, derived from Figure 4, with (B) showing the corresponding bonding width. The dashed line in (A) indicate height and width (240 µm) for an ideal cylindrical line. Error bars are standard deviation (n = 10).
For low printing speeds (≤20 mm/min) the height and width of printed lines are nearly equal and close to 240 µm (Figure 7A), which corresponds to an ideal cylinder as can also be seen in Figure 6B. Due to the low deformation in shape, the bonding width was very low. For these low printing speeds short sections of the printed line was not bonded, with the discontinuous bonding leaving gaps between the line and print plate. Increasing printing speed (>20 mm/min) the now fully bonded lines deform and increase in width, reaching a peak value of 337 μm at a printing speed of approximately 90 mm/min, followed by a small decrease at 100 mm/min. The line height shows a corresponding inverted behavior, reaching a minimum value of 166 μm, at 90 mm/min, followed by a small increase at 100 mm/min. The bonding width follows a similar trend as line width, reaching a peak value of 222 μm at 90 mm/min, followed by a slight decrease.
Multi-layer printing
When printing the multi-layer structure, the first layer was printed at 100 mm/min with the laser power set to 5.3 W, corresponding to a bonding width of 206 µm (see Figure 7B) and a layer height of 172 µm. For the following layers the same printing speed of 100 mm/min was chosen, representing the highest value studied in this work. The laser power was reduced to 4.8 W for layer-to-layer printing. The layer height, determined empirically, was set to 200 μm, with the feed rate for all layers set to 150%.
Figure 8A shows the CAD model used to generate the machine code sent to the printer, while Figure 8B shows a photograph of the final 3D printed structure. A total of 105 layers were used to complete the print, having a total height of 21 mm, which corresponds to a filament length of 4.6 m. The printed glass was transparent, with the layered structure clearly visible. Figure 8C shows a microscope image of the 3.5 mm wide side wall, indicating highly reproducible layer-to-layer printing. Figure 9A shows a microscope image of the cross-section of the print after dicing, with Figures 9A,B showing histograms from analyzing the layer width and bonding width, respectively. The cross-sectional study of the print showed an average line width of 274 ± 7 µm and an average bonding width of 99 ± 12 μm, with the layer height set to 200 µm.
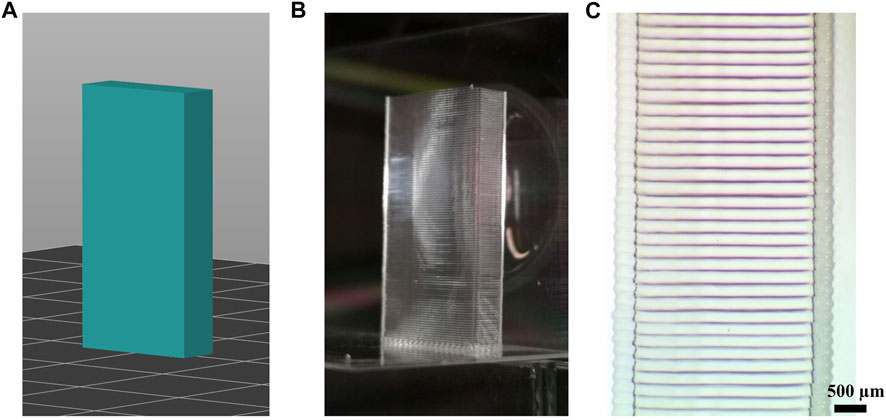
FIGURE 8. (A) Original CAD model of the 105-layer print (10.5 mm × 3.5 mm × 21 mm); (B) photo of the final print; (C) microscope image showing section of the 5 mm side wall of the printed structure.
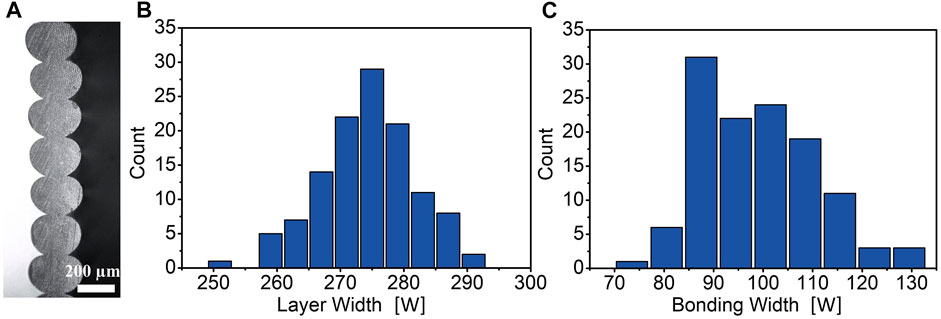
FIGURE 9. Microscope image (A) of the cross section of the multi-layer print after dicing, with the corresponding histogram of (B) the measured layer width and (C) the measured bonding width.
When analyzing the printed structures using crossed polarizers, no stress-induced birefringence could be detected indicating low built in stress in the printed object.
Discussion
To enable 3D printing of large multi-layered structures, the effect of process parameters on layer bonding and layer height is of central importance.
During line printing, we can assume a there is a threshold temperature at which the glass bonds to the surface. This threshold will be related to the temperature of the heated filament as well as the temperature of the substrate. If we assume a Gaussian intensity distribution of the laser beams, the area on the substrate having a temperature above the threshold value will increase with increasing intensity. With an increase in laser power we can expect an increase in bonding width between the deposited filament and glass substrate. When increasing laser power while the printing speed is kept constant, shown in Figure 5, the bonding width increased before leveling off (near 3.3 W), with a slight decrease for even higher powers (4 W). The same behavior is seen in Figure 7B, showing the bonding width as a function of printing speed. The increase in speed is also associated with an increase in power, according to data in Figure 3. Here, the bonding width levels off at 90 mm/min (5 W), followed by a slight decrease at 100 mm/min.
With an increase in bonding width, there is a corresponding increase in line width and reduction in height, as shown in Figure 10A. This dependence is due to the conservation of volume of printed filament. In Figure 10B, the height is plotted as a function of width. Here the dashed lines at 240 µm corresponds to the ideal symmetrical line structure without deformation, while the solid line corresponds to increased deformation (ellipsoids) of equal volume.

FIGURE 10. (A) Printed line width and height as a function of bonding width, and (B) height as a function of width. The dashed line corresponds to a symmetric cylinder, while solid line represents ellipsoids of same volume.
The 3D printer in this study used four focused beams resulting in a hot-zone with a diameter of approximately 250-400 μm, slightly larger than the glass filament, having a diameter of ∼200 µm. Using a feed rate of 150%, deposited line widths in these experiments cover a range from 240 to 335 µm. As the printed line width increases, less radiation from the laser beams will reach the substrate, resulting in an increase in temperature difference between filament and substrate, which could explain the bonding width leveling off in Figures 5, 7. Increasing power further will simply increase evaporation. To increase the bonding width, the spot size and hot-zone should be increased.
For multi-layer printing the layer width differs slightly from that of the first layer. When printing first layer at 100 mm/min, the line width was 332 μm, while 274 µm for multilayer printing. The corresponding bonding widths were 206 and 99 μm, respectively. The dissimilar values are likely due to differences in thermal dynamics, as the substrate is replaced with a printed line, but will also depend on the set layer height in the machine code.
The experimental data on height and width during single line printing, plotted in Figure 10B, closely follow the solid line, which represents ellipsoids with equal volume (height and width inversely proportional) corresponding to zero evaporation. This indicated that little evaporation occurs during printing. The material loss estimates used here are prone to errors, e.g., due to variation in filament diameter and non-ideal fitting as the printed line does not represent a perfect ellipsoid. For multilayer printing, the average material loss measured for 10 identically printed structures was -1.56 ± 2%, with the negative loss indicative of large errors using this method. In all the cases estimated losses are low, with no vaporization visible during printing or deposited onto the build plate. The low rate of vaporization presented in this work, in comparison to other reports (Sleiman et al., 2021) is ascribed to highly stable and controlled laser heating while using a small hot-zone (250-400 µm in diameter), with the required laser power for printing fused silica glass being less than 5.5 W.
Conclusion
In order to realize 3D printing of complex multi-layered glass structures, the effect of process parameters on first layer, and layer-to-layer printing has been investigated. The glass 3D printer used a CO2-laser to locally heat fused silica glass filament with a diameter of 196 μm, which was fed perpendicular to a quartz glass substrate plate mounted on a translation stage. Symmetric heating was achieved using four focused laser beams in co-axial arrangement. The main process parameters that were studied included laser power and printing speed. To avoid evaporation and increase stability during deposition, a working range for launched laser power was identified for printing speeds in the range between 10 mm/min to 100 mm/min. Experimental results provided details on the bonding between lines and substrate, as well as shape dynamics (height and width) of printed lines. Based on these results, 10 identical models of a 21 mm tall container with a 10.5 mm × 3.5 mm base were printed with high reproducibility. Using a layer height of 200 µm and a printing speed of 100 mm/min, each print consisted of 105 layers. After the first layer, the printing was performed with a continuous filament using the vase mode setting from the slicer. Cross-sectional analysis of the printed walls showed highly repeatable layer height and stable layer-to-layer bonding, without any gaps.
The results presented here, using the filament-based glass 3D printing technique, represent a significant advancement in the field of glass additive manufacturing. Enabling additive manufacturing of fused silica glass, with high resolution, provides a new platform for advanced glass fabrication for a range of current and future applications within life science, chemistry, optics and electronics.
Data availability statement
The raw data supporting the conclusion of this article will be made available by the authors, without undue reservation.
Author contributions
CL performed the printing experiments, measurements, and data analysis and drafted original manuscript. TO prepared samples, plotted data and reviewed the manuscript. MF supervised the work and reviewed and edited the manuscript.
Acknowledgments
We acknowledge funding from the Swedish Foundation for Strategic Research (grant RMA15-0135).
Conflict of interest
The authors declare that the research was conducted in the absence of any commercial or financial relationships that could be construed as a potential conflict of interest.
Publisher’s note
All claims expressed in this article are solely those of the authors and do not necessarily represent those of their affiliated organizations, or those of the publisher, the editors and the reviewers. Any product that may be evaluated in this article, or claim that may be made by its manufacturer, is not guaranteed or endorsed by the publisher.
References
Baudet, E., Ledemi, Y., Larochelle, P., Morency, S., and Messaddeq, Y. (2019). 3D-printing of arsenic sulfide chalcogenide glasses. Opt. Mat. Express 9 (5), 2307–2317. doi:10.1364/OME.9.002307
Bracha, Arik, and Gal-or, Eran (2020). 3D printing system for printing high melting temperature materials. US20200070415.
Capps, N., Goldstein, J., and Kinzel, E. (2022). “Digital glass forming of photonics,” in Laser applications in microelectronic and optoelectronic manufacturing (LAMOM) XXVII (United States: SPIE), 99–106. doi:10.1117/12.2610698
Gal-Or, E., Gershoni, Y., Scotti, G., Nilsson, S. M. E., Saarinen, J., Jokinen, V., et al. (2019). Chemical analysis using 3D printed glass microfluidics. Anal. Methods 11 (13), 1802–1810. doi:10.1039/C8AY01934G
Grabe, T., Lammers, M., Wang, S., Wang, X., Rettschlag, K., Sleiman, K., et al. (2021). “Additive manufacturing of fused silica using coaxial laser glass deposition: experiment, simulation, and discussion,” in Laser 3D manufacturing VIII (United States: SPIE), 45–56. doi:10.1117/12.2577205
Gupta, Kapil (2017). Advanced manufacturing technologies. 1st edn. Berlin: Springer Cham. Available at: https://link.springer.com/book/10.1007/978-3-319-56099-1.
Hostetler, John M., Kinzel, E., Landers, R. G., and Bristow, D. A. (2018) ‘Fiber-fed laser-heated process for printing transparent glass from single mode optical fiber’, in Proc. SPIE , Laser 3D Manufacturing V. doi:10.1117/12.2291443
Inamura, C., Stern, M., Lizardo, D., Houk, P., and Oxman, N. (2018). Additive manufacturing of transparent glass structures. 3D Print. Addit. Manuf. 5 (4), 269–283. doi:10.1089/3dp.2018.0157
Klein, J., Stern, M., Franchin, G., Kayser, M., Inamura, C., Dave, S., et al. (2015). Additive manufacturing of optically transparent glass. 3D Print. Addit. Manuf. 2 (3), 92–105. doi:10.1089/3dp.2015.0021
Klocke, F., McClung, A., and Ader, C. (2004) ‘Direct laser sintering of borosilicate glass’, in 2004 International Solid Freeform Fabrication Symposium. Aug 04 doi:10.26153/tsw/6986
Kotz, F., Arnold, K., Bauer, W., Schild, D., Keller, N., Sachsenheimer, K., et al. (2017). Three-dimensional printing of transparent fused silica glass. Nature 544 (7650), 337–339. doi:10.1038/nature22061
Kotz, F., Quick, A. S., Risch, P., Martin, T., Hoose, T., Thiel, M., et al. (2021). Two‐photon polymerization of nanocomposites for the fabrication of transparent fused silica glass microstructures. Adv. Mat. 33 (9), 2006341. doi:10.1002/adma.202006341
Kranert, F., Wienke, A., Hohnholz, A., and Rettschlag, K. (2020). “Generation of functional curved waveguides by CO2-laser based deposition of coreless fused silica fibers,” in 3D printed optics and additive photonic manufacturing II (United States: SPIE), 8–15. doi:10.1117/12.2554516
Luo, J., Hostetler, J. M., Gilbert, L., Goldstein, J. T., Urbas, A. M., Bristow, D. A., et al. (2018). Additive manufacturing of transparent fused quartz. Opt. Eng. 57 (04), 1. doi:10.1117/1.OE.57.4.041408
Luo, J., Pan, H., and Kinzel, E. C. (2014). Additive manufacturing of glass. J. Manuf. Sci. Eng. 136 (6). doi:10.1115/1.4028531
Mader, M., Hambitzer, L., Schlautmann, P., Jenne, S., Greiner, C., Hirth, F., et al. (2021). Melt-extrusion-based additive manufacturing of transparent fused silica glass. Adv. Sci. (Weinh). 8 (23), 2103180. doi:10.1002/advs.202103180
Marchelli, G., Prabhakar, R., Storti, D., and Ganter, M. (2011). The guide to glass 3D printing: Developments, methods, diagnostics and results. Rapid Prototyp. J. 17 (3), 187–194. doi:10.1108/13552541111124761
Moore, D. G., Barbera, L., Masania, K., and Studart, A. R. (2020). Three-dimensional printing of multicomponent glasses using phase-separating resins. Nat. Mat. 19 (2), 212–217. doi:10.1038/s41563-019-0525-y
Nguyen, D. T., Meyers, C., Yee, T. D., Dudukovic, N. A., Destino, J. F., Zhu, C., et al. (2017). 3D-Printed transparent glass. Adv. Mat. 29 (26), 1701181. doi:10.1002/adma.201701181
Rasmussen, S. C. (2019). A brief history of early silica glass: Impact on science and society. Substantia 3, 125–138. doi:10.13128/Substantia-267
Shelby, J. E. (2020). Introduction to glass science and technology. London: Royal society of chemistry.
Sleiman, K., Rettschlag, K., Jaschke, P., Capps, N., Kinzel, E. C., Overmeyer, L., et al. (2021). Material loss analysis in glass additive manufacturing by laser glass deposition. J. Laser Appl. 33 (4), 042050. doi:10.2351/7.0000482
von Witzendorff, P., Pohl, L., Suttmann, O., Heinrich, P., Heinrich, A., Zander, J., et al. (2018). Additive manufacturing of glass: CO2-Laser glass deposition printing. Procedia CIRP 74, 272–275. doi:10.1016/j.procir.2018.08.109
Zaki, R. M., Strutynski, C., Kaser, S., Bernard, D., Hauss, G., Faessel, M., et al. (2020). Direct 3D-printing of phosphate glass by fused deposition modeling. Mater. Des. 194, 108957. doi:10.1016/j.matdes.2020.108957
Zhang, D., Liu, X., and Qiu, J. (2020). 3D printing of glass by additive manufacturing techniques: a review. Front. Optoelectron. 14 263. doi:10.1007/s12200-020-1009-z
Keywords: glass 3D printing, laser deposition, additive manucatruing, glass fabrication, glass filament, glass bonding
Citation: Liu C, Oriekhov T and Fokine M (2022) Investigation of glass bonding and multi-layer deposition during filament-based glass 3D printing. Front. Mater. 9:978861. doi: 10.3389/fmats.2022.978861
Received: 26 June 2022; Accepted: 01 August 2022;
Published: 25 August 2022.
Edited by:
Stefan Karlsson, RISE Research Institutes of Sweden, SwedenReviewed by:
Heike Ebendorff-Heidepriem, University of Adelaide, AustraliaJian Cheng, Harbin Institute of Technology, China
Copyright © 2022 Liu, Oriekhov and Fokine. This is an open-access article distributed under the terms of the Creative Commons Attribution License (CC BY). The use, distribution or reproduction in other forums is permitted, provided the original author(s) and the copyright owner(s) are credited and that the original publication in this journal is cited, in accordance with accepted academic practice. No use, distribution or reproduction is permitted which does not comply with these terms.
*Correspondence: Chunxin Liu, Y2h1bnhpbkBrdGguc2U=