 T. Vamsi Nagaraju
 Alireza Bahrami
 Marc Azab
 Susmita Naskar
- 1Department of Civil Engineering, SRKR Engineering College, Bhimavaram, India
- 2Department of Building Engineering, Energy Systems and Sustainability Science, Faculty of Engineering and Sustainable Development, University of Gävle, Gävle, Sweden
- 3College of Engineering and Technology, American University of Middle East, Egaila, Kuwait
- 4Faculty of Engineering and Physical Sciences, University of Southampton, Southampton, United Kingdom
Geopolymer concrete is a sustainable substitute for traditional Portland cement concrete. In addition, rising carbon taxes on carbon emissions and energy-intensive materials like cement and lime, impacts the cost of industrial by-products due to their pozzolanic nature. This research evaluates the compressive strength and flexural strength of geopolymer concrete, and the compressive strength of geopolymer mortar. Geopolymer mortar data were used for the strength assessment employing an analytical approach, and geopolymer concrete data were utilized for the strength and sustainability performances. Using artificial neural networks (ANNs), multi-linear regression (MPR) analysis, and swarm-assisted linear regression, compressive strength models were created based on experimental datasets of geopolymer mortar mixes with variable precursors, alkali-activator percentages, Si/Al, and Na/Al ratios. The strength and sustainability performances of geopolymer concrete blends with various precursors were assessed by considering cost-efficiency, energy efficiency, and eco-efficiency. The work’s originality comes from enhancing sustainable high-performance concrete without overestimating or underestimating precursors. Extensive experimental work was done in the current study to determine the best mix of geopolymer concrete by varying silica fume, ground granulated blast furnace slag (GGBS), and rice husk ash (RHA). A scanning electron microscopic study was conducted to understand the geopolymer matrix’s microstructure further. A comprehensive discussion section is presented to explain the potential role of RHA. The replacement of conventional concrete in all its current uses may be made possible by this sustainable high-performance concrete utilizing RHA.
1 Introduction
Ordinary Portland cement (OPC) with the standard grade was the starting point for the evolution of concrete. OPC was widely used in the 1900s for buildings, offers sufficient strength for widespread use, and is the most acceptable substitute for lime mortars (Hall, 1976). The amount of OPC in concrete is crucial for achieving strength, and in most cases, less than 350 kg/m3 of OPC is used (Nazari et al., 2019). Eventually, due to the necessity for increased strength in buildings, pozzolanic additives have been utilized since 1960 in the mix percentage to sustain load capacities ranging from 50 to 90 MPa (Dinakar et al., 2008). Pozzolanic additives, which have been used for high-rise buildings, bridges, and heavy-duty structures, are nothing more than industrial by-products that are finer and richer in silica and alumina elements (Dembovska et al., 2017; Bumanis et al., 2020). On the other hand, manufacturing process of OPC involves higher energy consumption and CO2 emission. So, green materials without carbon footprint are much needed in the current construction industry (Mohanty et al., 2002; Liew et al., 2017).
Geopolymers have drawn interest from the civil engineering community since the 1990s because of their potential and minimal carbon footprint. Thanks to their strength and temperature resistance qualities, geopolymers formed of such alkaline activated forms have been shown to be ideal building materials (Singh et al., 2015). Numerous researchers have used pozzolanic precursors and potassium hydroxide activating liquids to produce alkaline systems. In reaction, they produced phases of hydrated calcium silicate (C-S-H) (Bondar et al., 2011; Azad and Samarakoon, 2021). Using silicon and aluminum-rich minerals, such as clay with kaolinite mineral, activated by alkaline aqueous systems, Davidovits, a French scientist, produced an alkali-activated material (Davidovits, 1994). Similar to how polymeric materials are made, geopolymers are substances made by condensation polymerization. Amran et al. (2020) assessed the environmental effects of the manufacture of geopolymer concrete in 2011 by contrasting its life cycle with that of OPC. Alkali-activated concrete was demonstrated to be more environmentally friendly than regular OPC (McLellan et al., 2011; Amran et al., 2020).
Alkali-activated substances are even less aggressive than OPC because there is less CO2 released into the environment. According to an investigation, cement made using geopolymers performs better than conventional OPC in reducing CO2 by 26%–45% (Turner and Collins, 2013). Additionally, a solution containing a mixture of sodium silicates (Na2SiO3) gel and sodium hydroxide (NaOH) pallets was utilized to prepare the activator solution employed in the geopolymerization process (Rajamma et al., 2012). The materials rich in chemical constituents such as Si, Al, and Ca, are desirable for preparing alkali-activated materials. Fly ash, rice husk ash (RHA), and ground granulated blast furnace slag (GGBS) are a few of the pozzolanic materials that are frequently used (Bernal et al., 2012; Wang et al., 2020; Singh, 2021). According to the most recent research, employing just one kind of activating binders, like sodium silicate, in concrete is thought to be the most extravagant element. Therefore, it was advised to establish a unique approach, and the activators should be prepared from carefully chosen less aggressive ingredients (Chen et al., 2021). Geopolymerization is strongly influenced by chemical components like Si and Al in the geopolymers. Studies linking these elements to strength attributes are insufficient due to the challenges in determining them (Ryu et al., 2013; Divvala, 2021). On the other hand, other factors, including the amount of the precursor, its kind, its structural shape, its surface area, the gradation of the fine aggregates, the presence of alkali-activators, and the temperature, all affect the strength characteristics (Vora and Dave, 2013; Luan et al., 2021). Numerous studies have constructed appropriate interrelations and projected strength behavior based on these qualities (Joseph and Mathew, 2012; Luan et al., 2021). Ma et al. (2018) and Kashani et al. (2019) examined the impact of precursor type on the strength behavior of geopolymer concrete. At the same time, Kong and Sanjayan (2010) have reported a link between temperature and alkali-activators characteristics. According to previous literature, the ratio of Na2SiO3 to NaOH, and the alkali-activators molarity contribute the geopolymer concrete’s strength (Madheswaran et al., 2013). In general, concrete cured at increased temperatures exhibits stronger behavior than ambient concrete, which is principally attributable to the alkali-activators effective dilution of the Si and Al ions. Therefore, when a precursor is added to the geopolymer blends, numerous chemical reactions known as geopolymerization occur, which adds to the blends’ increased strength. Undeniably, the chemical reaction that results from the interaction of alkali-activators and precursors is greatly influenced by variables like curing time, humidity, and a few other elements (Al Bakria et al., 2011; Oderji et al., 2017). Due to the lack of adequate, pertinent data, it has also been discovered from previous studies that few researchers have documented meaningful information on the impact of these characteristics on strength fluctuations. It makes sense to say that choosing precursors based on Si/Al and Na/Al, which are connected to chemical reactions, is advantageous (Liu et al., 2020; Wang et al., 2021; Liu et al., 2022). However, not many studies look at the underlying connections between these parts.
Understanding the function of precursors in geopolymerization is the aim of the current article. This study investigates the use of artificial neural network (ANN) principles for predicting the compressive strength of geopolymer mortars based on experimental data with different precursor dosages. By anticipating the most suitable mixture and preventing over/under-dose of precursors, the study’s findings will significantly aid in reducing project costs. The sustainability performance of the geopolymer mixes is also highlighted in this research, which is vital for the efficient and sustainable design of geopolymer-based civil engineering infrastructures.
2 Research significance
Using locally accessible materials instead of expensive ones, the potential replacement of RHA in geopolymer concrete could lower the cost of geopolymer concrete production. As a result, the primary goal of the current study is to investigate if it is possible to produce sustainable geopolymer concrete using locally accessible RHA obtained from the brick kiln, which will be utilized as a partial substitute for traditional precursors. This research evaluates the strength properties and microstructural growth of geopolymer concrete made of GGBS, RHA, and silica fume. This study’s initial phase examined the impact of substituting GGBS and silica fume for a portion of RHA on the compressive strength of geopolymer concrete. The compressive strength of geopolymer mortars was evaluated in the second step utilizing soft computing methods. To identify the geopolymer concrete mix with the highest sustainable performance, cost-efficiency, energy-efficiency, and eco-efficiency were also calculated for all the mixes.
Managing agricultural by-products has become necessary in recent years to prevent accumulation and maintain a clean, safe environment. Unfortunately, RHA is one of these by-products that is harmful to both the environment and human health. Today, there is a severe issue with agricultural waste because of the rapid rise of urbanization and industrialization. Due to these constraints, cutting-edge and unconventional research on waste reuse in the building sector is becoming increasingly important.
3 Potential role of RHA as building material
India has a wide variety of cultural traditions with 1.4 billion people (Kaygusuz, 2012). India’s economy relies heavily on agriculture, with a contribution of greater than 15% gross domestic product. The main food supply for the Indian subcontinent is the rice farming system, which is practiced over roughly 44 million hectares of land in India. According to the average harvest index of 0.45, India produces 127 MT of leftovers annually (Dutta et al., 2022). Figure 1 shows the agricultural biomass share from various crops (Jain et al., 2018). Farmers are forced to dispose of the leftovers because of various socioeconomic, organizational, technical, and commercial issues, which trigger various ecological problems. Each year, India produces 683 million tons of residue, with around 2/3 of that amount coming from cereal crop residues and the remaining from other crops that yield surplus residue (Jain et al., 2018; Srivastav et al., 2021; Dutta et al., 2022). An excess of 178 million tons remains after recycling over 500 million tons in various sectors, including industrial, residential, and livestock feed (Sangeet and Kumar, 2020). The preference for paddy in Asia is a major factor in the continent’s greater residue-burning rates than other continents. India’s residue-burning rates are 93% and 30% higher than those of Pakistan and China (mainland), respectively (Dutta et al., 2022). Figure 2 illustrates the top five nations CO2eq emissions burning crop residues.
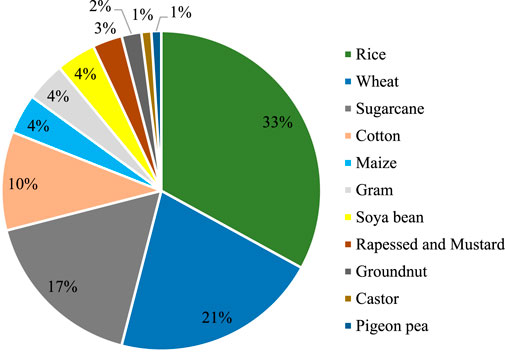
FIGURE 1. Agricultural biomass residues share in India.
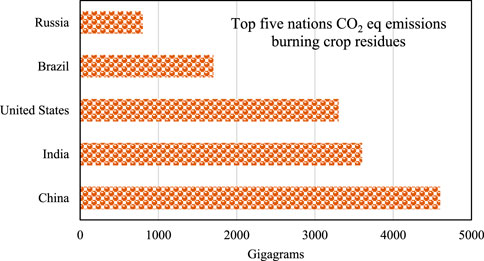
FIGURE 2. CO2 emissions burning crop residues.
In addition to having a high content of amorphous silica, the rice husk has a considerable calorific value. The use of rice husk residue to generate electricity and high-value manufacturing has recently increased among numerous Asian rice millers and companies. An estimated 800 kWh of electricity can be produced from one ton of rice husk. The power conversion advancements include flash thermal decomposition, enzymatic hydrolysis, ethanol digestion, co-firing, gasifier, hydrocarbon production, burning fuel, and direct combustion electricity production (gas turbine, steam generator, and energy storage). In the modern day, only two of these technology solutions as burning fuel and electricity production are commonly used. Burning fuel heating can use traditional boilers and hot water turbines. Both boilers that generate steam for energy and brick kilns that self-burn clay bricks to consolidate them, utilize rice husks as a fuel. Over 10% of the world’s burnt clay brick production is produced in India, the second-largest producer in the world. More than 0.1 million brick kilns, which generate around 150–200 billion bricks annually, are said to exist in India (Guttikunda et al., 2014). Industrial brick kilns that burn waste rice husk from agriculture produce much leftover rice when they use the fuel between the columns of the kilns to fire shroud RHA (Jittin et al., 2020). Figure 3 displays RHA from field collection to laboratory preparation.
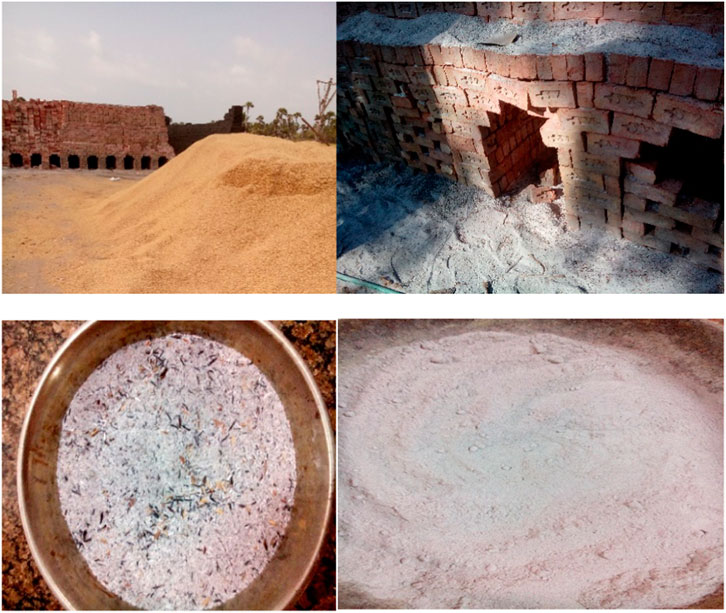
FIGURE 3. Rice husk and RHA at brick kiln.
One of the waste-to-energy methods is the use of rice husks from agricultural waste. However, issues must be addressed before RHA is also disposed of in landfills and aquatic bodies, which pollutes the environment because it is not properly treated. Therefore, using rice husk as fuel cannot be referred to as “green material” if RHA from diverse sectors is not utilized well. Pre-processed RHA has demonstrated potential in recent years as an additional binding component for concrete slabs, modified concrete, and geopolymer concrete (Sarkar et al., 2021; Mahdi et al., 2022). Pre-practical processing’s applicability is nevertheless limited by how time and energy-intensive it has become. Utilizing waste RHA without pre-processing will help promote cost-effective and environmentally responsible waste management. Furthermore, RHA, which was employed in earlier experiments, contains crystalline silica, which is less reactive. Due to the extended burning in the brick kilns, RHA from burned brick kilns has a significant amorphous silica concentration of 90%–97%, which is a necessary component for the manufacture of geopolymer concrete (Almalkawi et al., 2019). Therefore, it would be ideal to research using RHA from a brick kiln in the manufacture of geopolymer concrete for a variety of civil engineering applications in order to attain sustainability in infrastructure development. Figure 4 depicts the schematic view of the role of RHA in sustainable construction.
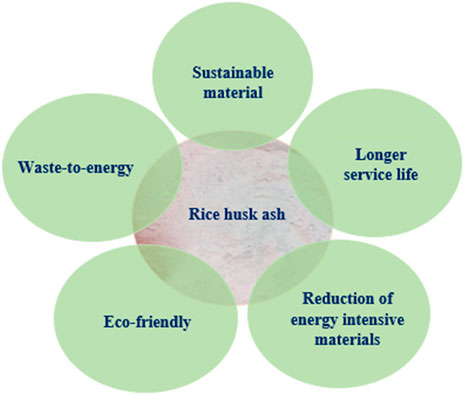
FIGURE 4. Schematic view of role of RHA in sustainable construction.
4 Materials and methods
Geopolymer mortar specimens were prepared for undertaking compressive strength tests and micro-structural analysis. Further, the compressive strength of geopolymer mortars prediction models was developed using ANN concepts and experimental datasets. Another series, geopolymer concrete specimens were prepared to evaluate the compressive strength behavior with varying precursor proportions. Further, sustainability evaluation was performed for 1 m3 geopolymer concrete.
In order to create the geopolymer mortar specimens, the aluminosilicate source materials, such as RHA, silica fume, and GGBS, were used. Both silica fume and GGBS, with surface areas of 16.5 and 0.52 kg/m2, were purchased from the neighborhood market. GGBS and silica fume have specific gravity of 2.85 and 2.4, respectively. Rice husk was utilized as a fuel in the brick factory, where RHA was gathered. It has a specific gravity and surface area of 0.99 and 0.036 kg/m2, respectively. RHA was a more readily available material at a lower cost than GGBS and silica fume. Figure 5 shows the raw materials’ microstructural graphs. The procedures applied for burning, processing, and grinding affect the microstructure of RHA (Endale et al., 2022). As a result, RHA particles are often amorphous, have micro-fragments with porous structures, and are extensively distributed (Figure 5A) (Endale et al., 2022). Table 1 lists the chemical composition of the binding materials.
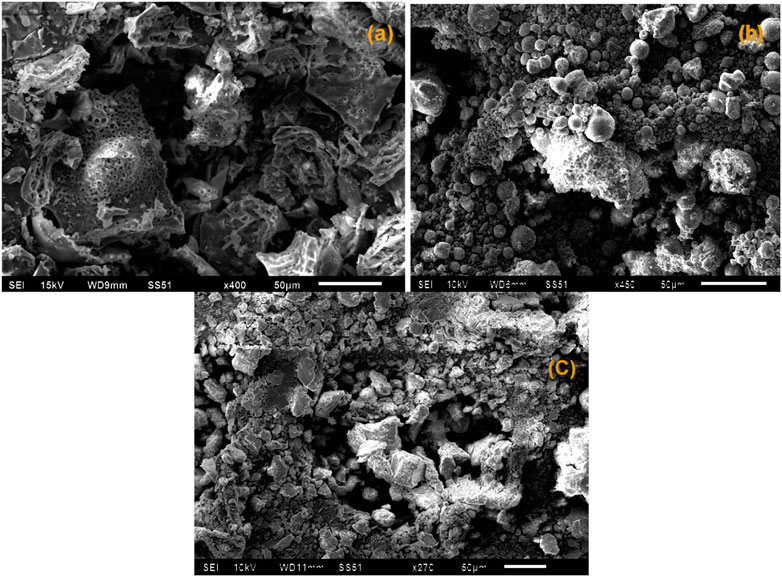
FIGURE 5. SEM micrographs; (A) RHA, (B) silica fume, and (C) GGBS.
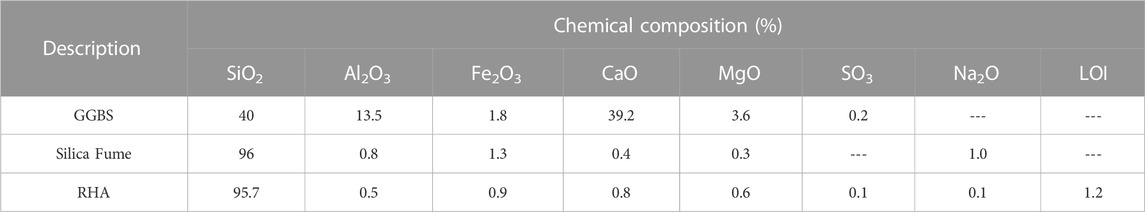
TABLE 1. Chemical composition of binders.
The sodium hydroxide (NaOH) and sodium silicate (Na2SiO3) gel were utilized for alkali-activation. Commercial-grade NaOH came in pellet form, was 99% pure and Na2SiO3 gel has a specific gravity of 1.53 gm/cc and 42% solid content.
4.1 Sample preparation and testing
Geopolymer mortar specimens were prepared based on the ratio of Na2SiO3/NaOH as 2.5 when three distinct molar concentrations of NaOH, including 8 (M), 11 (M), and 14 (M), were combined with the solution of Na2SiO3. Due to the lack of codal regulations governing the geopolymer mortar mixes, several trial mixes were made and tested before selecting the best geopolymer mortar mix (Yeddula and Karthiyaini, 2020). The precursor to sand ratio was kept as 1:3 (by weight). Additionally, the alkali-activator was varied as 16%, 18%, and 20% (by weight) to understand the effect of alkali-activator content on strength characteristics. Before adding the predetermined amount of alkali-activator and properly mixing it, sand and precursor were dried and mixed homogeneously. The blended mix was cast in the cube with each dimension 70.6 mm. After 1 day of casting, the mixed geopolymer mortar specimens were taken out of the mold and left to ambient curing until testing. A conventional Vicat equipment was employed to test the setting of geopolymer mortar specimens according to IS: 4031 (part 5). To measure the compressive strength at 28 days, an average of three specimens for every mix were tested under a compression testing apparatus, in accordance with IS 516:1959 (Sathawane et al., 2013). Cubes with each side 150 mm were used to obtain the compressive strength values after 28 days of curing at room temperature. The specimens were put under a 200-ton capacity compression testing apparatus.
Another series of geopolymer concrete specimens were prepared based on the 10 M of NaOH solution and Na2SiO3/NaOH as 2.5. During the current experiment, M40-grade geopolymer concrete was used. The mix proportions for M40 geopolymer concrete employing GGBS and silica fume were previously suggested (Das et al., 2020). In addition to the RHA concentration, silica fume and GGBS were changed in the binder. Table 2 summarizes the precise intended material quantities in accordance with replacement levels. The prepared concrete was immediately assessed for workability using the compression factor test in accordance with IS 1199–1959 (Laskar and Talukdar, 2017). For the compressive strength test, 150 mm-square cubes were cast. The mold was filled with three concrete layers, each measuring around 5 cm thick. Each mold was fully compacted using a vibrating table without dispersion or extreme laitance. Concrete in the mold was next troweled to an equal finish. For the flexural strength test, 500 × 100 × 100 mm prisms were cast (Das et al., 2020). Figure 6 indicates the geopolymer concrete sample preparation and testing for the compressive and flexural strengths.
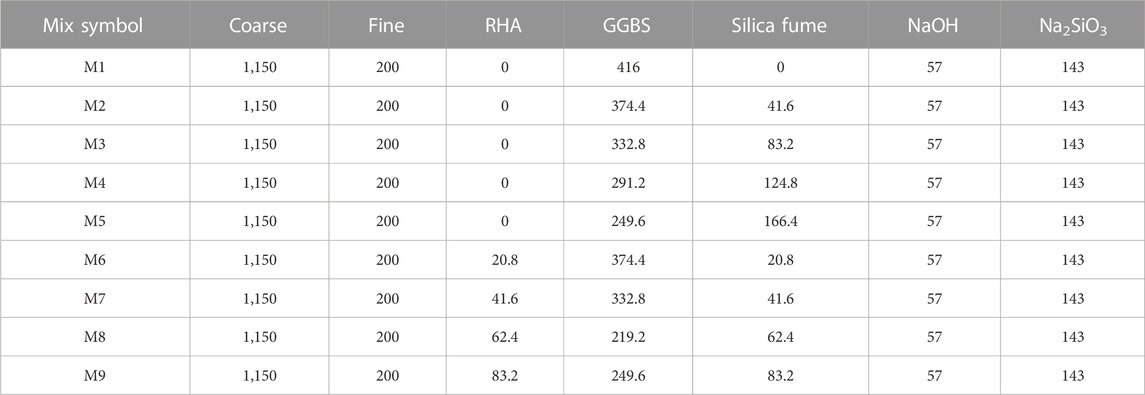
TABLE 2. Material proportions per 1 m3 geopolymer concrete.
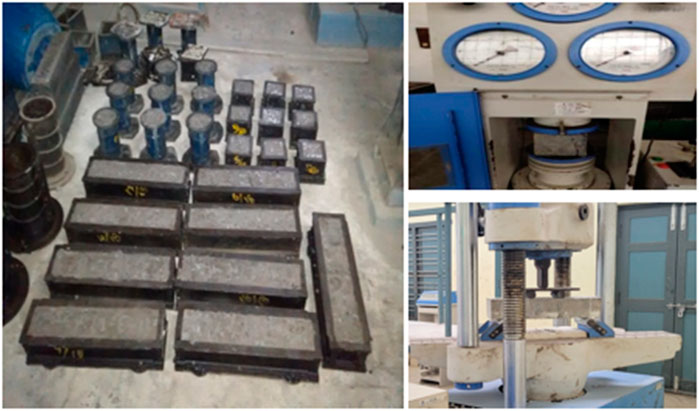
FIGURE 6. Geopolymer concrete samples and testing.
4.2 Dataset preparation
Based on the geopolymer mortar testing results, data were created to forecast the geopolymer mortars’ 28-day compressive strength. A dataset with 81 test samples is created (Table 3). The output variable in the dataset is the compressive strength of geopolymer mortar (O1). The input variables are RHA content (I1), GGBS content (I2), silica fume content (I3), the molarity of NaOH (I4), alkali activator content (I5), Na/Al (I6), and Si/Al (I7).
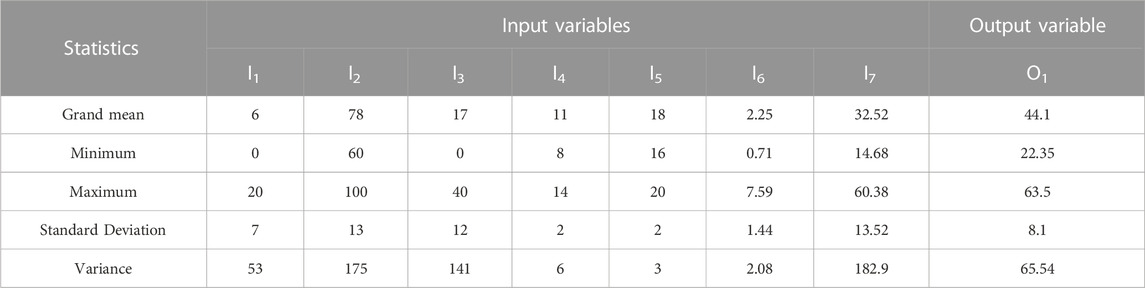
TABLE 3. Variation range of input and output variables.
The histogram plots of the input and output variables, as seen in Figure 7, also illustrate this change. The experimental dataset was trained to create multiple regression for the estimation method. The model’s generalizability was then tested using the randomized 30% of the data. The original data must be standardized before being entered into the regression model. The normalization process converts all the variables to the same scale, simplifying and strengthening the regression model. Figure 8 shows the normalized importance of the input variables.
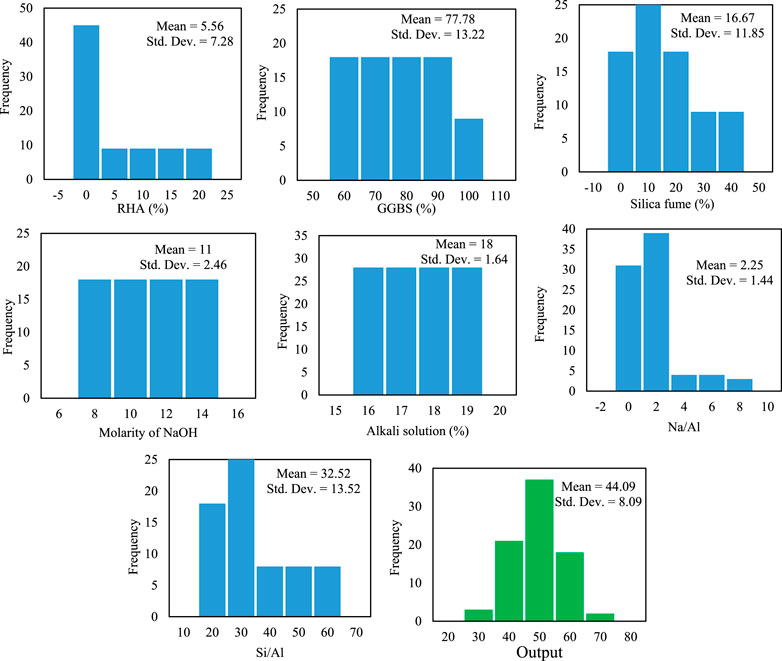
FIGURE 7. Histograms of input and output variables.
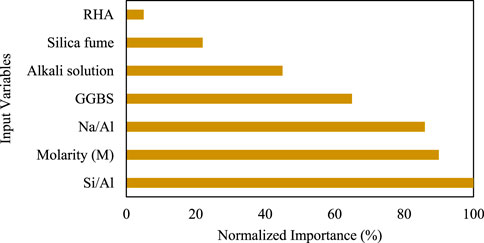
FIGURE 8. Normalized importance of input variables.
4.3 Principles of ANN
Because ANN models can frequently describe complicated systems with illogical or challenging behavioral principles or underlying processes, they are increasingly applied for predicting or simulating highly complex engineering variables. ANN is a non-linear modeling technique that can process many inputs (independent variables) to produce dependent output variables. For a variety of purposes, there are numerous varieties of neural networks in practice (Montavon et al., 2018). A popular ANN configuration that has been extensively employed in the discipline of civil engineering is linear regressions (Nagaraju et al., 2021a; Manzoor et al., 2021). This study assesses the effectiveness of ANNs for calculating the compressive strength of geopolymer mortars. The input, output, and middle (hidden) layers are the three primary levels of neurons that make up a neural network. Each neuron can have a different number of inputs and outputs (leading to the subsequent overlay or out of the network). A neuron computes its result using the weighted sum of its inputs based on a kernel function (Kohlbrenner et al., 2020).
In this investigation, a network with seven input variables (RHA content, GGBS content, silica fume content, the molarity of NaOH, alkali solution, Na/Al, and Si/Al), one output, and hidden layer with three processing neurons was used. For straightforward regression analysis, each input variable’s normalized or filtered values are introduced into the network by the modules in the input neurons. Then, these values are distributed to every unit in the hidden layer and compounded by a “weight” factor, usually unique for each network and whose size denotes the importance of specific connections.
4.4 Multiple polynomial regression analysis
A technique for examining linear correlations between predictor variables and multiple independent variables is multiple regression analysis. Since the independent variables influence the predictor variables in a regression analysis, data points can be established once the dependent variable’s validity is confirmed. Each parameter’s constant and extrapolation parameters are computed to explain how the variables relate to one another. Eq. 1 represents the standard multiple regression equation:
where n1, n2, ..., nn are the input variables, M is the predicted variable, and x and y are constant and coefficients, respectively. Moreover, e represents error. Using the correlation factor, R2, the method measures the reliability of the link between the predicted and input variables.
A predicted variable, intersection, and square terms make up the polynomial regression equation. This research makes an effort to evaluate the precision of the compressive strength of geopolymer mortars when applied to a response surface approach.
4.5 Swarm-assisted regression analysis
To predict the compressive strength of geopolymer mortars, nature-inspired particle swarm optimization (PSO) algorithm was utilized. The developed PSO model predicts the compressive strength by considering input variables. The developed model uses the PSO algorithm to optimize the output variable by considering weight factors and damping coefficients. To get a global solution, the novel PSO model’s performance is examined by varying inertia weight and damping factors. In general, executing PSO involves initializing the swarm particles with random location and zero velocity. Further, swarm particles search for the global best solution based on the objective function.
The PSO algorithm is effective, especially for predicting variables in the engineering domain (Xue, 2018; Nagaraju and Prasad, 2020; Nagaraju et al., 2021b). The algorithm works based on the principle of random food (particle) search by the fishes (iterations) in the pond (source). There are two sets to be considered for evaluating the model using PSO. These are input variables (set of experimental test data) and output variables. The chosen variables should be dependent and proportional for effective results. The input variables in the research were precursors contents (RHA, GGBS, and silica fume), molarity, alkali solution, Na/Al, and Si/Al. These input variables have been chosen in the previous studies to estimate soils (Dao et al., 2019; Nagaraju et al., 2020). In PSO, varying inertia weights can achieve the best convergent predictions. Further, to enhance the estimation models, damping factors play a vital role (Zaji and Bonakdari, 2014).
5 Results and discussion
5.1 Compressive and flexural strengths of geopolymer concrete
Depending on the precursors contents, data were gathered after all the cube tests were done and the compressive strengths of geopolymer concrete were compared. The information matched the three tested cubes’ average compressive strengths. Table 4 provides the 7-day and 28-day compressive strengths of geopolymer concrete with various concentrations of precursors (GGBS, silica fume, and RHA). M5, M6, M7, and M8 mixes had the highest compressive strengths, measuring 51.4, 50.8, 52.4, and 54.7 MPa, respectively at 28-day curing period. The mixes M1, M2, M3, and M9 had the lowest strengths, measuring 41.4, 44.5, 47.3, and 47.5 MPa, respectively at 28-day curing period. From Figure 9, it can be seen that early strengths were observed in the geopolymer concrete mixes blended with silica fume and GGBS than the mixes consisting of RHA. This could be due to the larger surface area of silica fume and GGBS contributing to effective earlier reactions than the blends having RHA.
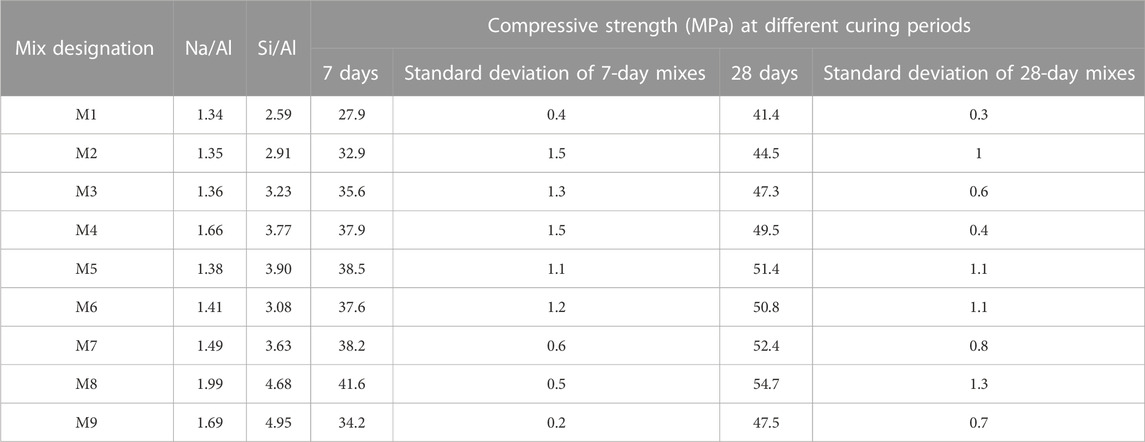
TABLE 4. Compressive strength of geopolymer concrete with varying precursors.
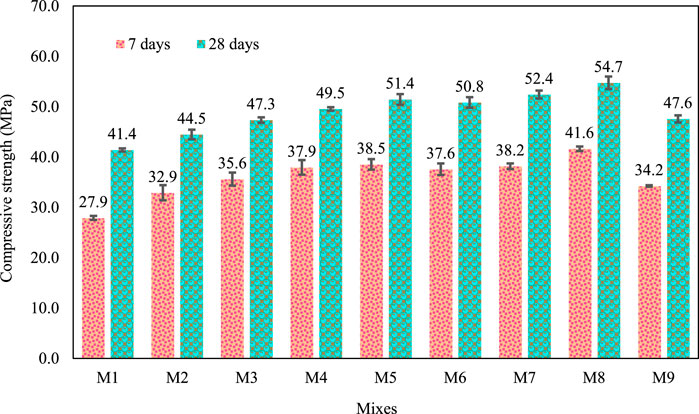
FIGURE 9. Compressive strength of geopolymer concrete mixes.
Despite its polymerization reaction, which used amorphous silicon to produce strong Na-Al-Si and abundant alumina in GGBS, geopolymer concrete mixtures generally had a higher compressive strength. Nevertheless, the polymerization stopped after the 15% RHA content (i.e., M9). The compressive strength increased with the addition of RHA because of the relatively higher Si/Al ratio and better fineness of RHA compared to GGBS, which increased the high surface area and enhanced reactions (Venkatesan and Pazhani, 2016). While the difference in solubility between GGBS and RHA was primarily responsible for the lower strength values exceeding 15% RHA, other factors also played a role (Mehta and Siddique, 2018). Additionally, more unreactive particles may serve as rigid fillers that cause microcracks in the matrix, leading to lower compressive strength results (Wang et al., 2022).
Figure 10 illustrates the variation of the flexural strength with the precursors contents. After 28 days, GGBS-based geopolymer concrete (M1) showed the flexural strengths of 4.85 MPa. The flexural strength increases as silica fume content in the GGBS-based geopolymer concrete mixture rises. The specimens blended with RHA had lower flexural strengths at the specified curing time. However, the silica fume and GGBS blended geopolymer concrete mixes had significantly increased strengths with adding silica fume and GGBS. This might result from the RHA mix’s low density owing to lower specific gravity of RHA, which leads to a weak link and failure between the mortar paste and aggregates (Abu Bakar et al., 2011; Hakeem et al., 2022).
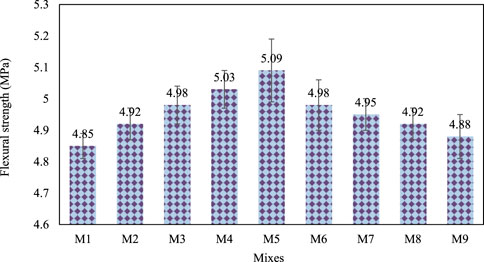
FIGURE 10. Flexural strength of geopolymer concrete mixes at 28 days.
5.2 Micro-structural analysis
Figures 11A–H depict the findings of the microstructures of geopolymer concrete mixes with varied precursors contents. As displayed in Figure 11A, the SEM micrographs taken in geopolymer concrete with GGBS alone revealed the uneven shape with traces of sharp needles. A geopolymer matrix was developed because the alkali-activator and Al in GGBS reacted chemically. Moreover, adding silica fume (rich in Si) to the geopolymer blend creates a dense network responsible for the higher strengths of geopolymer concrete (Figures 11B, C).
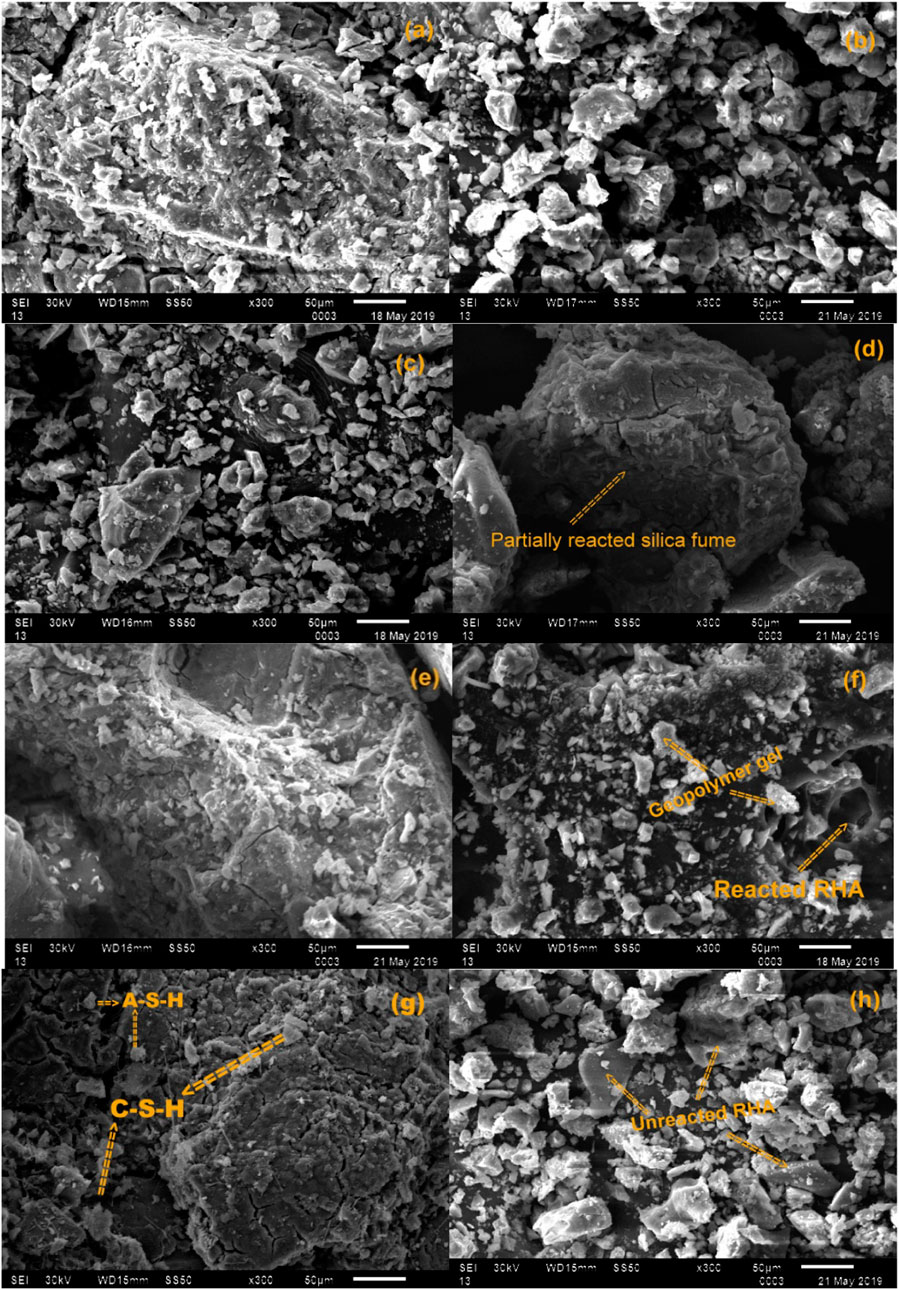
FIGURE 11. SEM micrographs; (A) M1, (B) M3, (C) M4, (D) M5, (E) M6, (F) M7, (G) M8, and (H) M9.
Additionally, the morphological study of this sample revealed adequate cohesion and a solid interface. The M7 SEM micrograph in Figure 11F is amorphously organized in spherical flakes with sharp RHA needles. The enhanced mechanical strength of M7 may be attributable to the leaching of Al and Si in the mixture caused by the reaction of the amorphous SiO2 in RHA and Al2O3 in GGBS with an alkaline activator. C-S-H and A-S-H gels can be seen in M8, primarily produced by activating the 15% RHA and its subsequent interaction with the 15% GGBS. Calcium alumina-silicate hydrate gel was created due to the mixture’s high calcium and alumina-silicate content (C-A-S-H). In order to modify the setting behavior of geopolymer gel, GGBS obtained more magnesium and contributed to a specific binding product.
Based on this sample’s morphological appearance, a superior interface was observed in the blends of M8 and M9. However, SEM micrograph in Figure 11H show the partially reacted and unreacted RHA particles. Instead of serving as a filler in the mixture, the unreacted particles cause the matrix’s strength to get stronger over time. Increased amounts of unreacted particles, especially light-weight RHA particles, have a detrimental effect on the strength development.
5.3 Geopolymers strength assessment using machine learning approaches
5.3.1 ANN analysis
This study presents neural forecasting models with one hidden layer, one output layer, and seven input layers. In general, connection weight adjustment is the process of the model’s training. The output weights were initially randomly selected and changed during the training phase. The mean square error (MSE) between the ANN output and the actual results was used to calculate the overall training outputs. The number of epochs is crucial for finding an ideal ANN structure with the highest accuracy. Ten thousand epochs are employed in this study’s training method; this amount was decided upon after doing trial-and-error experiments and striking a balance between the pace of error elimination and computation time. Consequently, 21,000 simulations were performed, each equivalent to one hidden layer. Table 5 lists the specific ANN parameters that were employed in this research.
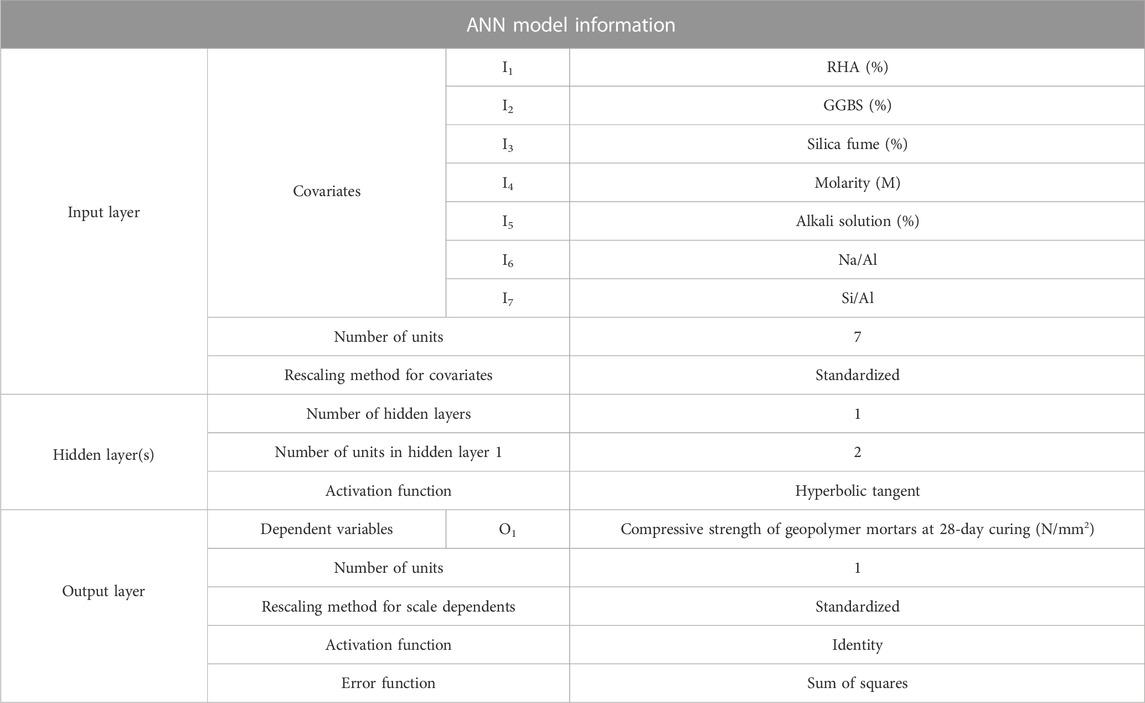
TABLE 5. Parameters used in ANN model.
The coefficient of determination (R2) was applied as the main determinant of the ANN models’ accuracy. The prediction accuracy between anticipated and actual values was utilized to evaluate the ANN outcomes. The fitter the model’s suggested regression models were, the closer the R2 values were to 1. The fitting models in the testing portion of the data were chosen as the primary criterion to assess the ANN model’s effectiveness in making predictions. The R2 inaccuracy for ANN testing is displayed in Table 6.
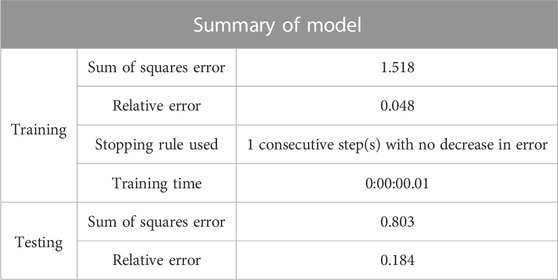
TABLE 6. Testing performance of model.
The model’s performance and forecast outcomes are reported in Table 6 and Figure 12, respectively. It is generally advised to use both R2 and RMSE simultaneously when choosing the appropriate network architectures for the geopolymer mortar compressive strength network, because the actual and predicted data series demonstrate a high correlation coefficient (R2 = 0.9328) of evaluation while there are quite a few prediction errors.
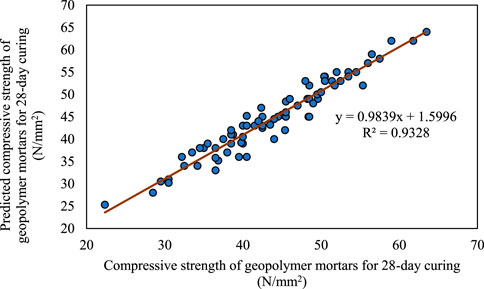
FIGURE 12. Actual and predicted geopolymer mortar strengths (N/mm2).
5.3.2 Multiple regression analysis
For the multiple polynomial regression analysis in this study, StatAdvisor was employed. The influential variables were included as inputs using a stepwise regression procedure. GGBS content (I2), silica fume content (I3), the molarity of NaOH (I4), alkali activator content (I5), Na/Al (I6), and Si/Al (I7) are the input variables. The validity of the generated model was assessed using R2 and the Durbin-Watson test. The output shows the outcomes of building a multivariate regression model to describe the link between the individual input and output factors. The estimated model’s equation is given by:
The p-value in the Anova test is less than 0.05, indicating a statistically positive relationship between the dependent variables at the 95.0% level of certainty. Tables 7, 8, regarding regression analysis information, were interpreted using the F-test and t-test at the 95.0% level of certainty. According to Table 7, the p-value is extremely low, suggesting that, at minimum, one of the model’s components is substantial with a level of certainty of 1P, practically 100%. Table 8 summarizes the T-static and p-values of the model.
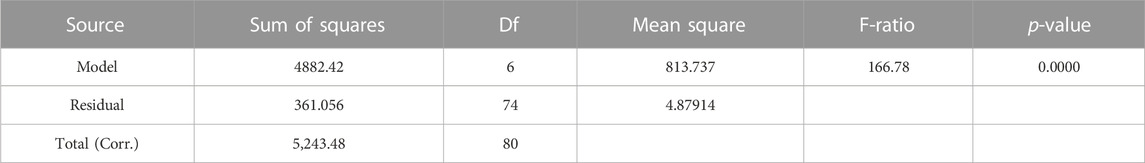
TABLE 7. ANOVA analysis of multi-variable regression model.
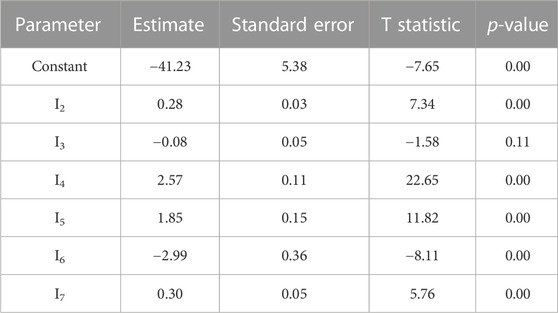
TABLE 8. Multi-variable regression model statistics.
According to the R2 statistic, the fitted model accounts for 93.11% of the output variability (O1). The corrected R2 value is 92.55%, making it better suited for comparing models with various amounts of independent variables. In accordance with the estimate’s standard error, the residuals’ standard deviation is 2.20. This value can be utilized by choosing the predictions option from the text menu to create prediction limits for brand-new observations. The average value of the residuals is the mean absolute error (MAE), which is 1.77. Based on the order in which the residuals appear in a data file, the Durbin-Watson statistic evaluates the residuals to see if there is any meaningful link. At the 95.0% confidence level, there is a hint of potential serial correlation, because the p-value is smaller than 0.05. Table 9 indicates the correlation matrix of the input variables. If the model is simplified, it should be noted that I2’s p-value, which is the highest among the independent variables, is 0.11. That term is not statistically significant at the 95.0% or higher confidence level, because the p-value is greater than or equal to 0.05.
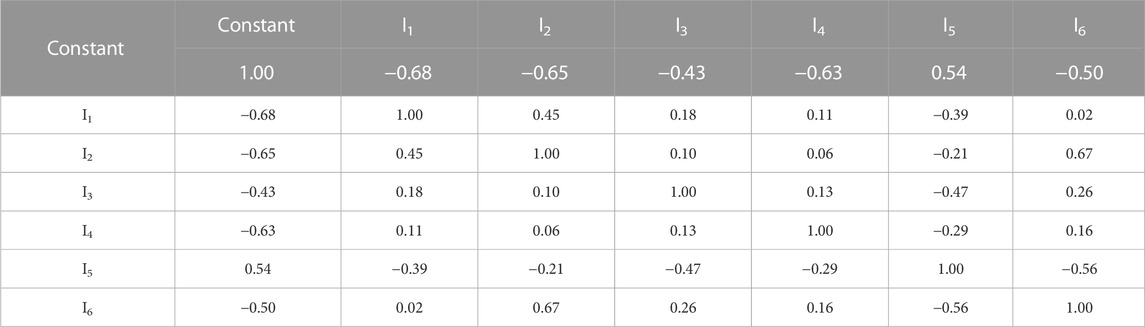
TABLE 9. Correlation matrix for coefficient estimates.
5.3.3 Swarm-assisted regression analysis
An optimization technique was utilized to determine the strength of geopolymer mortars to understand better the variables influencing the strength gain in these materials. The compressive strength of geopolymer mortars is evaluated using the particle swarm optimization (PSO) algorithm. According to the objective function considered herein, firstly, test data with seven variables such as RHA content (I1) GGBS content (I2), silica fume content (I3), the molarity of NaOH (I4), alkali activator content (I5), Na/Al (I6), and Si/Al (I7) were selected. They were mutating in the random iteration process. After ‘n’ number of iterations, the particle best fits with the global solution. The particle velocity and position changed with the selection of the objective function. The compressive strength (N/mm2) prediction of geopolymer mortars is according to Equation 3.
In Equation 3, n1, n2, n3, n4, n5, n6, and n7 are weighted coefficients for the effective search of particle position and velocity. Moreover, for the better performance of the particle search, additional inertia weight is considered as ‘a’. The functional equation with additional inertial weight is expressed in Equation 4.
From the prediction results, the following equations were formulated for the prediction of the compressive strength of geopolymer mortars with varying inertia weights of 0.3, 0.6, and 0.85, respectively.
Equations 5–7 were the best trails of the respective inertia weights varying 0.3, 0.6, and 0.85. Among them, the best estimation was obtained for the 0.3 and 0.6 inertia weights with an error of 4.43% (Figure 13A). Swarm-assisted particle multi-linear regression model is a reliable approach for predicting the compressive strength of geopolymer mortars with efficiency.
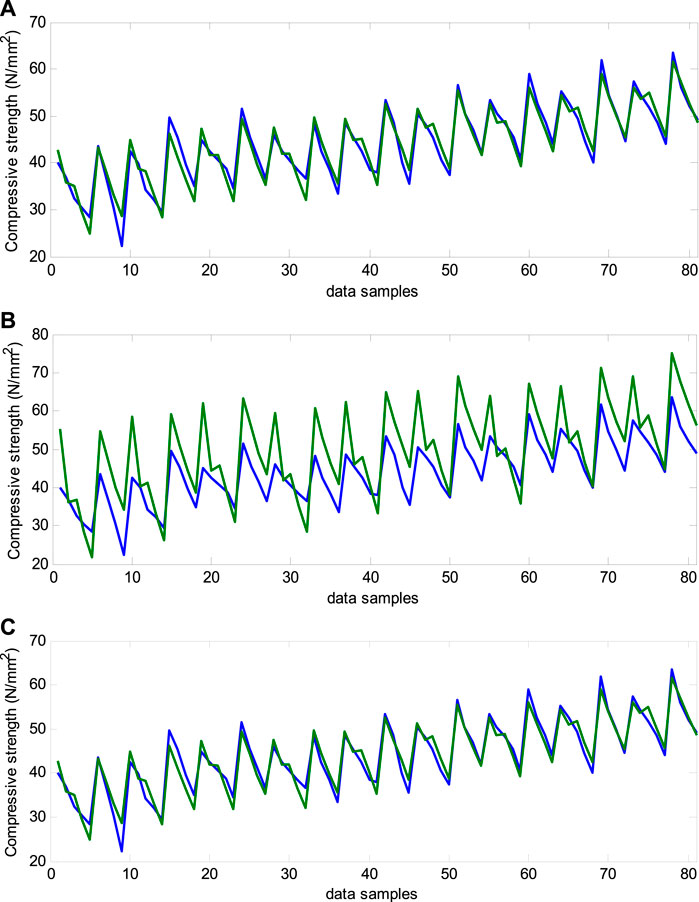
FIGURE 13. Actual and predicted values of compressive strength of geopolymer mortars with (A) W = 0.6, (B) W = 0.85, and (C) W = 0.85; and wdamp = 0.99.
In addition, for enhancing the function of the model, the addition of the damping factor could be helpful. The worst case prediction was found with an inertial weight of 0.85 having an error of 74% (Figure 13B). Keeping in this view, the damping coefficient is applied to the worst case and improved the prediction model with 95% convergent results.
Similarly, using damping factors, other inertia weights with higher error values can also be enhanced. Prediction models developed using PSO are desirable for estimation of the compressive strength of geopolymer mortars, also they are very closer to experimental values (Figure 13C). The model’s present performance indices are R2 = 0.942, 0.92, and 0.88, with inertia weights of 0.3, 0.6, and 0.85, respectively. The inertia weight 0.85 case model improves with an R2 value of 0.954 when the damping coefficient is added. The close results of performance measures in the training and testing phases confirm the models’ excellent reliability.
6 Sustainability assessment of geopolymer concrete
In the literature, various mix proportions for geopolymer concrete have been described (Li et al., 2019). The ratios of the mixture determine how the finished concrete performs mechanically, is durable, costs more money, uses energy, and produces emissions. The mix of proportional variables that can impact sustainability indices, including cost efficiency, eco-efficiency, and energy efficiency, are explained in this section. In terms of energy and emissions, the binder’s type and quantity can considerably influence it. To evaluate the performance based on sustainability, the geopolymer concrete’s cost-efficiency is significant. In comparison to other materials, RHA’s material cost was insignificant. It should be noted that using RHA at varying percentages in the mixes could change the compressive strength of geopolymer concrete. Using RHA in geopolymer concrete would also result in a cost reduction for geopolymer concrete. Based on the compressive strength-to-cost ratio, the cost-effectiveness of RHA blended geopolymer concrete was calculated (Kanagaraj et al., 2022). As previously noted, the materials utilized in this inquiry were acquired from local vendors. The cost of each material was computed and expressed in Indian rupees (INR) in accordance with the most recent delivery record. It was determined what the material costs would be for producing different mixtures of geopolymer concrete. Figure 14 provides the cost-effectiveness of each combination (M1 to M9). Compared to other mixes combined with silica fume and GGBS, geopolymer concrete using RHA as a blend is more cost-effective, particularly M8.
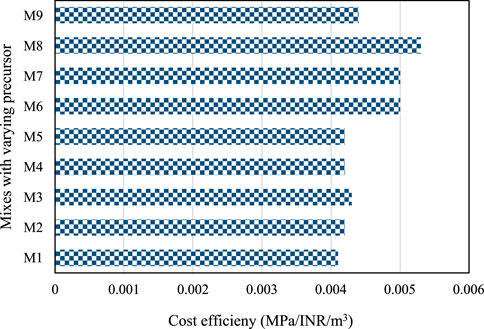
FIGURE 14. Cost efficiency of geopolymer concrete mixes with varying precursors.
Energy efficiency measures how much energy is consumed while making concrete. It starts with creating the raw materials for concrete and ends with placing concrete. According to estimates by Alsalman et al. (2021), the energy needed to produce components of concrete like coarse aggregate, GGBS, silica fume, NaOH, and Na2SiO3 is 0.083, 0.857, 0.036, 20.5, and 5.371 GJ/t, respectively.
The energy necessary for producing geopolymer concrete is determined using the energy index factor. Only the materials utilized in the current experiment are considered for calculating energy factor values. Because RHA is one of the waste materials and fine aggregates are river sand, so, the energy index component for RHA and fine aggregate is not considered in the current analysis. 2.318 GJ/m3 and 2.222 GJ/m3 are estimated to be the total energy needed to produce 1 m3 of RHA blended geopolymer concrete M7 and M8, compared to 2.251 GJ/m3 for M5 of geopolymer concrete that has been combined with silica fume and GGBS. In particular, geopolymer concrete blended with silica fume (M5 - 40% silica fume) exhibits lower energy efficiency than geopolymer concrete blended with RHA (M7 and M9). However, considering both cost efficiency and eco-efficiency, RHA mixes are more sustainable than geopolymer concrete blended with silica fume. Figure 15 demonstrates the energy needed to produce different mixtures of geopolymer concrete.
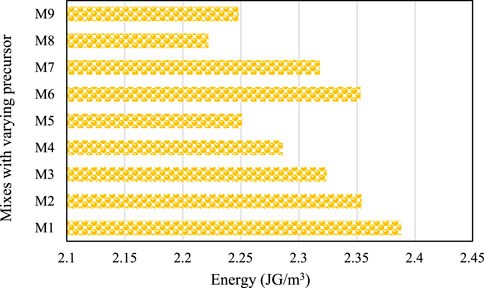
FIGURE 15. Energy efficiency with varying precursors.
Because of increased energy use, as was discussed in the preceding section (such as petroleum goods, coal, explosives, etc.), more CO2 is emitted into the environment (Shahbaz et al., 2015). Concrete made of regular Portland cement emits more carbon dioxide than geopolymer concrete, which is a more environmentally friendly option (Kanagaraj et al., 2022). In coarse aggregate manufacturing, CO2 emissions are predicted to be 0.0048 t-CO2/t, while producing one ton of ordinary Portland cement concrete generates 0.84 t-CO2/t (Alsalman et al., 2021). A ton of alkali activators, such as NaOH and Na2SiO3, is projected to emit 1.915 and 1.222 t-CO2/t, respectively. Following CO2 emissions are projected as a result of the analysis. According to different precursor percentage estimates, the total CO2 emissions for manufacturing 1 m3 of geopolymer concrete are depicted in Figure 16. Compared to all the mixes in this investigation, 15% RHA in the geopolymer blend (i.e., M8) emits less CO2. Based on the overall indices, M8 can be considered a sustainable high-performance material.
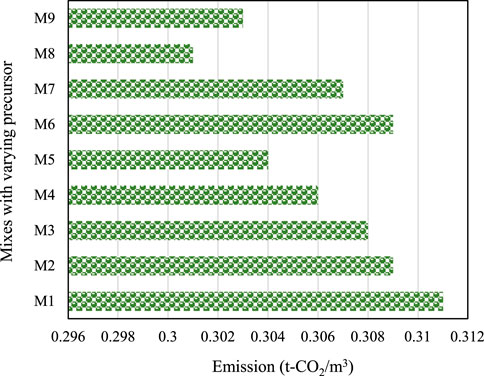
FIGURE 16. Carbon emissions with varying precursors.
7 Conclusion
This study compared the strength and sustainability performances of geopolymer mixtures with various dosages of precursor content. The following conclusions were drawn from the foregoing research.
• There is a rising need for novel materials with low CO2 emissions associated with their manufacture for various applications. Therefore, geopolymer concrete might be used as a replacement for OPC with only proper selection of potential precursor in geopolymer concrete.
• At 28 days after curing, materials containing 5%, 10%, and 15% RHA added to silica fume and GGBS geopolymer blends showed enhanced compressive strength. However, when the RHA content increased more than 15%, the compressive strength decreased.
• The leaching of Al and Si in the combination generated by the reaction of the amorphous SiO2 in RHA and Al2O3 in GGBS with an alkaline activator, was evident in the microstructural features of the geopolymer blends with RHA.
• In the structure of the binder matrix, C-S-H and A-S-H form strong adhesion zones between the newly generated phases and unreacted particles.
• The strength behavior of geopolymer mortars may reliably be predicted using ANN, MPR, and swarm-assisted regression models. Compared to the MPR and ANN model’s R2 values of 0.925 and 0.9328, the PSO model performs better with a high R2 value of 0.954.
• According to the sustainability findings, geopolymer concrete mixes containing 15% and 20% RHA performed better than those containing GGBS and silica fume. It has been proven that such mixtures can be recommended for structural elements, the construction of buildings, or as a sustainable alternative to materials with a high carbon footprint.
• For setting the precursor content, the study advises relying on sustainability indicators and strength attributes. This approach improves the potential selection of geopolymer concrete mixes, prevents the overdosage of precursor content, and, in the end, reduces the project’s overall cost.
8 Recommendations
In geopolymer concrete, RHA showed exceptional performance with improved strength and microstructural and sustainability performances. Using other agricultural by-products, including bagasse ash and corncob ash in geopolymer concrete, should be the subject of future study. Additionally, durability studies are required to understand how concrete performs in various environments. Finally, in order to estimate the compressive strength more accurately, soft computing models with additional input variables like surface area and specific gravity should be developed.
Data availability statement
The original contributions presented in the study are included in the article/supplementary material, further inquiries can be directed to the corresponding author.
Author contributions
TVN: Conceptualization, Methodology, Investigation, Validation, Writing—original draft preparation. AB: Conceptualization, Methodology, Investigation, Validation, Formal analysis, Writing—original draft preparation, Writing—review and editing. MA: Methodology, Writing—original draft preparation, Validation. SN: Methodology, Writing—original draft preparation, Validation. All authors have read and agreed to the published version of the manuscript.
Conflict of interest
The authors declare that the research was conducted in the absence of any commercial or financial relationships that could be construed as a potential conflict of interest.
Publisher’s note
All claims expressed in this article are solely those of the authors and do not necessarily represent those of their affiliated organizations, or those of the publisher, the editors and the reviewers. Any product that may be evaluated in this article, or claim that may be made by its manufacturer, is not guaranteed or endorsed by the publisher.
References
Abu Bakar, B. H., Ramadhansyah, P. J., and Megat Azmi, M. J. (2011). Effect of rice husk ash fineness on the chemical and physical properties of concrete. Mag. Concr. Res. 63 (5), 313–320.
Al Bakria, A. M., Kamarudin, H., BinHussain, M., Nizar, I. K., Zarina, Y., and Rafiza, A. R. (2011). The effect of curing temperature on physical and chemical properties of geopolymers. Phys. Procedia 22, 286–291.
Almalkawi, A. T., Balchandra, A., and Soroushian, P. (2019). Potential of using industrial wastes for production of geopolymer binder as green construction materials. Constr. Build. Mater. 220, 516–524. doi:10.1016/j.conbuildmat.2019.06.054
Alsalman, A., Assi, L. N., Kareem, R. S., Carter, K., and Ziehl, P. (2021). Energy and CO2 emission assessments of alkali-activated concrete and ordinary portland cement concrete: A comparative analysis of different grades of concrete. Clean. Environ. Syst. 3, 100047. doi:10.1016/j.cesys.2021.100047
Amran, Y. M., Alyousef, R., Alabduljabbar, H., and El-Zeadani, M. (2020). Clean production and properties of geopolymer concrete; A review. J. Clean. Prod. 251, 119679. doi:10.1016/j.jclepro.2019.119679
Azad, N. M., and Samarakoon, S. S. M. (2021). Utilization of industrial by-products/waste to manufacture geopolymer cement/concrete. Sustainability 13 (2), 873. doi:10.3390/su13020873
Bernal, S. A., Rodríguez, E. D., Mejia de Gutiérrez, R., Provis, J. L., and Delvasto, S. (2012). Activation of metakaolin/slag blends using alkaline solutions based on chemically modified silica fume and rice husk ash. Waste Biomass Valorization 3 (1), 99–108. doi:10.1007/s12649-011-9093-3
Bondar, D., Lynsdale, C. J., Milestone, N. B., Hassani, N., and Ramezanianpour, A. A. (2011). Effect of adding mineral additives to alkali-activated natural pozzolan paste. Constr. Build. Mater. 25 (6), 2906–2910. doi:10.1016/j.conbuildmat.2010.12.031
Bumanis, G., Vitola, L., Stipniece, L., Locs, J., Korjakins, A., and Bajare, D. (2020). Evaluation of industrial by-products as pozzolans: A road map for use in concrete production. Case Stud. Constr. Mater. 13, e00424. doi:10.1016/j.cscm.2020.e00424
Chen, K., Wu, D., Xia, L., Cai, Q., and Zhang, Z. (2021). Geopolymer concrete durability subjected to aggressive environments–A review of influence factors and comparison with ordinary Portland cement. Constr. Build. Mater. 279, 122496. doi:10.1016/j.conbuildmat.2021.122496
Dao, D. V., Ly, H. B., Trinh, S. H., Le, T. T., and Pham, B. T. (2019). Artificial intelligence approaches for prediction of compressive strength of geopolymer concrete. Materials 12 (6), 983. doi:10.3390/ma12060983
Das, S. K., Singh, S. K., Mishra, J., and Mustakim, S. M. (2020). Effect of rice husk ash and silica fume as strength-enhancing materials on properties of modern concrete—A comprehensive review. Emerg. Trends Civ. Eng., 253–266.
Davidovits, J. (1994). Properties of geopolymer cements, 1. Kiev, Ukraine: Kiev State Technical University, 131–149.First Int. Conf. alkaline Cem. Concr.
Dembovska, L., Bajare, D., Pundiene, I., and Vitola, L. (2017). Effect of pozzolanic additives on the strength development of high-performance concrete. Procedia Eng. 172, 202–210. doi:10.1016/j.proeng.2017.02.050
Dinakar, P., Babu, K. G., and Santhanam, M. (2008). Durability properties of high volume fly ash self-compacting concretes. Cem. Concr. Compos. 30 (10), 880–886. doi:10.1016/j.cemconcomp.2008.06.011
Divvala, S., and M., S. R. (2021). Early strength properties of geopolymer concrete composites: An experimental study. Mater. Today Proc. 47, 3770–3777. doi:10.1016/j.matpr.2021.03.002
Dutta, A., Patra, A., Hazra, K. K., Nath, C. P., Kumar, N., and Rakshit, A. (2022). A state of the art review in crop residue burning in India: Previous knowledge, present circumstances and future strategies. Environmental Challenges 8, 100581. doi:10.1016/j.envc.2022.100581
Endale, S. A., Taffese, W. Z., Vo, D. H., and Yehualaw, M. D. (2022). Rice husk ash in concrete. Sustainability 15 (1), 137. doi:10.3390/su15010137
Guttikunda, S. K., Goel, R., and Pant, P. (2014). Nature of air pollution, emission sources, and management in the Indian cities. Atmos. Environ. 95, 501–510. doi:10.1016/j.atmosenv.2014.07.006
Hakeem, I. Y., Althoey, F., and Hosen, A. (2022). Mechanical and durability performance of ultra-high-performance concrete incorporating SCMs. Constr. Build. Mater. 359, 129430. doi:10.1016/j.conbuildmat.2022.129430
Hall, C. (1976). On the history of Portland cement after 150 years. J. Chem. Educ. 53 (4), 222. doi:10.1021/ed053p222
Jain, N., Sehgal, V. K., Singh, S., and Kaushik, N. (2018), Estimation of surplus crop residue in India for biofuel production. Technology information, forecasting and assessment council (TIFAC). New Delhi.
Jittin, V., Bahurudeen, A., and Ajinkya, S. D. (2020). Utilisation of rice husk ash for cleaner production of different construction products. J. Clean. Prod. 263, 121578. doi:10.1016/j.jclepro.2020.121578
Joseph, B., and Mathew, G. (2012). Influence of aggregate content on the behavior of fly ash based geopolymer concrete. Sci. Iran. 19 (5), 1188–1194. doi:10.1016/j.scient.2012.07.006
Kanagaraj, B., Anand, N., Alengaram, U. J., Raj, R. S., and Kiran, T. (2022). Exemplification of sustainable sodium silicate waste sediments as coarse aggregates in the performance evaluation of geopolymer concrete. Constr. Build. Mater. 330, 127135. doi:10.1016/j.conbuildmat.2022.127135
Kashani, A., Ngo, T. D., and Mendis, P. (2019). The effects of precursors on rheology and self-compactness of geopolymer concrete. Mag. Concr. Res. 71 (11), 557–566. doi:10.1680/jmacr.17.00495
Kaygusuz, K. (2012). Energy for sustainable development: A case of developing countries. Renew. Sustain. Energy Rev. 16 (2), 1116–1126. doi:10.1016/j.rser.2011.11.013
Kohlbrenner, M., Bauer, A., Nakajima, S., Binder, A., Samek, W., and Lapuschkin, S. (2020). “Towards best practice in explaining neural network decisions with LRP,” in 2020 International Joint Conference on Neural Networks (IJCNN) (IEEE), 1–7.In
Kong, D. L., and Sanjayan, J. G. (2010). Effect of elevated temperatures on geopolymer paste, mortar and concrete. Cem. Concr. Res. 40 (2), 334–339. doi:10.1016/j.cemconres.2009.10.017
Laskar, S. M., and Talukdar, S. (2017). Preparation and tests for workability, compressive and bond strength of ultra-fine slag based geopolymer as concrete repairing agent. Constr. Build. Mater. 154, 176–190. doi:10.1016/j.conbuildmat.2017.07.187
Li, N., Shi, C., Zhang, Z., Wang, H., and Liu, Y. (2019). A review on mixture design methods for geopolymer concrete. Composites Part B:. Engineering 178, 107490. doi:10.1016/j.compositesb.2019.107490
Liew, K. M., Sojobi, A. O., and Zhang, L. W. (2017). Green concrete: Prospects and challenges. Constr. Build. Mater. 156, 1063–1095. doi:10.1016/j.conbuildmat.2017.09.008
Liu, J., Doh, J. H., Dinh, H. L., Ong, D. E., Zi, G., and You, I. (2022). Effect of Si/Al molar ratio on the strength behavior of geopolymer derived from various industrial waste: A current state of the art review. Constr. Build. Mater. 329, 127134. doi:10.1016/j.conbuildmat.2022.127134
Liu, J., Li, X., Lu, Y., and Bai, X. (2020). Effects of Na/Al ratio on mechanical properties and microstructure of red mud-coal metakaolin geopolymer. Constr. Build. Mater. 263, 120653. doi:10.1016/j.conbuildmat.2020.120653
Luan, C., Shi, X., Zhang, K., Utashev, N., Yang, F., Dai, J., et al. (2021). A mix design method of fly ash geopolymer concrete based on factors analysis. Constr. Build. Mater. 272, 121612. doi:10.1016/j.conbuildmat.2020.121612
Ma, C. K., Awang, A. Z., and Omar, W. (2018). Structural and material performance of geopolymer concrete: A review. Constr. Build. Mater. 186, 90–102. doi:10.1016/j.conbuildmat.2018.07.111
Madheswaran, C. K., Gnanasundar, G., and Gopalakrishnan, N. (2013). Effect of molarity in geopolymer concrete. Int. J. Civ. Struct. Eng. 4 (2), 106–115.
Mahdi, S. N., Hossiney, N., and Abdullah, M. M. A. B. (2022). Strength and durability properties of geopolymer paver blocks made with fly ash and brick kiln rice husk ash. Case Stud. Constr. Mater. 16, e00800. doi:10.1016/j.cscm.2021.e00800e00800
Manzoor, B., Othman, I., Durdyev, S., Ismail, S., and Wahab, M. H. (2021). Influence of artificial intelligence in civil engineering toward sustainable development—A systematic literature review. Appl. Syst. Innov. 4 (3), 52. doi:10.3390/asi4030052
McLellan, B. C., Williams, R. P., Lay, J., Van Riessen, A., and Corder, G. D. (2011). Costs and carbon emissions for geopolymer pastes in comparison to ordinary portland cement. J. Clean. Prod. 19 (9-10), 1080–1090. doi:10.1016/j.jclepro.2011.02.010
Mehta, A., and Siddique, R. (2018). Sustainable geopolymer concrete using ground granulated blast furnace slag and rice husk ash: Strength and permeability properties. J. Clean. Prod. 205, 49–57. doi:10.1016/j.jclepro.2018.08.313
Mohanty, A. K., Misra, M., and Drzal, L. T. (2002). Sustainable bio-composites from renewable resources: Opportunities and challenges in the green materials world. J. Polym. Environ. 10 (1), 19–26. doi:10.1023/a:1021013921916
Montavon, G., Samek, W., and Müller, K. R. (2018). Methods for interpreting and understanding deep neural networks. Digit. signal Process. 73, 1–15. doi:10.1016/j.dsp.2017.10.011
Nagaraju, T. V., Gobinath, R., Awoyera, P., and Abdy Sayyed, M. A. H. (2021a). “Prediction of California bearing ratio of subgrade soils using artificial neural network principles,” in Communication and intelligent systems (Singapore: Springer), 133–146.
Nagaraju, T. V., Prasad, C., Chaudhary, B., and Sunil, B. M. (2021b). “Assessment of seismic liquefaction of soils using swarm-assisted optimization algorithm,” in Local site effects and ground failures (Singapore: Springer), 295–304.
Nagaraju, T. V., and Prasad, C. D. (2020). “New prediction models for compressive strength of GGBS-based geopolymer clays using swarm assisted optimization,” in Advances in computer methods and geomechanics (Singapore: Springer), 367–379.
Nagaraju, T. V., Prasad, C. D., and Murthy, N. G. K. (2020). “Invasive weed optimization algorithm for prediction of compression index of lime-treated expansive clays,” in Soft computing for problem solving (Singapore: Springer), 317–324.
Nazari, A., Bagheri, A., Sanjayan, J., Yadav, P. N., and Tariq, H. (2019). A comparative study of void distribution pattern on the strength development between OPC-based and geopolymer concrete. Adv. Mater. Sci. Eng. 2019, 1–7. doi:10.1155/2019/1412757
Oderji, S. Y., Chen, B., and Jaffar, S. T. A. (2017). Effects of relative humidity on the properties of fly ash-based geopolymers. Constr. Build. Mater. 153, 268–273. doi:10.1016/j.conbuildmat.2017.07.115
Rajamma, R., Labrincha, J. A., and Ferreira, V. M. (2012). Alkali activation of biomass fly ash–metakaolin blends. Fuel 98, 265–271. doi:10.1016/j.fuel.2012.04.006
Ryu, G. S., Lee, Y. B., Koh, K. T., and Chung, Y. S. (2013). The mechanical properties of fly ash-based geopolymer concrete with alkaline activators. Constr. Build. Mater. 47, 409–418. doi:10.1016/j.conbuildmat.2013.05.069
Sangeet, R., and Kumar, R. (2020). Turning crop waste into wealth-sustainable and economical solutions. Handb. solid waste Manag.: sustainability through circular economy, 1–32.
Sarkar, J., Mridha, D., Sarkar, J., Orasugh, J. T., Gangopadhyay, B., Chattopadhyay, D., et al. (2021). Synthesis of nanosilica from agricultural wastes and its multifaceted applications: A review. Biocatal. Agric. Biotechnol. 37, 102175. doi:10.1016/j.bcab.2021.102175
Sathawane, S. H., Vairagade, V. S., and Kene, K. S. (2013). Combine effect of rice husk ash and fly ash on concrete by 30% cement replacement. Procedia Eng. 51, 35–44. doi:10.1016/j.proeng.2013.01.009
Shahbaz, M., Mallick, H., Mahalik, M. K., and Loganathan, N. (2015). Does globalization impede environmental quality in India? Ecol. Indic. 52, 379–393. doi:10.1016/j.ecolind.2014.12.025
Singh, B., Ishwarya, G., Gupta, M., and Bhattacharyya, S. K. (2015). Geopolymer concrete: A review of some recent developments. Constr. Build. Mater. 85, 78–90. doi:10.1016/j.conbuildmat.2015.03.036
Singh, K. (2021). Experimental study on metakolin and baggashe ash based geopolymer concrete. Mater. Today Proc. 37, 3289–3295. doi:10.1016/j.matpr.2020.09.116
Srivastav, A. L., Dhyani, R., Ranjan, M., Madhav, S., and Sillanpää, M. (2021). Climate-resilient strategies for sustainable management of water resources and agriculture. Environ. Sci. Pollut. Res. 28 (31), 41576–41595. doi:10.1007/s11356-021-14332-4
Turner, L. K., and Collins, F. G. (2013). Carbon dioxide equivalent (CO2-e) emissions: A comparison between geopolymer and OPC cement concrete. Constr. Build. Mater. 43, 125–130. doi:10.1016/j.conbuildmat.2013.01.023
Venkatesan, R. P., and Pazhani, K. C. (2016). Strength and durability properties of geopolymer concrete made with ground granulated blast furnace slag and black rice husk ash. KSCE J. Civ. Eng. 20 (6), 2384–2391. doi:10.1007/s12205-015-0564-0
Vora, P. R., and Dave, U. V. (2013). Parametric studies on compressive strength of geopolymer concrete. Procedia Eng. 51, 210–219. doi:10.1016/j.proeng.2013.01.030
Wang, F., Sun, X., Tao, Z., and Pan, Z. (2022). Effect of silica fume on compressive strength of ultra-high-performance concrete made of calcium aluminate cement/fly ash based geopolymer. J. Build. Eng. 62, 105398. doi:10.1016/j.jobe.2022.105398
Wang, H., Wu, H., Xing, Z., Wang, R., and Dai, S. (2021). The effect of various Si/Al, Na/Al molar ratios and free water on micromorphology and macro-strength of metakaolin-based geopolymer. Materials 14 (14), 3845. doi:10.3390/ma14143845
Wang, J., Xie, J., Wang, C., Zhao, J., Liu, F., and Fang, C. (2020). Study on the optimum initial curing condition for fly ash and GGBS based geopolymer recycled aggregate concrete. Constr. Build. Mater. 247, 118540. doi:10.1016/j.conbuildmat.2020.118540
Xue, X. (2018). Evaluation of concrete compressive strength based on an improved PSO-LSSVM model. Comput. Concr. 21 (5), 505–511.
Yeddula, B. S. R., and Karthiyaini, S. (2020). Experimental investigations and GEP modelling of compressive strength of ferrosialate based geopolymer mortars. Constr. Build. Mater. 236, 117602. doi:10.1016/j.conbuildmat.2019.117602
Keywords: geopolymer concrete, sustainable material, soft computing, energy-efficiency, waste-to-energy
Citation: Nagaraju TV, Bahrami A, Azab M and Naskar S (2023) Development of sustainable high performance geopolymer concrete and mortar using agricultural biomass—A strength performance and sustainability analysis. Front. Mater. 10:1128095. doi: 10.3389/fmats.2023.1128095
Received: 20 December 2022; Accepted: 16 January 2023;
Published: 07 March 2023.
Edited by:
Jing Yu, Sun Yat-sen University, ChinaReviewed by:
Dhanada Kanta Mishra, Biju Patnaik University of Technology, IndiaJihui Zhao, Sun Yat-sen University, China
Copyright © 2023 Nagaraju, Bahrami, Azab and Naskar. This is an open-access article distributed under the terms of the Creative Commons Attribution License (CC BY). The use, distribution or reproduction in other forums is permitted, provided the original author(s) and the copyright owner(s) are credited and that the original publication in this journal is cited, in accordance with accepted academic practice. No use, distribution or reproduction is permitted which does not comply with these terms.
*Correspondence: Alireza Bahrami, QWxpcmV6YS5CYWhyYW1pQGhpZy5zZQ==