 Sajjad Ali Khan1
 Salman Habib2*
 Muhammad Yasir Ali Khan3Sohaib Tahir Chauhdary4
 Abdar Ali5
 Salah Kamel6
 Mohamed F. Elnaggar7,8*
- 1Department of Electrical and Computer Engineering, COMSATS University Islamabad, Abbottabad, Pakistan
- 2Department of Electrical and Electronic Engineering, Southern University of Science and Technology, Shenzhen, China
- 3College of Energy and Electrical Engineering, Hohai University, Nanjing, China
- 4Department of Electrical and Computer Engineering, College of Engineering, Dhofar University, Salalah, Oman
- 5School of Electronic, Information and Electrical Engineering, Shanghai Jiao Tong University, Shanghai, China
- 6Department of Electrical Engineering, Faculty of Engineering, Aswan University, Aswan, Egypt
- 7Department of Electrical Engineering, College of Engineering, Prince Sattam Bin Abdulaziz University, Al-Kharj, Saudi Arabia
- 8Department of Electrical Power and Machines Engineering, Faculty of Engineering, Helwan University, Hewlan, Egypt
Sulphur hexafluoride (SF6) gas is the frequently consumed gas in High Voltage (HV) applications due to its high dielectric permittivity and arc-quenching property. However, due to its long Atmospheric Lifetime (AL), high Global Warming Potential (GWP), and other environmental concerns there is a need for a new sustainable gas as an alternative to SF6. Therefore, in this research, we present dichlorodifluoromethane (R-12) in conjunction with carbon dioxide (CO2) as an alternative. Compared to SF6, R-12 has 3,100 years shorter atmospheric lifetime and 15,400 less GWP. Moreover, CO2 is mixed with R-12 as a gas carrier to achieve a low boiling point as that of SF6. High Voltage Direct Current (HVDC), High Voltage Alternating Current (HVAC), and self-recoverability tests were conducted under varying concentrations of gas ratios at different pressures and a standard constant temperature. Comparison analysis showed that R-12 dielectric strength is close to that of SF6, and its mixture with CO2 possessed increased dielectric strength compared to a nitrogen and air mixture beyond 206.84 kPa. For HVAC and HVDC, a mixture of 50% R-12% and 50% CO2 establishes an unimpeachable ratio for HV applications. The mixture has self-recoverability properties and possesses positive synergism, which leads to the conclusion that the mixture of R-12 with CO2 enhances the dielectric strength compared to pure gases, as well as reduces costs.
1 Introduction
Dielectric gas is one of the most important parts of an HV grid station. SF6 gas has been used as a dielectric in Gas Circuit Breakers (GCB), Gas Insulated Transmission Lines (GIL), and Gas Insulated Switches (GIS) since 1960 (Beroual et al., 2018). This gas possesses all the desirable properties that an ideal dielectric substance must possess. It is a colorless, electronegative gas with arc-quenching properties, current interruption properties, low electromagnetic radiation, and high thermal stability (Khan et al., 2018).
Although SF6 exhibits very good dielectric properties, there are also some adverse effects, such as its long AL and high GWP. As compared to the GWP of CO2 (considered as a reference), the GWP of SF6 is 32,600 (Forster et al., 2007). Moreover, the longer SF6 gas stays in the atmosphere, its adverse effect on the environment becomes more significant: if it stays in the air for 30 years then its GWP is 16,300, for 100 years then the GWP would increase to 22,800, and for 500 years the GWP will be 32,600 (Forster et al., 2007). Hence, its existence in the atmosphere for longer durations makes it even worse for a sustainable environment. The concentration of SF6 in the environment has increased to 20% from 2010 to 2015 as shown in Figure 1 (Jiang et al., 2021).
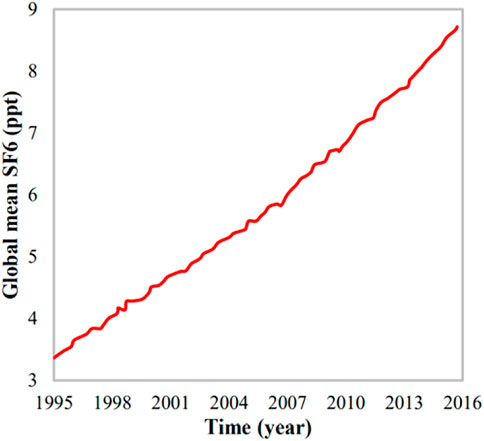
FIGURE 1. SF6 Concentration in the environment.
Even though its concentration is still small as compared to other hydrocarbon gases, its impact is more significant than that of other potent gases, owing to its high GWP. For a mass of merely 1 kg of SF6 leaked into the air, the impact on the environment is equal to the presence of 23.5 tons of CO2. Due to its high GWP, the researchers present at the Kyoto Summit of 1997 decided to control the usage and leakage of SF6 (Takuma, 1999). Hence, on one hand, steps were taken to control leakages of SF6 switches and circuit breakers (Zhengzheng et al., 2010; Graber, 2011; Kaur and Choudhury, 2016), while, on the other hand, there have been attempts to find an alternative to SF6 that shares the same properties (McGarvey et al., 2013; Kieffel et al., 2015; Hyrenbach and Zache, 2016; Marland and Helwig, 2016; Nechmi et al., 2016; Zhao et al., 2016).
Hence, the authors in (Owens, 2016) used a 3M™ Novec™ 4,710 instead of SF6 as a dielectric fluid in HV applications to attain a sustainable environment. However, because it has 30 years atmospheric lifetime and not enough boiling temperature, it needs to be mixed with other carrier gases, such as nitrogen, air, or CO2, to achieve a low boiling point so that it could be used in high-pressure applications. Even though 3M™ Novec™ 4,710 has a large breakdown strength in contrast to SF6, its GWP is 2,100, which is still very high compared to R-12. In (Ullah et al., 2017), nitrogen gas was used as the buffer gas with R-12. It was concluded in that research that an 80% R-12% and 20% nitrogen combination provides high dielectric strength. Moreover, it has an AL of 12 years and GWP is 2,400 years. In (Li et al., 2018), C4F7N was tested with Nitrogen, and the dielectric strength of pure C4F7N was twice that of SF6 but its boiling point was −4.7°C, which is very high compared to SF6, making it unsuitable to use at high pressure. R-12 gas was used as a refrigerant (McLinden and Huber, 2020), and radiator gas in Cherenkov detectors (Harvey et al., 2018). In (Rashid et al., 2016), research had been done on R-12 with a mixture of air. In this research 70% R-12% and 30% air was obtained as a good combination in term of breakdown voltage for both AC and DC.
From the abovementioned literature review, it is observed that it is difficult to find a dielectric having properties of low GWP, less atmospheric lifetime, low boiling point, and high dielectric permittivity all at once. The insulating gas dielectric should also be non-toxic, non-flammable, and non-corrosive, along with having high vapor condensation temperature and no effect on the ozone layer.
An ideal dielectric exudes a high dielectric strength and a lower GWP and atmospheric lifetime. It is quite difficult to discover these properties in one compound. Usually, every organic compound upon being released into the air casts its own effect on the environment by working as a greenhouse gas. However, non-organic compounds have low dielectric strength.
Hence, based on the abovementioned discussion, this research work aimed to find the optimum ratio of the mixture of gases (R-12 and CO2) for HVAC and HVDC. In comparison to other gasses, such as 3M™ Novec™ 4,710 and SF6, R-12 is a non-toxic gas; it falls in the "A1″ category of refrigerants, which means that it is neither flammable nor toxic up to 440 ppm. Its molecular weight is 120.9 g, which is 144.13 g less than Perfluoro ketone (C5F10O), which makes the equipment lighter and smaller when used in a GCB. The withstanding voltage of this gas was found high because it is a hydrocarbon gas, so with less pressure, a high breakdown voltage is comfortably achieved. The drawbacks of different gases are discussed in Table 1.
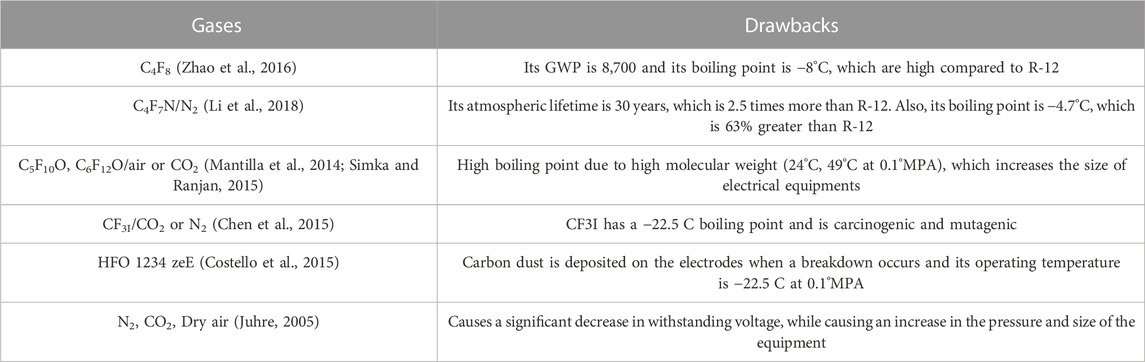
TABLE 1. Different gases with their drawbacks.
The rest of the manuscript is organized as follows: physical, chemical, environmental, thermal, taxological, and dielectric properties of R-12 are discussed in Section 2; we elaborate on the mixture of R-12 and CO2 in Section 3; in Section 4, we present the experimental setup of AC and DC that are used to perform experiments in the lab; in Section 5, we explain the insulating properties of the mixture; in Section 6, the results obtained from the experiments are explained in comparison to other mixtures; the synergistic effect and self-recoverability tests results are shown in Section 7; and in the last section, we describe the concluding remarks.
2 Properties of R-12
2 Physical properties
R-12 is a colorless refrigerant with an ether-like odor when the concentration is very high. Its boiling point is −29.8 C and its ionization potential is 11.75 eV. Many qualities of this component are similar to that of SF6, i.e., non-toxic, non-flammable, high dielectric strength, and non-corrosive. Figure 2 shows the vapor pressure versus condensation temperature of R-12, CO2, and SF6. It can be concluded from the graph that the vapor pressure versus condensation temperature of SF6 is very high as compared to R-12, but this deficiency can be overcome by adding a different mixture with R-12, such as CO2, N2, and dry air. Despite having good properties, R-12 is dangerous for the ozone layer, which is why it was banned as a refrigerant in 1996. However, studies show that this problem could be eliminated by decomposing it into hydrogen chloride and neutralizing it (Okazaki and Kurosaki, 1992; Sonoyama and Sakata, 1998). Hence, CO2 has been added as a mixture gas in this research to lower the temperature condensation, which helps decrease the GWP even more by minimizing pure R-12 concentration in the mixture. Moreover, the cost is reduced if less concentration of R-12 is used because CO2 is much cheaper than R-12.
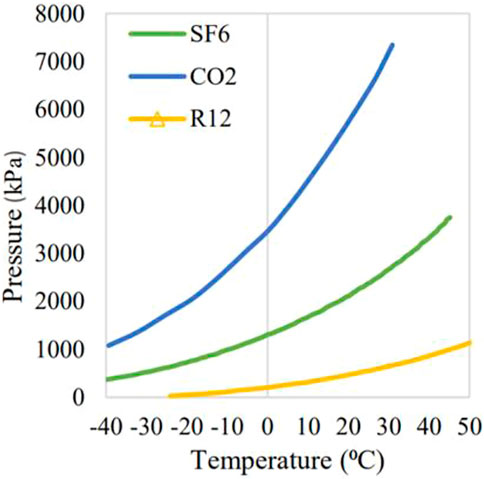
FIGURE 2. Temperature and Pressure graph of SF6, R-12, and CO2.
2.2 Thermal stability
R-12 is a colorless refrigerant with an ether-like odor when the concentration is very high. R-12 is non-flammable and chemically stable gas up to 250°C (482°F) at atmospheric pressure, but it may be decomposed into toxic products above 250°C. Hence, it could be used in GCB below 250 C. Its major advantage is that it is an electronegative gas like SF6. Thus, it possesses the property of arc-quenching, just like SF6 gas.
2.3 Taxological property
According to the international institute of refrigeration, the safety classification of R-12 is “A1” (Gilman et al., 2017). It implies that it has a lower degree of toxicity, i.e., 440 ppm or less. It has less GWP and atmospheric lifetime than that of SF6 and has 2000 less GWP than NOVEC fluid 4,710, but it does contribute towards the elevation of GWP of the environment.
2.4 Environmental property
By using R-12 instead of SF6, 89.78% declination of GWP can be instigated. Moreover, the AL of R-12 is 3,10 years less than that of SF6 gas. Its concentration is reduced even more when it is used as a mixture instead of a pure dielectric. Hence, a mixture (lower gas density) results in lower greenhouse gas emissions as compared to emissions from SF6-filled components.
2.5 Dielectric property
The experiments were performed in the lab to find out the dielectric strength of R-12. When high voltage was applied between the plates, dipole movement took place between the molecules of R-12, which led to the eruption of the current. The dielectric constant of the gas can store the charge when it is placed between two metallic plates. In Figure 3, a comparison graph is shown based on tests performed in the lab when the gap distance was kept at 10 mm. The results depict that the dielectric strength of pure R-12 is close to the dielectric strength of pure SF6.
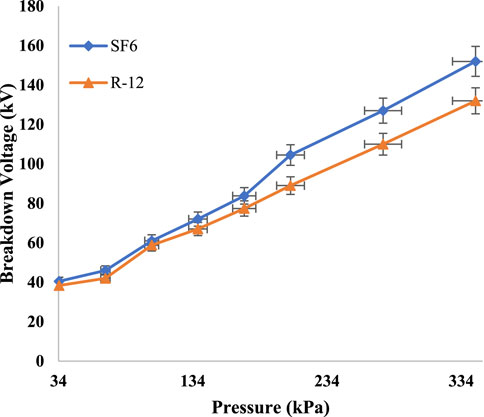
FIGURE 3. Comparison of SF6 and R-12.
2.6 Power density property
Power density is the amount of power that can be transferred per unit volume. The more the power density, the less time will be required to transfer. One of the additional benefits of using refrigerant as a dielectric is that it increases the power density of the electrical equipment. As it is a cool gas, it provides direct cooling of the live parts thus increasing its power density. Moreover, it helps to prolong the lifetime of the electrical equipment.
3 Mixture of R-12 and CO2
The boiling point of R-12 is high, so it cannot be used alone for high pressure. Therefore, some other gases are needed to be mixed to lower their boiling points. As a result, the cost will also be reduced as Base Gas (BG) is more expensive as compared to Mixed Gas (MG). Additionally, an MG, such as CO2, was used in this experimental work that increased the dielectric strength of the BG. The reason lies in the fact that when the MG is mixed with the BG, it de-energizes the electrons from a high energy level to a low energy level, and hence energy is removed from the electrons. When a voltage is applied between the electrodes, an electric field is created between the electrode gaps. Consequently, when the electrons that exist in the gas gain sufficient energy from the electric field, they transfer their energy to other electrons, and the collisions between these electrons produce a spark from the positive electrode to the negative electrode, hence the breakdown of the gas occurs.
The boiling point of R-12 is −29.8°C, while the CO2 boiling point is −78 C. So, when both gases are mixed the boiling point will be increased, which will be directly dependent on the concentration of CO2 gas. The more the concentration of CO2, the less will be the boiling point. Hence, in this research, R-12 and CO2 gases were mixed by changing their ratios, i.e., 50% of both R-12 and CO2, 60% R-12% and 40% CO2, 70% R-12% and 30% CO2, 80% R-12% and 20% CO2, and 90% R-12% and 10% CO2. The gases were mixed in such proportions to find out the optimum combination for different pressures.
4 Experimental setup
To validate the performance of the proposed MG (R-12 and CO2), an experimental test was carried out followed by the IEC60270 standard (Schon, 2019). The test was conducted outside the vessel under Standard Temperature and Pressure (STP). Both AC and DC tests were conducted with a gap distance of 6 mm between the sphere-sphere electrodes having a diameter of 20 mm. The sphere electrodes used were made of tungsten alloy. The electrodes were cleaned and polished before being mounted to the vessel to avoid any errors during the testing process. The spacing between the electrodes (6 mm) was adjusted by putting a wooden rack between them and was adjusted by using an adjustable screw coupling having the range of 0.01 mm–30 mm. Moreover, during this experiment, the pressure was varied from 0–275.8 kPa.
4.1 A.C analysis
The AC tests circuit comprised a test transformer with coupling winding for cascade connection to produce high AC voltage. Its rated voltage was 100 kV, resistor of 2.4 kΩ, measuring capacitor of 100 pF, control desk, and testing vessel as depicted in Figure 4A. The vessel had Pixi glass, which was fixed between the top and bottom flanges. The top flange was connected to high voltage while the lower flange was connected to the ground. The control desk supply voltage was 220–230 V and 50/60 Hz, and the output of 5 KVA was continuous. The control desk housed the measuring instruments, i.e., Impulse, peak, and DC voltmeter. The schematic circuitry can be seen in Figure 4B. A testing vessel was filled up to 275.8 kPa with the mixtures of R-12 and CO2 in different proportions to determine the optimum combination while ensuring high dielectric strength and also to determine and use the combination of gases with the specific known breakdown voltage in different switches and circuit breakers.
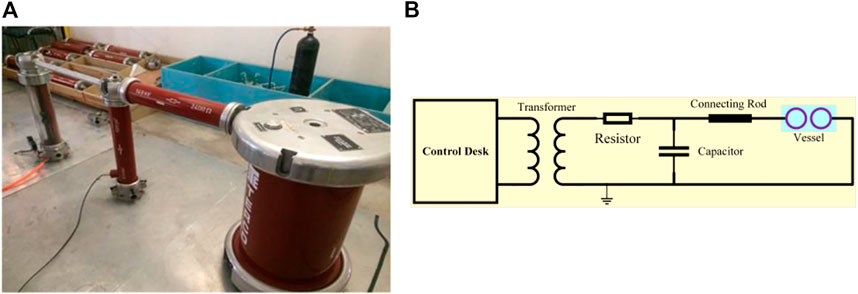
FIGURE 4. AC test model: (A) hardware implementation; (B) schematic circuitry. (Electrodes shape: sphere, electrodes distance: 6 mm).
Initially, the voltage was applied at the primary windings of the transformer and increased linearly (2 kV/s) with the help of a control desk. As the voltage increased at the primary side, the voltage at the secondary side also increased to a limit when the breakdown of the gases in the vessel occurred. At the start of the experiment, the first ten breakdowns were unrecorded to ensure accurate readings. Once a breakdown was achieved, the secondary winding of the transformer was disconnected automatically from the remaining circuitry due to the interpretation of the breakdown as a short circuit fault. Then the voltage at the primary windings was reduced to zero. This process was repeated for ten recordings to get an average breakdown value. The time required for two-successive readings was 2 min.
4.2 DC analysis
The circuit elements used during DC testing included two diodes that had inverse peak voltage of 140 kV, a test transformer, protecting resistor and measuring resistor of 280 MΩ and 2.4 kΩ, respectively, two Capacitors of 2,500 pF, a control desk, and a testing vessel. A protection resistor was used to limit the current while a measuring resistor measured the voltage across the vessel. The DC tests were conducted through a voltage doubler circuit called a Greinacher circuit, as shown in Figure 5A, while its lab setup is presented in Figure 5B.
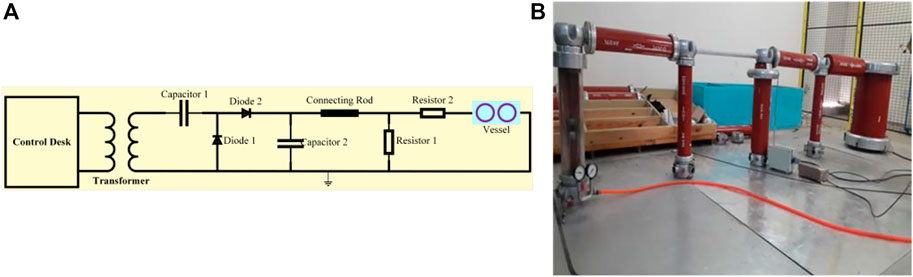
FIGURE 5. DC test model: (A) schematic circuitry; (B) hardware implementation. (Electrodes shape: sphere, electrodes distance: 6 mm).
When AC voltage was supplied to the circuit, the capacitor was charged in a negative cycle as the diode 2 was forward-biased. During the positive cycle, the supply voltage and capacitor voltage added up and hence the voltage was doubled, which was applied to the vessel containing the gas. When the voltage exceeded the gas dielectric strength, a spark was generated and the current flowed from the anode to the cathode, and the breakdown of the gas occurred. The HVDC tests were performed for different concentrations of R-12 and CO2 by controlling the partial pressures of both gases. The ratios were varied in 50/50, 60/40, 70/30, 80/20, and 90/10 ratio of R-12 and CO2, respectively. After each ratio test, the electrodes were cleaned and polished before starting a new test to avoid any error in the readings.
The vessel was filled up to 344.7 kPa with the mixture of gasses and five readings were taken at one pressure. Then the pressure was reduced to 310.26 kPa and the readings were recorded again. The process was repeated until zero pressure.
5 Results and comparison analysis
The HVDC and HVAC breakdown voltages of R-12 and CO2 under standard temperature and variable pressure are shown in Figures 6, 7, respectively. For the purpose of achieving a higher boiling point, different ratios of CO2 were tested, out of which, a 50% CO2 and 50% R-12 combination exhibited better results for both AC and DC in certain pressure ranges.
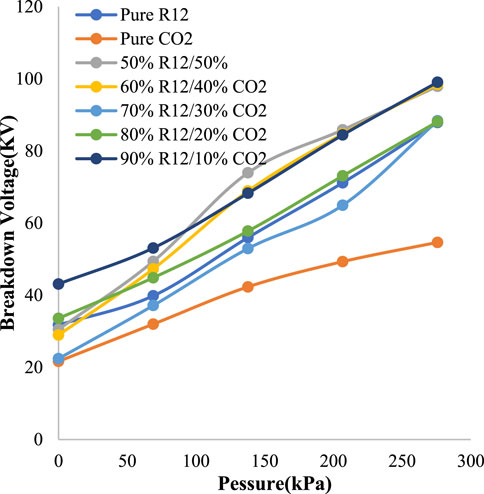
FIGURE 6. DC breakdown voltage vs. pressure graph of R-12-CO2.
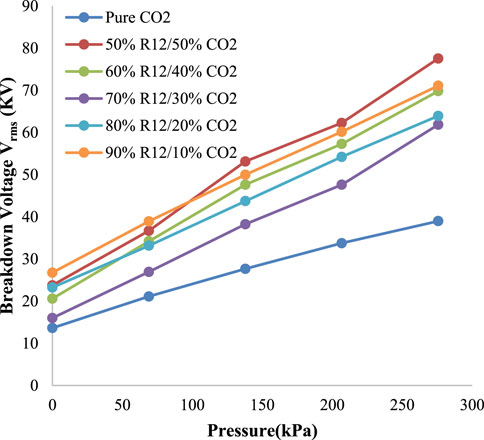
FIGURE 7. AC breakdown voltage Vs. pressure graph of R-12-CO2.
From Figure 6, it can be observed that the 50/50 ratio gave the unexcelled result between 103.4 kPa and 206.8 kPa. However, below 103.4 kPa, 90/10 gave the optimum result, and above 206.8 kPa both the 50/50 ratio and 90/10 ratio exhibited the optimum result compared to other ratios. The highest peak was observed at 275.8 kPa, which was 99 kV. The highest peak of 88 kV was found at 275.8 kPa at a 50/50 ratio of R-12 and CO2 in HVAC, as presented in Figure 7. It should be noted here that below 124 kPa, the 90/10 ratio exhibited better results.
The optimum AC and DC comparison ratios are given in Table 2 against each pressure. For 137.9 kPa and 206.8 kPa, the optimum ratio recorded for both AC and DC was 50/50. While 90/10 was a favorable ratio against the pressure of 0 kPa, 69 kPa, and 275.8 kPa in DC. While in AC, it was recorded against 69 kPa and 137.9 kPa. Hence, for better results, the different ratios could be used in the GIS, GIC, and GIL, according to the breakdown voltage required at different sites.
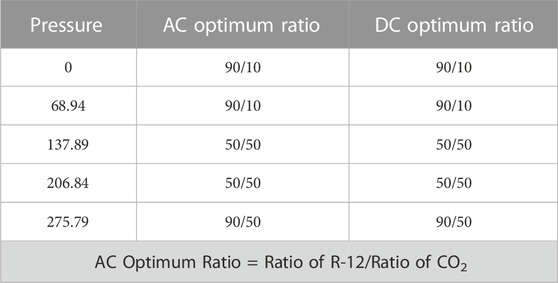
TABLE 2. Comparison ratio of R-12-CO2.
In (Ullah et al., 2017), R-12 was used as a mixture with nitrogen gas and air. The optimum ratio for each MG and BG is shown in Figure 8. In 80% R-12% and 20% nitrogen MG, the optimum result was achieved. Similarly, 70% of R-12% and 30% of air showed the most favorable combination of the mixture. From Figure 8, it can be observed that the R-12 mixture with CO2 shows a better result than the R-12/nitrogen and R-12/air mixtures beyond 206.8 kPa. The R-12 and CO2 combination exhibited an enhanced ability to restrain more voltage beyond 206.8 kPa. The arch-quenching ability also increased, as CO2 also possesses an arc-quenching property. Also, it is more economical, as more concentration of CO2 is used in this combination compared to nitrogen and air in the R-12/N2 and R-12/air mixtures.
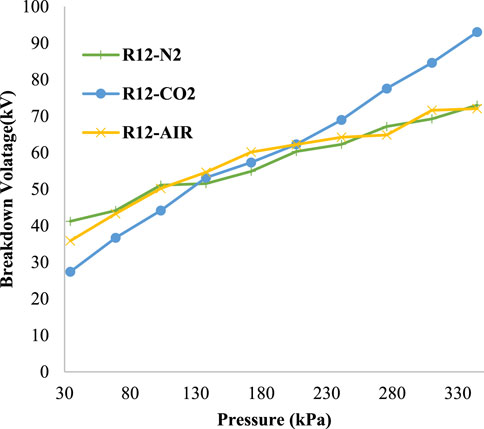
FIGURE 8. Comparison of Optimum Ratios of R-12 with air, N2, and CO2.
In (Khan et al., 2018), the R-134a in conjunction with CO2 was used as a sustainable alternative to SF6. The GWP of R-12 is twice that of R-134a, but the AL of R-12 is 2 years less than R-134a, which makes R-12 suitable for operating in high temperatures. Thermally, R-12 is 2.5 times more stable than R-134a, which allows R-12 to be used at high temperatures. Moreover, its dielectric permittivity is higher than that of R-134a, which makes R-12 suitable for operating at high voltage. The optimum ratio observed in the R-134a/CO2 mixture was 80% of R-134a and 20% of CO2 while a 50/50 ratio of R-12-CO2 was observed in this research. Both ratios are compared in Figure 9. It could be seen that the breakdown voltage of the R-12/CO2 mixture was higher at pressures between 0–300 kPa compared to R-134a/CO2. The maximum breakdown voltage of the R-12/CO2 mixture was 1.5 times greater than that of the R-134a/CO2 mixture. At 275.8 kPa, the highest peak of R-134a/CO2 was 51 kV while that of R-12/CO2 was 77.5 kV. Moreover, the concentration of the BG was 50% in the R-12/CO2 combination, which makes it cheaper as compared to R-134a/CO2.
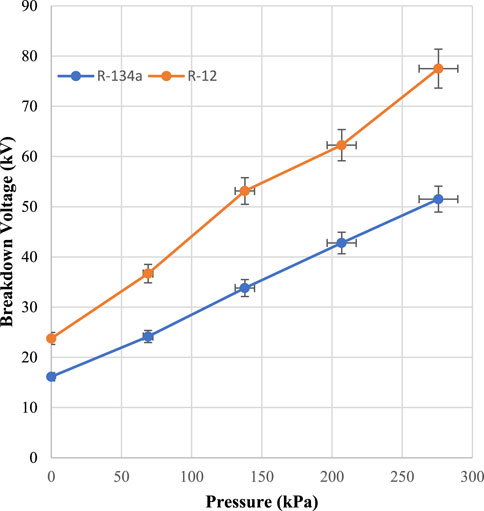
FIGURE 9. Comparison of optimum ratios of R-12/CO2 and R-134a/CO2.
6 Insulation characteristics of R-12/CO2
AC and DC insulation characteristics can be seen in Table 3. The greater value of the mean represented, the better the ratio for a combination of concentrations. As observed from Table 3, the most suitable ratio of concentration in AC was 50%, in which 137.9 kPa was filled with R-12, and 137.9 kPa was filled with CO2. This combination showed a better average for the dielectric breakdown voltages and hence can be considered the suitable choice by ignoring the pure case. While in the case of DC, the favorable values of the average mixture of the concentration of gases were found in both 90/10 and 50/50 ratios, whereas there was a very minute difference in both mixtures.
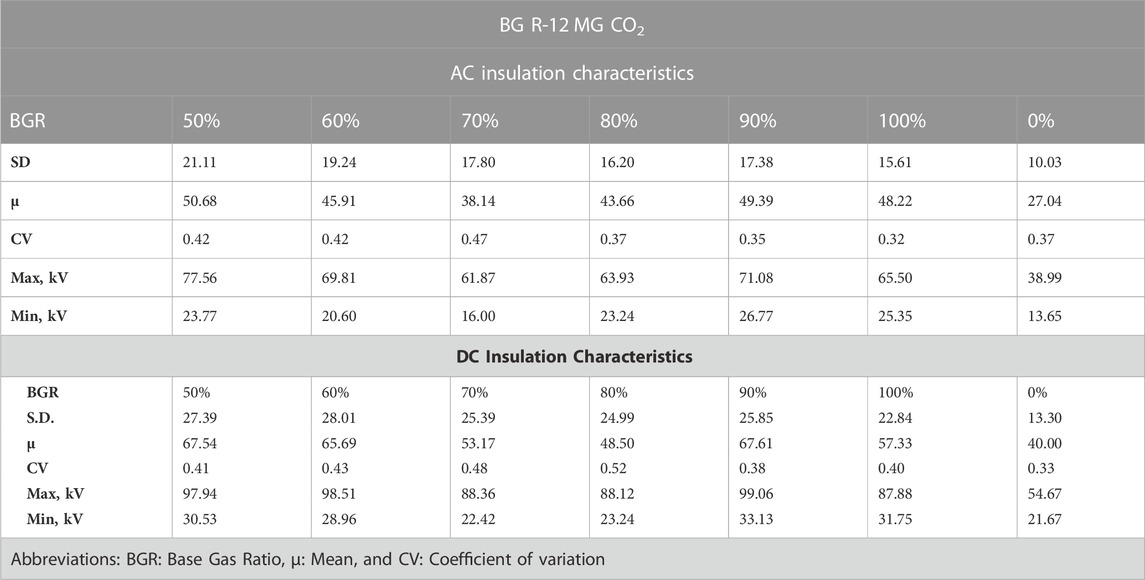
TABLE 3. Insulation characteristics.
If it was intended to check the reliability of the data, then the Standard Deviation (SD) needed to be calculated. From Table 3, it can be seen that a combination of 80% of R-12% and 20% of CO2 SD had the least value. So, it was the optimum reliable combination for our different concentration ratios. A similar combination was observed in the case of DC. A linearity was achieved between pressure and breakdown voltage more noticeably when there was an 80% concentration of R-12 and a 20% concentration of CO2.
A Coefficient of Variation (CV) was also found to determine the variance between different sets of data for comparison purposes. The lower the CV, the less the variation. According to the experimental data, it was found that with the mixture of gases at a 90/10 ratio, the variance was less in AC as well as DC. The maximum breakdown voltage was measured when the partial pressures of both R-12 and CO2 were equal in AC. While minimum voltage was observed when the ratio was 70/30, the highest voltage measured in DC, of 99.6 kV, was at 70% and MG was 30%, as presented in Table 3.
7 Self-recoverability and synergistic effect of R-12 and CO2
The breakdown and partial pressure characteristics of a gas can be determined in a uniform field as:
where, V1, V2, and Vm are breakdown voltages of component gases and their mixture, respectively, k is the partial pressure ratio of gas 1, and C is the constant independent of 'k'. The value of 'C' indicates whether the synergistic effect is positive or negative. If the value of C is negative, then the synergistic effect becomes positive, and if it is positive, then the synergistic effect becomes negative.
The value of C in (1) can be determined in Table 4 for different volume percentage values of k; Table 4 depicts that the synergistic effect is negative for the pressure of 50%, 60%, and 90% (Honeywell, 2011). The negative values mean that the mixture result was better than the individual gases when they were used alone. Beyond 103.42 kPa at a 50/50 ratio of R-12/CO2, there was positive synergism, which led us to conclude that it should be used with CO2 for better results. Compared to the synergistic effect with nitrogen (Ullah et al., 2017), it was observed that a more positive synergistic effect was quite high when a 90/10 ratio of R-12/CO2 was used compared to R-12/N2. The minimum value of C was −1.57 at 275.8 kPa in the R-12/CO2 mixture, while the minimum value found in the nitrogen mixture was −0.39 when the ratio of concentration was 70/30. It means that the R-12/CO2 mixture was chemically stronger as the individual compared to the individual gases and R-12/N2 mixture.
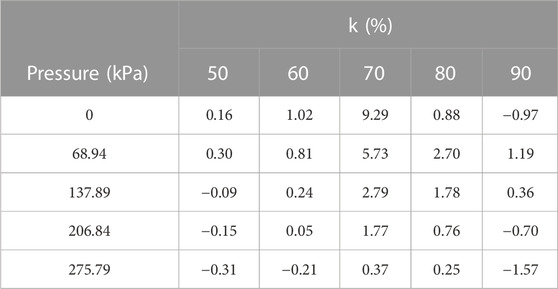
TABLE 4. Synergistic effect of R-12-CO2.
A gas needs to possess the property to recover itself once the breakdown of the gas occurs. Hence, breakdown tests were performed on the R-12 to find out whether it possesses the ability of self-recoverability. AC breakdown tests were performed, and 20 shots were applied in a 1-min duration. A buzzing spark was generated on each shot from the anode to the cathode, forming a path to pass the current for a 50 μs duration. It is noted from tests that R-12 possessed a self-recoverability property, as after the breakdown of insulation, it reverted to the initial breakdown voltage and exhibited the ability to self-recover its insulation. There was a very minute change in breakdown voltage, which could be ignored. Hence, R-12 has excellent self-recoverability properties.
8 Conclusion
R-12 has a low GWP and exudes high dielectric permittivity properties with less AL, hence, it can be used as a dielectric material in the GIS, GCB, and GIL in order to ensure a sustainable environment. SF6 gas and NOVEC fluid 4,710 possess better dielectric properties than R-12, but this effect could be eliminated by using high pressure, or by increasing the gap distance between the electrodes. R-12 has a lower boiling point, but it can be compensated by the addition of carbon dioxide, which results in an elevated boiling point. The mixture of R-12/CO2 exhibits appreciable self-recoverability properties. Its synergetic effect is positive for some values of k, which is a good indicator when it comes to its usage as a mixture.
The maximum dielectric strength is observed when the mixture ratio of R-12 and CO2 is 50/50 for both AC as well as DC, which reduces R-12 concentration; hence a high strength of dielectric is achieved with less cost. Also, decreasing the concentration when using R-12 as a mixture with CO2 reduces the GWP even more and consequently results in a more sustainable environment. A positive synergism also led to the conclusion that using both gases as a mixture is a better choice as compared to using them individually. As a better result of R-12 was observed beyond 206.8 kPa with CO2 mixture than the air and nitrogen mixture, we concluded that a R-12/CO2 mixture should be used.
Data availability statement
The original contributions presented in the study are included in the article/supplementary material, further inquiries can be directed to the corresponding authors.
Author contributions
Conceptualization, SAK and SH; methodology, SAK and SH; software, SAK, SH, STC, and MA; validation, SAK, SH, AA, ME, and MA; formal analysis, SA., SH, AA, and MAK; investigation, SAK, SH, and ME; resources, SH, SK, and ME; data curation, SH, STC, and AA; writing—original draft preparation, SAK and SH; writing—review and editing, SAK, SH, MA, STC, AA, SK, and ME; visualization, SK; supervision, SH; project administration, SH, SK, and ME; funding acquisition, SK, and ME. All authors have read and agreed to the published version of the manuscript.
Funding
This study was supported via funding from prince Sattam bin Abdulaziz University Project number (PSAU/2023/R/1444).
Conflict of interest
The authors declare that the research was conducted in the absence of any commercial or financial relationships that could be construed as a potential conflict of interest.
Publisher’s note
All claims expressed in this article are solely those of the authors and do not necessarily represent those of their affiliated organizations, or those of the publisher, the editors and the reviewers. Any product that may be evaluated in this article, or claim that may be made by its manufacturer, is not guaranteed or endorsed by the publisher.
References
Beroual, A., Khaled, U., and Coulibaly, M.-L. (2018). Experimental investigation of the breakdown voltage of CO2, N2, and SF6 gases, and CO2–SF6 and N2–SF6 mixtures under different voltage waveforms. Energies 11 (4), 902. doi:10.3390/en11040902
Chen, L., Widger, P., Tateyama, C., Kumada, A., Griffiths, H., Hidaka, K., et al. (2015). “Breakdown Characteristics of CF3I/CO2 gas mixtures under fast impulse in rod-plane and GIS geometries,” in 19th international symposium on high voltage engineerin, 1–6.
Costello, M. G., Flynn, R. M., and Bulinski, M. J. (2015). Fluorinated nitriles as dielectric gases. Google Patents.
Forster, P., Ramaswamy, V., Artaxo, P., Berntsen, T., Betts, R., Fahey, D. W., et al. (2007).Changes in atmospheric constituents and in radiative forcing. Chapter 2 In Climate change 2007 (The physical science basis).
Gilman, R., Downie, E., Ron, G., Strauch, S., Afanasev, A., Akmal, A., et al. (2017). Technical design report for the Paul scherrer institute experiment R-12-01.1: Studying the proton" radius" puzzle with {\mu} p elastic scattering. arXiv preprint arXiv:1709.09753.
Graber, L. (2011). Improving the accuracy of SF<sub>6</sub> leakage detection for high voltage switchgear. IEEE Trans. Dielectr. Electr. Insulation 18 (6), 1835–1846. doi:10.1109/tdei.2011.6118621
Harvey, A. H., Paulechka, E., and Egan, P. F. (2018). Candidates to replace R-12 as a radiator gas in Cherenkov detectors. Nucl. Instrum. Methods Phys. Res. Sect. B: Beam Interact. Mater. Atoms 425, 38–42. doi:10.1016/j.nimb.2018.04.006
Hyrenbach, M., and Zache, S. (2016). “Alternative insulation gas for medium-voltage switchgear,” in 2016 Petroleum and Chemical Industry Conference Europe (PCIC Europe) (IEEE), 1–9.
Jiang, F., Wang, H., Chen, J. M., Ju, W., Tian, X., Feng, S., et al. (2021). Regional CO&lt;sub&gt;2&lt;/sub&gt; fluxes from 2010 to 2015 inferred from GOSAT XCO&lt;sub&gt;2&lt;/sub&gt; retrievals using a new version of the Global Carbon Assimilation System. Atmos. Chem. Phys. 21 (3), 1963–1985. doi:10.5194/acp-21-1963-2021
Juhre, K. (2005). High pressure N2, N2/CO2 and CO2 gas insulation in comparison to SF6 in GIS applications. In 14th int'l. Sympos. High voltage eng. ISH.
Kaur, P., and Choudhury, T. (2016). “Early detection of SF 6 gas in gas insulated switchgear,” in 2016 7th India International Conference on Power Electronics (IICPE) (IEEE), 1–6.
Khan, S. A., Rashid, A., Ullah, R., Khan, M. Y. A., and Taj, A. (2018). R-134a and C0 2 mixture as a sustainable alternative to SF6 and CO 2. In 2018 International Conference on Electrical Engineering (ICEE), IEEE, 1–5.
Kieffel, Y., Biquez, F., Ponchon, P., and Irwin, T. (2015). “SF 6 alternative development for high voltage switchgears,” in 2015 IEEE power and energy society general meeting (IEEE), 1–5.
Li, Y., Zhang, X., Chen, Q., Fu, M., Zhuo, R., Xiao, S., et al. (2018). Study on the dielectric properties of C 4 F 7 N/N 2 mixture under highly non-uniform electric field. IEEE Access 6, 42868–42876. doi:10.1109/access.2018.2859358
Mantilla, J., Gariboldi, N., Grob, S., and Claessens, M. (2014). “Investigation of the insulation performance of a new gas mixture with extremely low GWP,” in 2014 IEEE Electrical Insulation Conference (EIC) (IEEE), 469–473.
Marland, M., and Helwig, A. (2016). “Possibilities for minimising sulphur hexafluoride use for HV switchgear asset renewal: An Australian case study,” in 2016 Australasian Universities Power Engineering Conference (AUPEC) (IEEE), 1–5.
McGarvey, C., Timoshkin, I., MacGregor, S., Wilson, M., Given, M., and Sinclair, M. (2013). “Characterisation of a plasma closing switch filled with environmentally friendly gases,” in 2013 19th IEEE Pulsed Power Conference (PPC) (IEEE), 1–5.
McLinden, M. O., and Huber, M. L. (2020). (R)Evolution of refrigerants. J. Chem. Eng. Data 65 (9), 4176–4193. doi:10.1021/acs.jced.0c00338
Nechmi, H. E., Beroual, A., Girodet, A., and Vinson, P. (2016). Fluoronitriles/CO2 gas mixture as promising substitute to SF6 for insulation in high voltage applications. IEEE Trans. Dielectr. Electr. Insulation 23 (5), 2587–2593. doi:10.1109/tdei.2016.7736816
Okazaki, S., and Kurosaki, A. (1992). Process for the catalytic decomposition of chlorofluoro-alkanes. Google Patents.
Owens, J. G. (2016). “Greenhouse gas emission reductions through use of a sustainable alternative to SF 6,” in 2016 IEEE Electrical Insulation Conference (EIC) (IEEE), 535–538.
Rashid, A., Rashid, A., Naeem, M., Amin, M., Ali, Z., and Ajmal, N. (2016). “Dielectric charateristics of dichlourodifluoro-methane gas for highvoltage application,” in 2016 International Conference on Computing, Electronic and Electrical Engineering (ICE Cube) (IEEE), 138–142.
Simka, P., and Ranjan, N. (2015). “Dielectric strength of C5 perfluoroketone,” in Proceedings of the 19th International Symposium on High Voltage Engineering, 2015.
Sonoyama, N., and Sakata, T. (1998). Electrochemical decomposition of CFC-12 using gas diffusion electrodes. Environ. Sci. Technol. 32 (3), 375–378. doi:10.1021/es970417d
Ullah, R., Rashid, A., Rashid, A., Khan, F., and Ali, A. (2017). Dielectric characteristic of dichlorodifluoromethane (R12) gas and mixture with N2/air as an alternative to SF6 gas. High. Volt. 2 (3), 205–210. doi:10.1049/hve.2017.0047
Zhao, H., Li, X., and Lin, H. (2016). Insulation characteristics of c-C4 -F8 -N2 and CF3 I-N 2 mixtures as possible substitutes for SF6. IEEE Trans. power Deliv. 32 (1), 254–262. doi:10.1109/tpwrd.2016.2587898
Keywords: dielectric strength, high voltage, R-12 gas, synergistic effect, global warming, atmospheric lifetime
Citation: Khan SA, Habib S, Khan MYA, Chauhdary ST, Ali A, Kamel S and Elnaggar MF (2023) Dichlorodifluoromethane-carbon dioxide: A dielectric mixture as a sustainable alternative to SF6 in high voltage applications. Front. Mater. 10:1129739. doi: 10.3389/fmats.2023.1129739
Received: 28 December 2022; Accepted: 27 February 2023;
Published: 16 March 2023.
Edited by:
Ronghua Zeng, South China Normal University, ChinaReviewed by:
Chaohai Zhang, Nanjing University of Aeronautics and Astronautics, ChinaKazimierz Orzechowski, University of Wrocław, Poland
Copyright © 2023 Khan, Habib, Khan, Chauhdary, Ali, Kamel and Elnaggar. This is an open-access article distributed under the terms of the Creative Commons Attribution License (CC BY). The use, distribution or reproduction in other forums is permitted, provided the original author(s) and the copyright owner(s) are credited and that the original publication in this journal is cited, in accordance with accepted academic practice. No use, distribution or reproduction is permitted which does not comply with these terms.
*Correspondence: Salman Habib, c2FsbWFuaGFiaWJAaGh1LmVkdS5jbg==; Mohamed F. Elnaggar, bS5lbG5hZ2dhckBwc2F1LmVkdS5zYQ==