 Siyuan Fu
 Rongjin Liu1,2,3*
- 1College of Materials Science and Engineering, Guilin University of Technology, Guilin, China
- 2Collaborative Innovation Center for Exploration of Nonferrous Metal Deposits and Efficient Utilization of Resources in Guangxi, Guilin University of Technology, Guilin, China
- 3Guangxi Engineering and Technology Center for Utilization of Industrial Waste Residue in Building Materials, Guilin University of Technology, Guilin, China
Poor utilization of ceramic polishing slag and uneven foaming at high temperatures are some of the crucial problems associated with the formation of porous ceramics. To overcome this, the present study was designed to prepare closed-ended polishing slag porous ceramics by controlling the holding time. Scanning electron microscope, XRD, and X-CT were used to investigate the effects of holding time on the microstructure, pore structure, and phase composition of porous ceramics. The results showed that the holding time had a great influence on the physical properties of the samples, and it provides uniform porosity without significant change in the composition of the material phase of the porous ceramics. Under a holding time of 30 min, volume density reached up to 0.68 g/cm3, while the water absorption and the apparent porosity were 27.33% and 15.49%, respectively. The compressive strength reached 13.07 MPa, and the pore size distribution is mainly between 25 μm and 100 μm, of which the d30 pore diameter accounted for about 28%, the d50 pore diameter accounted for 25%, the d70 pore diameter accounted for 12%, and the d90 pore diameter accounted for 10% of the pore size distribution. In conclusion, the present study clearly shows that the pore structure and properties of porous ceramics can be effectively controlled by controlling the holding time while using a high volume of polishing slag. The feasibility of X-CT for studying the pore distribution inside porous ceramics was verified.
1 Introduction
According to the data, for every 1m2 (Wang et al., 2019) production of ceramic polishing tiles, 2.1 kg of polishing slag was produced. China alone produces up to 10 million tons of ceramic waste each year (Xiong et al., 2019). Due to the low utilization of these ceramic polishing slags, the landfill constantly occupies the land and pollutes the land, air, and water bodies (Wang et al., 2019).
The ceramic polishing slag, the internal phase of which mainly consists of glass, quartz, and a small amount of mullite phases (Yang et al., 2010; Huang et al., 2012; Li, 2019) contains Al2O3, SiO2, K2O, CaO, and Na2O (Wang, 2019). Because polishing slag is the waste after tile post-milling, rough grinding, fine grinding, polishing, and edge grinding (Xie and Chen, 2019), the internal phase also contains a small amount of grinding head SiC, Mg(OH)2, MgCl2, and some organic matter in the storage environment, which makes the composition more complex (Huang et al., 2012; Xie and Chen, 2019).
In recent years, many researchers have made great effort in resource utilization of polishing slag. This includes using ceramic polishing slag as a coagulation aggregate and for producing porous materials. For instance, Senthamarai and Manoharan (2005), Correia et al. (2006), Brito et al. (2004), and Suryavanshi and Swamy (2002) used different blends of ceramic wastes as recycled aggregates to prepare concrete which can replace natural coarse aggregates. As ceramic recycled aggregates can improve the concrete’s compatibility and compactness, the recycled concrete worked better and had better durability than ordinary concrete. In producing porous materials, Hou et al. (2006) prepared a kind of wrapped no-burning ceramic pellets using polished brick waste, which successfully replaced clay as the primary raw material for producing ceramic shells. This low-cost and simple process can save significant energy. Some researchers found that polishing slag contains small amounts of SiC inside, so the problem of high-temperature foaming will occur at high temperatures. Xi et al. (2017) investigated the inhibitory effect of Si powder on SiC foaming by adding different contents of SiC and Si powder to tile powder. It was found that the SEM images were bubble-free and the volume density was close to 1.0 g/cm3, which indicated the inhibitory effect of Si powder on the foaming of SiC. Similarly, Hu (2018) studied the impact of Al powder on the firing foaming of the ceramic polishing slag by adding different contents of Al powder to the slag. The results showed that with the increase in Al powder content, the firing volume density of the ceramic polishing slag increased and the water absorption decreased. At a firing temperature of 1,200°C and the addition of 12 wt% of Al powder, the volume density was recorded as 2.17 g/cm3, water absorption was less than 4%, and flexural strength was 74.16 ± 0.30 MPa. Some researchers have also used the SiC high-temperature foaming principle to prepare foamed ceramics. For instance, Zeng et al. (2008) prepared ceramic polishing waste as porous high-strength ceramic pellets by evenly mixing ceramic shells, fly ash, permeable agent, and water repellent. Lv et al. (2017) prepared an absorbent sound-absorbing sheet with the main crystalline phases of tremolite and calcium feldspar using ceramic polishing slag (25 wt%), steel slag, and burnt talc as the primary raw materials at a firing temperature of 1,200°C. The porous sound-absorbing sheet had a volume density of 2.07 g/cm3, apparent porosity of 27.19%, and an average sound absorption coefficient of 0.194 in the low-frequency band with a flexural strength of 28 MPa. Cai et al. (2011) used ceramic polishing waste slag as the main material and feldspar, ball clay, and quartz as auxiliary materials to fire a closed-type light construction material with heat insulation function.
The composition of ceramic waste used by the aforementioned researchers fluctuates greatly, and the mechanism of forming the pore structure of foamed ceramics is rather complicated. Moreover, the porous ceramics produced will have an uneven distribution of pores and different pore sizes, which will directly lead to the lower performance of foamed ceramics, such as the porosity, volume density, and thermal conductivity of foamed ceramics. Lu et al. (2020) studied different holding times of the SiO2–Al2O3–R2O–Fe2O3 ceramic systems and found that the extension of the holding time was beneficial to the formation of the amorphous phase. The complete reaction of SiC made the pores in the liquid phase grow further and form a uniform pore structure, and with the extension of the holding time, the amount of gas and liquid phase increased. With the increase in pore pressure, the liquid phase viscosity and surface tension decrease, which subsequently makes the pore size grow gradually, and the uniformity of the pores gradually decreases. Zhao et al. (2019) used three kinds of waste slag (polishing slag (60%), waste brick chips (30%), and pressed mud (10%)) to fire lightweight insulation foam ceramics and produced a porous ceramic with a compressive strength of only 3.5 MPa. Moreover, with the extension of the holding time, the internal liquid phase viscosity decreased, and also, the compressive strength of foam ceramic specimens decreased. Extending the high-temperature holding time can make the foaming agent react and produce more gas, which increases the average pore size. It can be seen that the holding time has a significant effect on the pore structure of porous ceramics, and the mechanical properties of ceramics can be most affected by excessive doping of polishing slag.
In response to the low strength of foamed ceramics made of large doping polishing slag and the phenomenon of uneven foaming. The current situation of the ceramic polishing slag of Guangxi Oceano cannot be used for large-scale resource utilization, combined with the requirements of enterprises, to provide a theoretical research basis for the large-scale resource utilization of polishing slag.
2 Materials and methods
2.1 Raw materials
The polishing slag, ball clay, porcelain tile sand, and medium-temperature sand used in this experiment were all procured from Guangxi Oceano Company. The chemical composition of various raw materials was tested and analyzed using an X-ray fluorescence spectrophotometer (XRF, ZSX Primus II). Table 1 shows the chemical composition and LOI of the different raw materials.
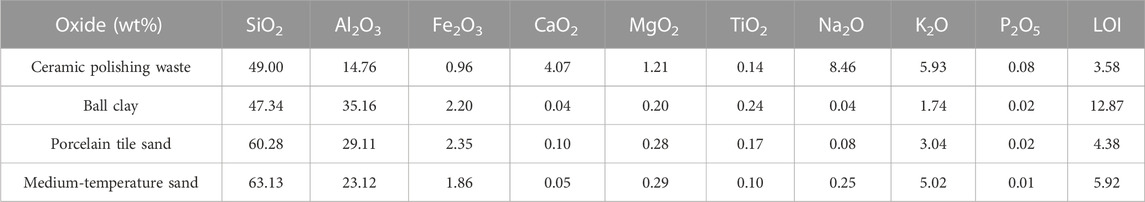
TABLE 1. Chemical composition of polishing slag, ball clay, porcelain tile sand, and medium-temperature sand from Guangxi Oceano Co.
As shown in Table 1, the ceramic polishing slag is mainly composed of 49.00 wt% SiO2 and 14.76 wt% Al2O3, and the other components are primarily composed of alkali metal oxides, such as Fe2O3, CaO2, MgO2, Na2O, and K2O. The ceramic polishing slag powder composition was determined using XRD equipment (Figure 1). The main crystalline phases of the ceramic polishing slag powder are quartz and mullite. In addition to a small amount of SiC and magnesium hydroxide hydrate, the internal SiC is mainly from the abrasive polishing tool grinding head, containing roughly 1%–5% SiC (Xi et al., 2012).
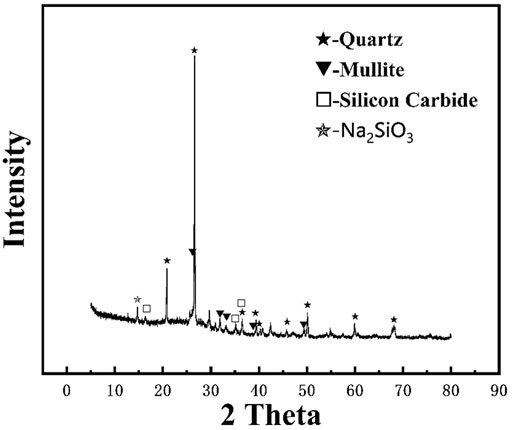
FIGURE 1. XRD result of ceramic polishing waste.
2.2 Experimental program
The ceramic polishing slag (60%) and other raw materials (10% ball clay, 5% tile sand, and 25% medium temperature sand) are mixed at a specific ratio and put into a ball mill jar. A certain amount of water was added (water-to-material ratio of 0.7), and milling was conducted for 30 min. Thereafter, the mixture was taken out and dried using a drying box. The dried sample was crushed and sieved (100 mesh sieve), and a part of the sample was granulated and pressed at 12 MPa to form a raw billet with a diameter of 35 mm and thickness of 20 mm. The raw billet was further dried to a constant weight at 105°C. Then, the raw billets were sintered in a sintering furnace, and the sintering rate was kept at 10°C/min throughout the sintering process. This sintering process was held at 300°C for 60 min, followed by holding at 900°C for 90 min, and finally at 1,180°C for 10, 20, 30, 40, 50, and 60 min, respectively, and cooled with the furnace. Six experimental groups of samples were sintered, followed by separate testing.
2.3 Experimental methods
To test the volume density, water absorption rate, and apparent porosity of foamed ceramics, Archimedes’ principle was applied. A universal testing machine (AG-I 50KN, Shimadzu, Japan) was used to test the compressive strength of porous ceramics according to the “compressive strength test method” (GB/T 1964–1966), at a loading speed of 0.5 mm/min. The raw materials were analyzed by differential scanning calorimetry (DSC) and thermogravimetry (TG) analysis (STA 449F3, NETZSCH, Germany). The sample phase composition was characterized using an X-ray diffractometer (XRD, Xpert pro, PANalytical, the Netherlands). Scanning electron microscopy (SEM, S-4800, Hitachi, Japan) was performed to observe and analyze the microstructure of the prepared porous ceramics, and Image-Pro Plus was used to explore the pore area. X-CT (ZEISS Xradia 510 Versa, Carl Zeiss, Germany) was also used to observe the 3D images of porous ceramics and their porosity and pore distribution, and 15-μm pixel points were selected to obtain the equivalent diameter and sphericity. The equivalent diameter was obtained using Eq. 1. It is calculated as the diameter of the same volume of spherical particles. Sphericity is defined as the ratio of the surface area of the sphere to the surface area of the particle (as shown in Eq. 2). The sphericity of a sphere is 1; therefore, the sphericity of any other particle is less than 1. Pore diameters below 2–3 times the voxel size were considered less reliable due to the limitations imposed by the resolution of the selected X-ray CT lens. However, only artificially induced pores larger than 50 μm were considered.
where Volume3d denotes the volume of a pore, and A denotes the surface area of a pore.
3 Results and discussion
3.1 TG-DSC
Figure 2 shows the TG-DSC curve of the sample burned at 1,300°C at a heating rate of 10°C/min, mainly reflecting three reaction intervals. The first section in the first 300°C resulted in a mass loss of 1.61 wt%, which is primarily due to the dissipation of water at a high temperature. The second section temperature between 300°C and 900°C resulted in a mass reduction of 4.28 wt%, which was due to the loss of internal organic impurities and water dissipation. This is because the environment in which the polishing slag is stored is more complex, and the polishing slag and ceramic factory internal wastewater mixing together, and many other reasons, led to the complex composition of polishing slag, containing a little organic matter. The third stage was at 900°C and resulted in a quality loss of 1.10 wt%. At this stage, SiC began to develop a foaming phenomenon, at 911°C. The liquid phase started to react with SiC to produce bubbles. The excellent stability of the SiC particles themselves was due to the presence of a protective film of SiO2 on the SiC surface, which prevents the reaction of SiC with O2. At high temperatures, the SiO2 cladding layer is easily destroyed and a silicate liquid phase is formed, resulting in a faster diffusion rate of O2, which reacts with SiC inside and produces large amounts of CO and CO2, which are then retained in these liquid phases and form pores (Schiroky, 1987; Cheng and Chen, 2004; Mergia et al., 2008; Shui et al., 2011; Chen et al., 2012; Wang et al., 2018; Yaqun et al., 2022).
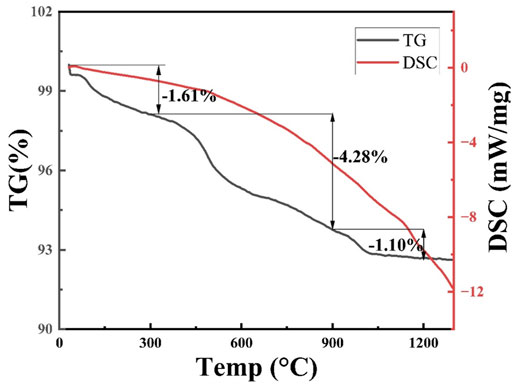
FIGURE 2. TG-DSC result of porous ceramics’ formulation.
3.2 Phase composition and microstructure analysis
Figure 3 shows the phase composition of the samples after firing at different holding times of 10, 20, 30, 40, 50, and 60 min. The quartz, mullite, and albite were shown to be the main phases in the sample by XRD analysis. In Figure 3, it can be seen that with the extension of the holding time, the intensity of the quartz phase gradually decreases. This is because the SiO2 protective layer formed on the SiC surface under the high-temperature alkaline environment reacts with the alkaline environment melt or alkaline salt to generate a silicate liquid phase, which can also indicate that the extension of the holding time can accelerate the diffusion rate of O2, leading to continuous SiC and O2 and the generation of a large amount of gas. It is evident that the influence of the pore is greater than the influence of the increase in mullite. However, the phase composition of the porous ceramics did not change with increasing holding time, which indicates that the change in holding time did not have a significant effect on the phase composition of the samples.
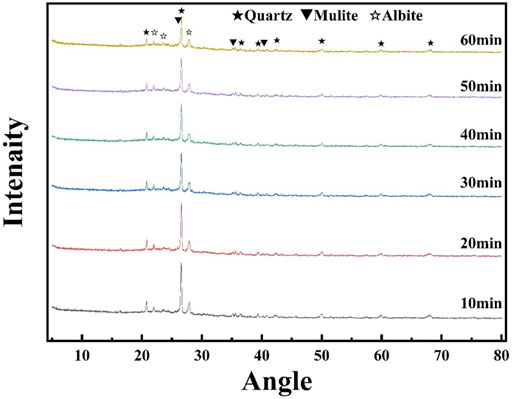
FIGURE 3. XRD result of porous ceramics at different holding times.
Figure 4 shows the microscopic morphology of porous ceramics at different holding times (10, 20, 30, 40, 50, and 60 min). It can be seen from the figure that the porosity of the samples has a significant variation. The pore size of the porous ceramics increases as the holding time increases. From the low-magnification SEM photos, it can be seen that the pore size is small and primarily independent of tiny pores at a holding time of 10 min (Figure 4A). With the extension of the holding time, the tiny pores gradually become more significant and start to produce larger pores (Figure 4B). With the extension of the holding time, connected pores are produced (Figure 4C), and the number of large pores gradually becomes more uniform. From the high-magnification SEM photos, it can be seen that the internal mesopore wall is thicker at the holding time of 10 min, and no other pores appear. From Figures 4G–L, it is observed that the pore wall gradually becomes thinner with the extension of the holding time. There are some tiny pores on the pore wall, and it can be seen that these tiny pores merge with the large pores. These small pores and large pores are independent of each other, and it is seen from Figure 4L that the surface of the large pores is smooth, and there are many independent tiny pores on the pore wall. Also, it can be seen that the large pores engulf the microscopic pores.
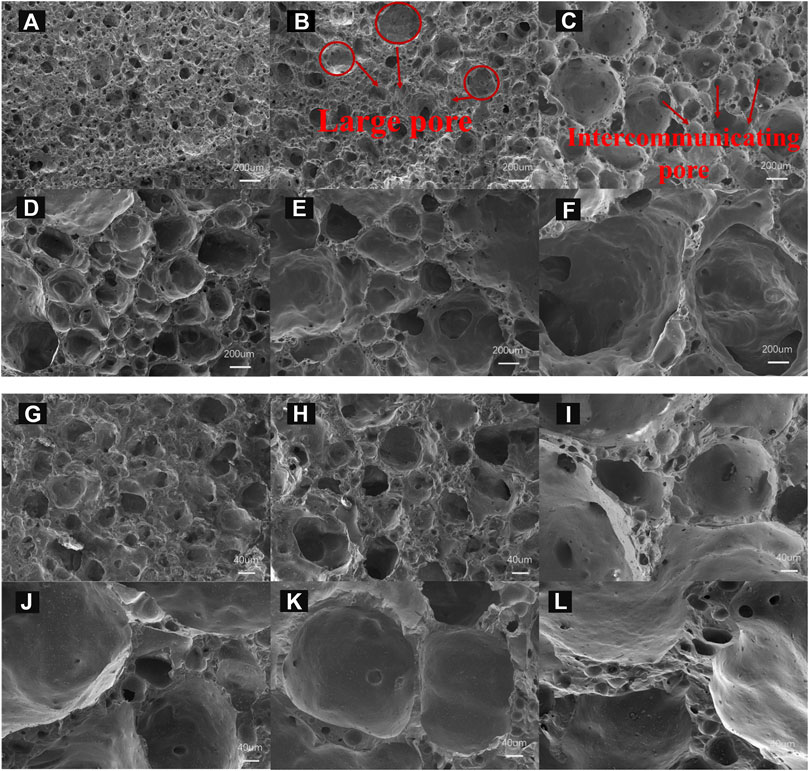
FIGURE 4. Scanning electron microscopy (SEM) images of porous ceramics sintered under different holding times. Low magnification images: (A) 10 min, (B) 20 min, (C) 30 min, (D) 40 min, (E) 50 min, and (F) 60 min; high-magnification images: (G) 10 min, (H) 20 min, (I) 30 min, (J) 40 min, (K) 50 min, and (L) 60 min.
3.3 Physical properties of porous ceramics
Figure 5 shows the volume density, water absorption, apparent porosity, and compressive strength of the produced samples. When the holding time was set at 10 min, the volume density was the largest (1.3893 g/cm3), and the water absorption (30.51%) and apparent porosity (29.75%) were more negligible. However, when the holding time was increased to 30 min, the volume density was decreased (0.6812 g/cm3) along with water absorption (27.33%) and apparent porosity (15.49%). When the holding time was further increased to 40 min, the volume density reached the minimum and then gradually increased with the extension of the holding time. This may be due to the fact that when the holding time is too short, foaming is not sufficient and the pore formation time is short, with small pores being mainly microporous, resulting in the maximum volume density when the insulation time is 10 min. With the extension of the holding time, the viscosity of the high-temperature liquid phase produced inside the specimen becomes lower and the gas produced by the reaction of the foaming agent is sufficient, resulting in more favorable foaming. This leads to the favorable oxidation of SiC to produce gas and, hence, increases the number of pores and pore size, so it leads to the lowest bulk density when the insulation time is 40 min. When holding for 60 min, the water absorption and the apparent porosity reach the maximum values. This is due to the fact that the sample contains a large number of large pores, and the gas constantly spills outward, leading to the increase in apparent porosity. In the first 30 min of insulation, the difference in the water absorption rate is not very large, which is due to the fact that in the early stage of the reaction, the pores are mostly independent (Figure 4), which also leads to more pores on the surface, so between 10 min and 30 min of insulation, the apparent porosity is the largest in the insulation at 10 min. However, with the extension of the holding time, the internal pores increased, so the apparent porosity decreased; after 30 min, connected pores started to appear, and the gas was constantly overflowing outward, so it led to the increasing apparent porosity.
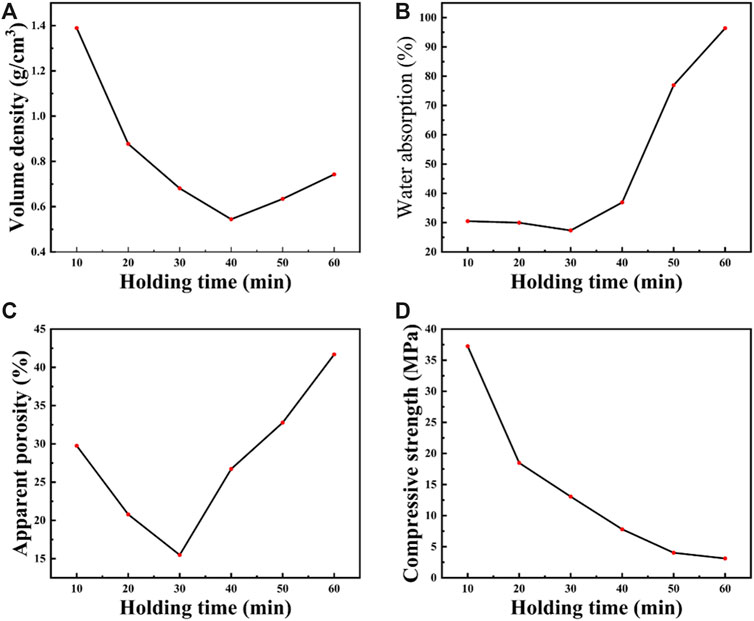
FIGURE 5. Physical properties of porous ceramics at different holding times. (A) Volume density. (B) Water absorption. (C) Apparent porosity. (D) Compressive strength.
Figure 5D shows the relationship between the holding time and compressive strength. It can be seen that the compressive strength is 37.23 MPa at 10 min of holding time and gradually decreases with the extension of the holding time until the compressive strength drops to 3.11 MPa at 60 min of holding time. The main reason is that with the increasing saving time, the liquid phase viscosity is unchanged, and the continuous oxidation of SiC results in increased foaming volume. Hence, the pore size gradually becomes more significant, and the pore wall gradually becomes thinner, leading to uneven internal pores and abnormally larger pores. From the SEM diagram (Figure 4), it can be seen that under different holding times, the pore wall becomes thinner. From SEM at a holding time of 60 min (Figure 4L), it can be seen that there are some small pores on the pore wall, which reduces the pore wall thickness. So, the pore size becomes more significant with the extension of holding time, and therefore, the compressive strength gradually decreases with the extension of holding time. It can be concluded that at 10 min of holding time, the volume density and the compressive strength are the highest. With the extension of the holding time (at 30 min), the apparent porosity and water absorption rate are the lowest, the volume density is smaller, and the compressive strength reaches 13.07 MPa.
3.4 Structure
Ceramic pores can be divided into small, medium, large, and coarse pores according to the size of the pore. The tiny pores are in the range of 1–10 μm; medium pores, in the range of 10–100 μm; large pores, in the range of 100–1,000 μm; and coarse pores, in the range of 1,000–10,000 μm.
In this experiment, the cut surfaces of porous ceramics were ground and polished to deal with the effects of cutting on the samples, and Image-Pro Plus was used to analyze the pore area of the cut surface and to calculate the equivalent radius of the pore. X-CT was used to observe the pore size without destroying the sample. The size of the independent internal pores can be followed by X-CT without overpowering the piece itself so that the pore distribution of the model can be seen, and the internal pore size can be observed by changing the resolution. In this experiment, 15 μm solution was used.
Figure 6 and Figure 7 show the equivalent pore size distribution and the average pore size, respectively, obtained using Image-Pro Plus to count the area of each pore on the porous ceramic section. Figure 8, Figure 9, and Figure 10 are the pore volume accumulation, average pore volume, and 3D reconstruction of porous ceramics, respectively, under the 3D pore volume after X-CT photography and analysis by Avizo software. From the average pore size in the plane shown in Figure 7, it was evident that the pore size increases with the extension of the holding time, and we can also visualize the changes in the pore in the 3D plot.
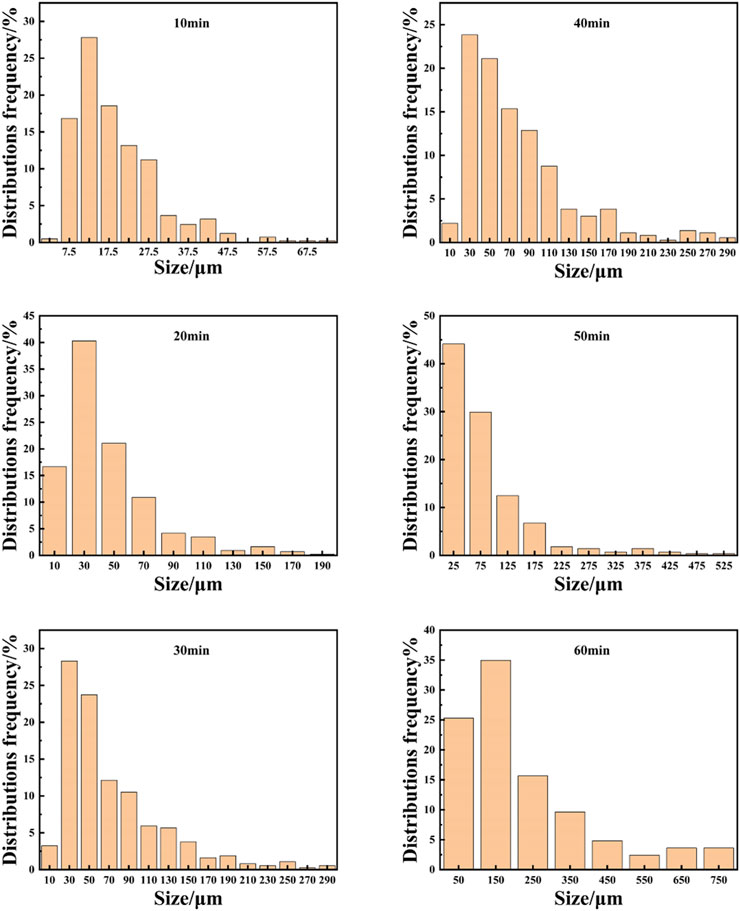
FIGURE 6. Pore size distribution results at different holding times.
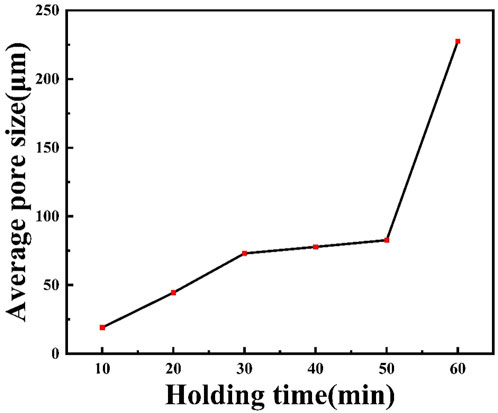
FIGURE 7. Average pore size results at different holding times.
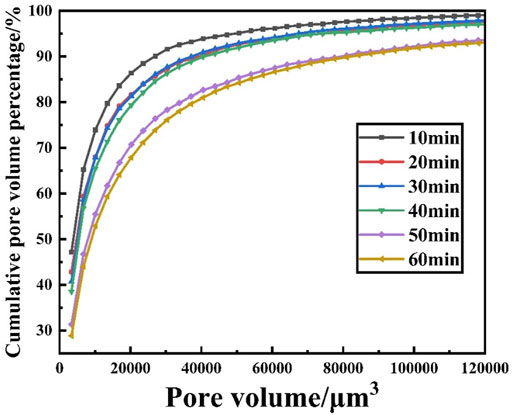
FIGURE 8. Cumulative pore volume percentage at different holding times in X-CT treatment results.

FIGURE 9. Relationship between sphericity and diameter at different holding times.
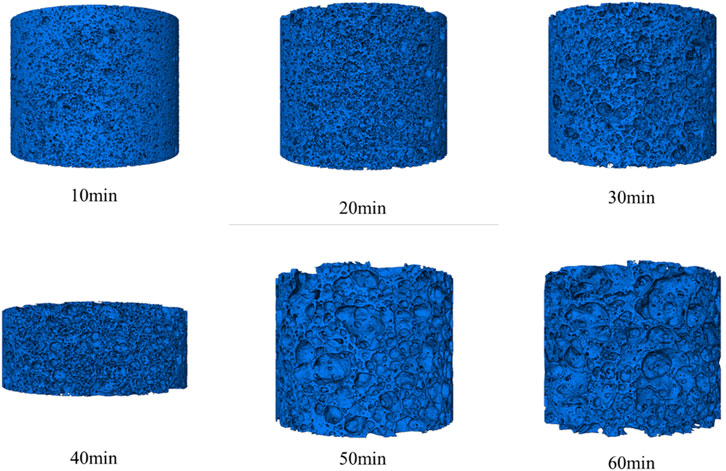
FIGURE 10. Reconstructing the 3D diagram.
The pore size distribution (between 5 μm and 30 μm) counted in the image binarization can be seen at a holding time of 10 min. When the holding time is extended to 20 min, the pores gradually become more significant and increase in size between 20 μm and 40 μm, occupying about 80%. Further increasing the holding (30 min) increases the pore size (between 20 and 50 μm); however, the pore number did not significantly increase. At a holding time of 40, 50, and 60 min, porous ceramic pore size gradually becomes more significant. It can be concluded that with the extension of the holding time, the pore size significantly increased from tiny pores to medium and large pores.
Figure 8 shows the pore volume accumulation percentage of X-CT after Avizo software processing. From the results, it can be seen that at 10 min of holding time, the number of small pores gradually reduces with increasing holding time. The small pore content gradually decreased from about 47% to less than 30% at 60 min. At a holding time of 10 min, the pore volume is 20,000 μm3, which was increased to 120,000 μm3 with the extension of the holding time. It can be seen that the arc of the curve from holding time 10 min to 60 min gradually decreased along with decreasing the proportion of tiny pores. With the extension of the holding time, the pore volume accumulation percentage decreases at 120,000 μm3, which revealed that the tiny pores are continuously fused and become large pores, increasing the number of large pores. The average pore volume is also similar to the results from the image binarization analysis and the microstructure observation phenomenon.
In Figure 9, the sphericity of the samples varies from 0.2 to 1 for fired pores with a high content of bubbles deforming each other to form polyhedral shapes (Dhasindrakrishna et al., 2021; Feng et al., 2022). Therefore, when evaluating samples with a spatially homogeneous distribution of pores, it is advisable to concentrate the sphericity in a narrow range rather than close to 1. Based on this premise, at the initial holding time of 10 min, the range reaches 0.2–1. With the extension of the holding time, the pore size becomes larger at 20 min, which is due to the emergence of internal connecting pores, resulting in a larger equivalent diameter of the analysis, with sphericity not close to 1, and is more dispersed. At 30 min and 40 min of holding time, the sphericity distribution is more concentrated. Subsequently, after holding for 50 min and 60 min, the pore size becomes larger; however, the sphericity range was more concentrated. The results showed that the appropriate extension of the holding time helps to produce concentrated pore sphericity distribution with uniform pore size.
4 Conclusion
From the results of the present study, it can be concluded that different holding times resulted in changes in the properties of polishing porous slag ceramics. With the extension of the holding time, the strength of porous ceramics, the volume density, apparent porosity, and water absorption first decrease and then increase, and the compressive strength decreases continuously. The best overall polishing porous slag ceramics properties were achieved at the holding time of 30 min, volume density of 0.68 g/cm3, water absorption and apparent porosity of 27.33% and 15.49%, respectively, and compressive strength of 13.07 MPa.
A combination of SEM and X-CT was used to study the pore structure of porous ceramics with large doped polished slag at different holding times. With the extension of the holding time, the internal SiC continuously reacts with the liquid phase and generates gas, gradually producing connected pores and large pores with more concentrated sphericity, indicating that the extension of the holding time can make the internal pores more uniform and the sphericity close to 1. To obtain the better property of polishing porous slag ceramics, a holding time of 30 min resulted in the pore size distribution between 25 μm and 100 μm, of which d30 pore size accounts for about 28%, d50 pore size accounts for 25%, d70 pore size accounts for 12%, and d90 pore size accounts for 10%, and the sphericity range is concentrated in 0.6–1. The present study provides a controlling strategy to obtain better properties of porous ceramics with high-volume polished slag, which can be further used to control the product quality.
Data availability statement
The original contributions presented in the study are included in the article/Supplementary Material; further inquiries can be directed to the corresponding authors.
Author contributions
SF: conceptualization, data curation, writing—original draft, and writing—review and editing. RL: conceptualization, funding acquisition, and writing—review and editing. JW: conceptualization, funding acquisition, and writing—review and editing. WL: writing—review and editing, and support. CZ: writing—review and editing, and support. ZO: writing—review and editing, and support.
Funding
The authors acknowledge the funding provided by the Science and Technology Major Project of Guangxi (GuikeAA21077012).
Conflict of interest
The authors declare that the research was conducted in the absence of any commercial or financial relationships that could be construed as a potential conflict of interest.
Publisher’s note
All claims expressed in this article are solely those of the authors and do not necessarily represent those of their affiliated organizations, or those of the publisher, the editors, and the reviewers. Any product that may be evaluated in this article, or claim that may be made by its manufacturer, is not guaranteed or endorsed by the publisher.
References
Brito, J. d., Pereira, A. S., and Correia, J. R. (2004). Mechanical behavior of non-structural concrete made with recycled ceramic aggregates[J]. Cem. Concr. Compos. 27 (4), 1–10. doi:10.1016/j.cemconcomp.2004.07.005
Cai, X., Xi, X., and Sui, A. (2011). Preparation of high-strength and lightweight construction materials from ceramic polishing waste [J]. Bull. Chin. Ceram. Soc. 30 (04), 955–959. doi:10.16552/j.cnki.issn1001-1625.2011.04.023
Chen, B., Wang, K., Chen, X., and Lu, A. (2012). Study of foam glass with high content of fly ash using calcium carbonate as foaming agent. Mater. Lett. 79, 263–265. doi:10.1016/j.matlet.2012.04.052
Cheng, T. W., and Chen, Y. S. (2004). Characterisation of glass ceramics made from incinerator fly ash. Ceram. Int. 30 (3), 343–349. doi:10.1016/s0272-8842(03)00106-8
Correia, J. R., Brito, J., and Pereira, A. S. (2006). Effects on concrete durability of using recycled ceramic aggregates. Mater. Struct. 39 (2), 169–177. doi:10.1617/s11527-005-9014-7
Dhasindrakrishna, K., Pasupathy, K., Ramakrishnan, S., and Sanjayan, J. (2021). Progress, current thinking and challenges in geopolymer foam concrete technology. Cem. Concr. Compos. 116, 103886. doi:10.1016/j.cemconcomp.2020.103886
Feng, W., Jin, Y., Zheng, D., Fang, Y., Dong, Z., and Cui, H. (2022). Study of triethanolamine on regulating early strength of fly ash-based chemically foamed geopolymer. Cem. Concr. Res. 162, 107005. doi:10.1016/j.cemconres.2022.107005
Hou, L., Zeng, L., and Wang, H. (2006). Preparation of encapsulated no-burn ceramic granules from polished brick waste[J]. New Constr. Mater. 8, 72–74.
Hu, J. (2018). Firing foaming control of ceramic polishing slag and its application in sound-absorbing ceramics [D]. Guangzhou: South China University of Technology.
Huang, H., Ke, S., and Zhang, G. (2012). The application and status of polishing waste in ceramic tiles[J]. Foshan Ceram. 22 (07), 1–9.
Li, J. (2019). Study on the influence of atmosphere and control of ceramic polishing slag firing foaming[D]. Guangzhou: South China University of Technology.
Lu, Y., Sun, S., and Ma, C. (2020). Study of foamed ceramics and their pore structures in SiO2-Al2O3-R2O-Fe2O3 system [J]. Bull. Chin. Ceram. Soc. 39 (06), 1916–1922+1929. doi:10.16552/j.cnki.issn1001-1625.2020.06.033
Lv, H., Zeng, L., and Wang, H. (2017). Study on the preparation of porous acoustic panels using industrial waste [J]. Ceramic 24 (04), 59–61. doi:10.19397/j.cnki.ceramics.2017.04.011
Mergia, K., Lafatzis, D., Moutis, N., Apostolopoulos, G., and Cousin, F. (2008). Oxidation behaviour of SiC coatings. Appl. Phys. A 92 (2), 387–395. doi:10.1007/s00339-008-4536-9
Schiroky, G. H. (1987). In situ measurement of silicon oxidation kinetics by monitoring spectrally emitted radiation. J. Mater. Sci. 22 (22), 3595–3601. doi:10.1007/bf01161465
Senthamarai, R., and Manoharan, P. D. (2005). Concrete with ceramic waste aggregate. Cem. Concr. Compos. 27 (9), 910–913. doi:10.1016/j.cemconcomp.2005.04.003
Shui, A., Xi, X., Wang, Y., and Cheng, X. (2011). Effect of silicon carbide additive on microstructure and properties of porcelain ceramics. Ceram. Int. 37 (5), 1557–1562. doi:10.1016/j.ceramint.2011.01.026
Suryavanshi, A. K., and Swamy, R. N. (2002). Development of lightweight mixes using ceramic microspheres as fillers. Cem. Concr. Res. 32 (11), 1783–1789. doi:10.1016/s0008-8846(02)00871-2
Wang, C. (2019). Preparation and properties of polished slag foam ceramics by additive method[D]. Guangzhou: South China University of Technology.
Wang, H., Chen, Z., Liu, L., Ji, R., and Wang, X. (2018). Synthesis of a foam ceramic based on ceramic tile polishing waste using SiC as foaming agent. Ceram. Int. 44 (9), 10078–10086. doi:10.1016/j.ceramint.2018.02.211
Wang, S., Wang, C., and Wang, Y. (2019). The current situation of ceramic waste generation and resource utilization[J]. J. Ceram. 40 (06), 710–717. doi:10.13957/j.cnki.tcxb.2019.06.002
Xi, X., Shui, A., Li, Y., Wang, Y., Abe, H., and Naito, M. (2012). Effects of magnesium oxychloride and silicon carbide additives on the foaming property during firing for porcelain ceramics and their microstructure. J. Eur. Ceram. Soc. 32 (12), 3035–3041. doi:10.1016/j.jeurceramsoc.2012.04.001
Xi, X., Xiong, H., Shui, A., Huang, M., Xiao, S., and Lin, H. T. (2017). Foaming inhibition of SiC-containing porcelain ceramics by using Si powders during sintering. J. Eur. Ceram. Soc. 37 (15), 5044–5050. doi:10.1016/j.jeurceramsoc.2017.06.013
Xie, H., and Chen, Z. (2019). Research on the preparation of ceramic tiles using polished slag from ceramic industry waste[J]. Non-Metallic Mines 42 (03), 100–103.
Xiong, C., Wang, H., and Zeng, L. (2019). Manufacture of foamed ceramics from polishing slag[J]. Shandong Ceram. 42 (03), 3–8.
Yang, C., Rao, Z., and Deng, J. (2010). Preparation of lightweight exterior wall tiles using polished brick waste[J]. Foshan Ceram. 20 (07), 25–27+39.
Yaqun, W., Yuming, T., and Ming, F. (2022). Effects of holding time on structure and the properties of spodumene/mullite composite ceramics[J]. Int. J. Appl. Ceram. Technol. 19 (3), 1–10. doi:10.1111/ijac.14007
Zeng, L., Shirley, K., and Sui, A. (2008). Preparation of insulating wall materials from ceramic waste [J]. Non-Metallic Mines 21 (04), 5–7.
Keywords: ceramic polishing slag, porous ceramics, pore structure, compressive strength, X-CT
Citation: Fu S, Liu R, Wei J, lv W, Zhang C and Ouyang Z (2023) Effect of holding time on the properties of porous ceramics with high-volume polished slag and its pore structure characteristics. Front. Mater. 10:1147120. doi: 10.3389/fmats.2023.1147120
Received: 18 January 2023; Accepted: 14 February 2023;
Published: 02 March 2023.
Edited by:
Martin I. Pech-Canul, Centro de Investigación y de Estudios Avanzados Unidad Saltillo, MexicoReviewed by:
Ping Duan, China University of Geosciences Wuhan, ChinaRodrigo Moreno, Institute of Ceramics and Glass (CSIC), Spain
Copyright © 2023 Fu, Liu, Wei, lv, Zhang and Ouyang. This is an open-access article distributed under the terms of the Creative Commons Attribution License (CC BY). The use, distribution or reproduction in other forums is permitted, provided the original author(s) and the copyright owner(s) are credited and that the original publication in this journal is cited, in accordance with accepted academic practice. No use, distribution or reproduction is permitted which does not comply with these terms.
*Correspondence: Rongjin Liu, bGl1amluQGdsdXQuZWR1LmNu; Jiazhan Wei, NDEyMjYxMTgzQHFxLmNvbQ==