 Xianjun Zeng
 Ning Hu
 Yaolu Liu1,3
 Huiming Ning
- 1College of Aerospace Engineering, Chongqing University, Chongqing, China
- 2State Key Laboratory of Reliability and Intelligence Electrical Equipment, and School of Mechanical Engineering, Hebei University of Technology, Tianjin, China
- 3Chongqing Key Laboratory of Heterogeneous Material Mechanics, Chongqing, China
Composite plates are widely used in the aircraft manufacturing industry. The projectile damage of composite plates is affected by complex factors such as material, structure, impact velocity, and impact angle. A reliable method is needed for efficient structural health monitoring. In this paper, a composite plate damage prediction and evaluation model based on the cloud model and neural network is proposed; the five types of experimental characteristics are used as input parameters, and the depth and diameter of the damage area are used as output parameters to train the neural network–cloud model. This method transforms the quantitative data of impact damage of the composite plate into qualitative damage by introducing the cloud model, which makes the damage situation more intuitive. The results show that the accuracy of the prediction model is 97.23%, the accuracy of the evaluation model is 92.41%, and the comprehensive accuracy of the model is 89.85%. The composite damage prediction model has a good prediction performance.
1 Introduction
Composite plates have been widely used in the aircraft manufacturing industry due to its high strength and strong plasticity and have become the preferred structural material in newly developed aircraft structures (Dolati et al., 2014). At present, the utilization rate of composite plates in the airframe structure of Boeing B787 and Airbus A350, the representative models of two large civil airliners, has reached 50% and 53%, respectively (Dhanisetty et al., 2019). It can be said that the utilization rate of composite plates in the airframe structure has become an important symbol to measure the progressiveness and reliability of aircrafts (Oliveira et al., 2020). However, in the complex operating environment of aircraft, some external impacts such as bird impact, gravel, and hail, are often encountered (Anghileri et al., 2005). At this time, composite plates often show complex damage conditions.
In recent years, many studies have been carried out on the external impact of composite plates. Hosoi et al. (2017) studied the impact of damage on material properties through the falling weight impact test and three-point bending test and evaluated the damage development within CFRP (carbon fiber-reinforced plastic). The results showed that the internal damage of the plate was mainly caused by internal delamination, and the impact tolerance of the panel could be improved by adding sandwich panels. Wei et al. (2020) carried out a pendulum impact experiment on CFRP composites and used a non-linear acoustic resonance method to detect their impact on fatigue damage. The results showed that the damage index increased slowly at the beginning of the impact cycle and rapidly increased when the fatigue life exceeded 70%. Hou et al. (2022) established the impact finite element model of waterjet-CFRP by studying the impact of high-speed water flow on CFRP plates. The results show that delamination is most likely to occur at the interface of adjacent layers with unequal dimensions in the plate structure, and the velocity and diameter of the waterjet have a significant influence on the damage of CFRP. Formisano et al. (2022) performed a low-velocity impact response of GFRP laminates with different thicknesses and conditions. Through the study of key characteristics, such as temperature and impact energy, it is found that the laminate will have lower indentation and delamination at low temperature, and the impact energy that can be resisted is also greater. Yang et al. (2022) used projectiles at different speeds to perform external impact experiments on curved GFRP laminates. By analyzing the residual velocity of the projectile and the energy absorption rate of the plate, the thickness required for the plate to achieve optimal performance was obtained.
The aforementioned research simulated the external impact through experiments, recorded the damage data of composite plates, and analyzed their damage development laws. These works are more suitable for judging whether the properties of composite plates are suitable for a certain engineering field. However, for the complex and changeable external working environment of the aviation industry, it is more important to timely judge whether the materials can resist the upcoming impact risk in the operation process. Until now, there are few theoretical studies on damage prediction and evaluation of composite plates. Therefore, in the field of composite damage, a model that can predict and evaluate in time according to the limited external information is needed.
Since the mathematical model of neurons was proposed in 1943, the research in this field has experienced immense popularity and decline, and various neural network-derived models have been proposed (Yang et al., 2021). Among them, the ANN (artificial neural network) is widely used because of its strong adaptive, self-organizing, and self-learning abilities in the fields of pattern recognition, intelligent robots, automatic control, predictive estimation, biology, medicine, and economy (Koopialipoor et al., 2019). The ANN has successfully solved many practical problems that are difficult to be solved by modern computers and has shown good intelligent characteristics. Maynard and Harris (2022) created 18 models of different systems by extracting accident data from official accident reports. By analyzing the convergence, universality, and stability of each model, the high-risk flight environmental factors are successfully predicted. Doğan and Demir (2022) took Turkey and China as the research objects and predicted the possibility of earthquakes within a specific time interval by using the structural recursive network to capture spatial proximity and structural property.
In the aforementioned research, the neural network has been used in different engineering fields and has achieved good prediction results. However, the neural network is only a non-linear prediction of the research object, which will lead to deviation in the data results. Therefore, it is necessary to introduce an evaluation system that can tolerate errors in the evaluation process and realize quantitative and qualitative transformation so that the prediction results can be transformed into intuitive damage description. Gu et al. (2021) proposed a cloud model method for assessment of debris flow geological hazard risk. Through the calculation of a variety of evaluation factors, the risk level of debris flow is determined. Zhao et al. (2022) considered the natural fuzziness of safety and the volatility of safety level and then proposed an oil depot safety evaluation method based on cloud model theory. The reliability of the evaluation method was verified by taking the oil storage tank areas of four oil companies as examples. Through the aforementioned research, it can be found that in the field of composite damage, the combination of the cloud model and neural network can effectively predict and evaluate its damage status.
In this paper, an ANN based on the cloud model is established to realize quantitative calculation and qualitative evaluation transformation; five types of experimental characteristics are used as input parameters, and the depth and diameter of the damage area are used as output parameters to train the neural network–cloud model. Then, the model is analyzed to determine its prediction and evaluation effect. The results can provide theoretical support for damage prediction and evaluation of composite plates under projectile impact.
2 Methodology
2.1 Neural network–cloud model
The artificial neural network simulates the biological neural network from the perspective of informatics; the purpose of information processing is achieved by adjusting the connection mode within the network (Zhang, 2021). The ANN is one of the most popular neural networks, as an operation model; there are many nodes connected inside the neuron, and its structural principle is shown in Figure 1.
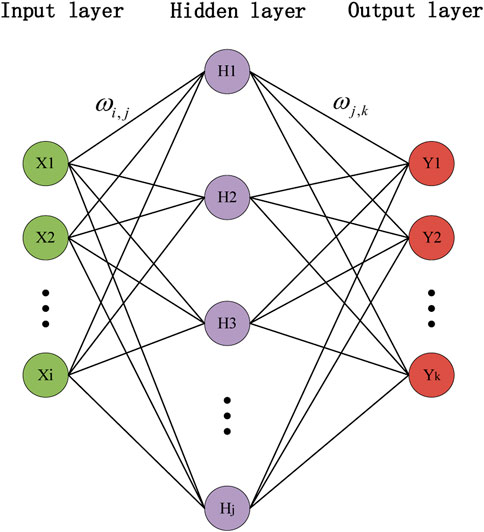
FIGURE 1. Artificial neural network theory.
As shown in the aforementioned figure, the artificial neural network is composed of three layers: input layer, output layer, and hidden layer (middle layer). Each circle in the figure represents a neuron node. The number of input layer nodes
where
The connections among the layers in the network structure represent weights (thresholds), and the arrows represent the direction of signal transmission (Li et al., 2020). (The weights of the input layer and the hidden layer are represented by
where
In Eqs 2, 3, the activation function
The neural network includes data flow forward propagation and error back propagation. The error output calculation follows the direction from the input to output. When the model output is inconsistent with the expected output, the error is back-propagated, and the weight (threshold) is adjusted to reduce the training error (Liu et al., 2014). Therefore, the error function needs to be introduced to achieve the optimal prediction of the network, as shown in Eq. 5
where
where
We repeat the aforementioned training process, and the network stops training after the parameters (weights) corresponding to the minimum error are determined. The number of repetitions in the training process is called the training number. In the subsequent process, the information of similar samples is input into the neural network, and the network will process the information of non-linear transformation with the smallest output error.
The damage prediction data from the aforementioned process can be obtained, and then these data need to be converted between quantitative and qualitative transformations to facilitate evaluation (Cao et al., 2022). The cloud model based on probability theory can be used to study the relationship between fuzziness and randomness and complete the transformation from uncertain language description to quantitative expression (Gao et al., 2019). The principle is shown in Eq. 8
where
The first step in the damage assessment phase is to convert the predicted experiment output parameters into three types of cloud digital eigenvalues.
where
where N represents the number of data for model training and RY and Ry are the values of true depth ratio of the damage layer and the predicted depth ratio of the damage layer, respectively. After obtaining the true depth ratio of the damage layer and the predicted depth ratio of the damage layer, the cloud digital eigenvalue of the experimental input data can be calculated using Eqs 11–13.
where k is a constant, which affects the thickness of the cloud in the cloud image and can be adjusted according to the actual situation. After several adjustments, it is found that the cloud thickness is appropriate when k = 0.08 (Wang et al., 2016).
The prediction model is established through the aforementioned process. In order to realize the damage assessment of composite plates, an evaluation model was constructed based on five kinds of experimental input parameters and three kinds of cloud digital eigenvalues. Then, the cloud droplet is generated based on the predicted
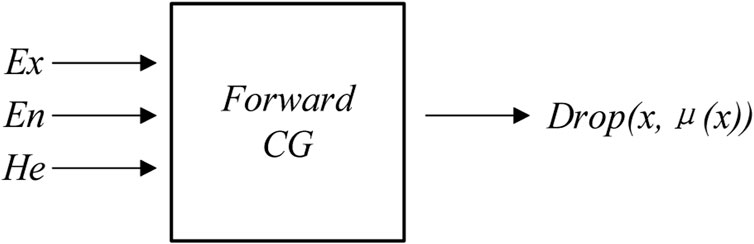
FIGURE 2. Forward cloud generator.
In the aforementioned figure,
where
We repeat the aforementioned process to generate a sufficient number of cloud droplets, and the cloud image can be formed (Zhou et al., 2016), as shown in Figure 3 (when the number of cloud droplets is below 1,000, some cloud image areas are blank. When the number is 1,000, the cloud image quality can be satisfied. This article sets to generate 1,000 cloud droplets)
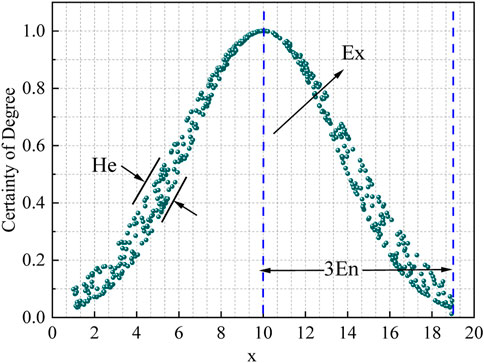
FIGURE 3. Cloud image.
2.2 Damage level
The damage level is very important for evaluating the predicted damage data. In this paper, the damage degree of composite plates is classified into four grades by referring to relevant literature (Xie et al., 2016): surface depression (Level I), substrate crack (Level II), interlayer delamination (Level III), and fiber breakage (Level Ⅳ). The range of each damage standard grade interval is expressed by the ratio of damage depth. The ratio corresponding to the four types of damage standard level intervals can be obtained by referring to relevant literature (Luo et al., 2020), as shown in Table 1.
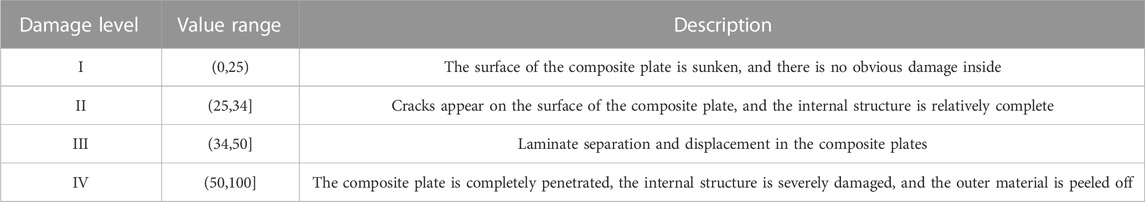
TABLE 1. Damage standard level.
The table contents show the range of damage depth ratios for each damage standard level. In order to establish a standard cloud image for reference and comparison based on the data in the table (Wu and Zou, 2020), the cloud digital eigenvalues are obtained via Eqs 15–17. The results are shown in Table 2.
where
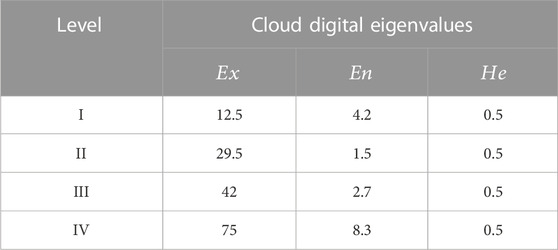
TABLE 2. Standard cloud digital eigenvalues.
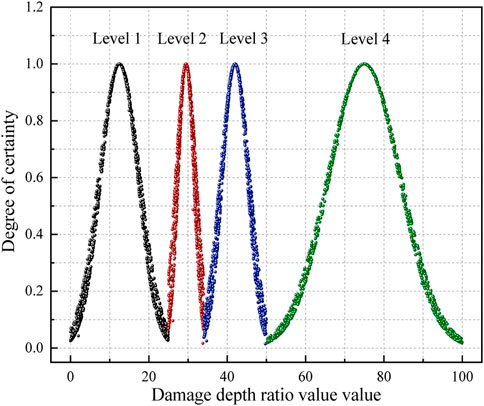
FIGURE 4. Standard cloud image.
3 Model verification and analysis
In this paper, 31 sets of damage data of composite plates are collected with reference to relevant literature (Jordan and Naito, 2014; Luo et al., 2020; Wang et al., 2022). Since this study aimed to obtain data that can feedback the damage situation through limited parameters before the experiment, which means that the experimental input parameters are easy to obtain and the output data intuitively describe the damage results. Based on the aforementioned considerations, the data involve five kinds of experimental input parameters and two kinds of experimental output parameters by screening the parameters. In addition, the training of the prediction model and the evaluation model allocate the data in a ratio of 7:3, but considering the small number of data samples, they are finally divided into three categories: test data (19 groups), validation data (eight groups), and evaluation data (four groups). The three composite plates are adopted, the main material of composite plate 1 is GFRP, and that of composite plate 2 and composite plate 3 is CFRP, and their thicknesses are 14 mm, 32 mm, and 3.6 mm, respectively. A total of 19 sets of test data are used as training samples of the neural network, as shown in Table 3.
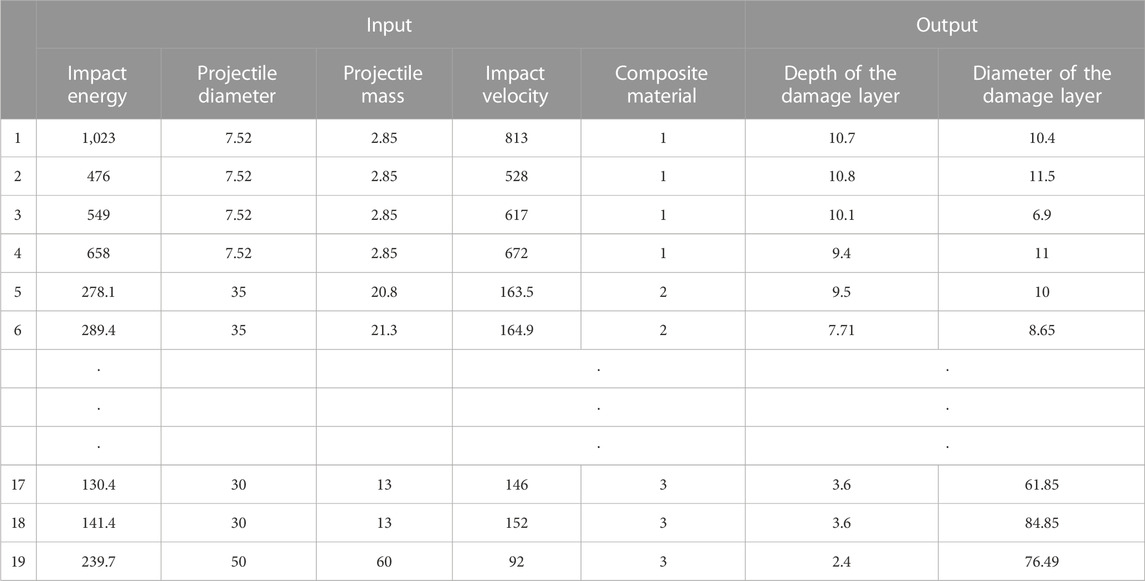
TABLE 3. Composite damage test data.
The neural network fitting toolbox of MATLAB (which can solve fitting problem by using two-layer feedforward network) is used as the training tool, and the training samples are input to start the training. In the training process, the samples are randomly divided into three parts: training set, verification set, and test set. The training set is a data sample used for neural network model fitting. The model can be optimized by gradient descent of the training error, which has an important impact in determining the weight parameters of the built-in neurons. The validation set is a separate data sample used in the model-training process, which is used to adjust the parameters and feedback the model prediction effect. By using the validation set, the problem of the model can be found in time, and the generalization ability of the model can also be verified. The test set is used to evaluate the final generalization capability of the model. The data capacity ratio of the three types of samples is set as 0.7:0.15:0.15. Then, the number of hidden layers is set. The range of the hidden layers can be determined as (3–13) according to Eq. 2. By comparing the actual values and predicted values under different layers, it is found that when the number of hidden layer nodes is 6, the error between them is the smallest and the model prediction effect is the best. In the toolbox, the advantages and disadvantages of each training algorithm are different. The Levenberg–Marquardt algorithm is chosen as the training algorithm in this paper. Although it will consume more running memory, the time it takes to train the model will be significantly reduced, which is important to improve the efficiency of neural network training. After setting the aforementioned parameters, the neural network model starts training. After setting the aforementioned parameters, the neural network model starts training. After inputting the eight sets of validation data shown in Table 4 into the model, the predicted values of the validation data are compared. The detailed data of both are shown in Figures 5, 6.
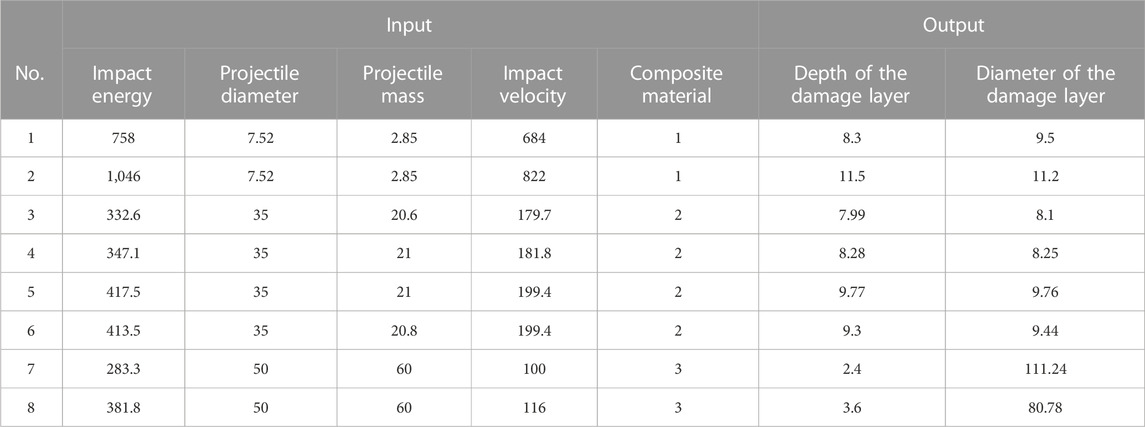
TABLE 4. Composite damage validation data.
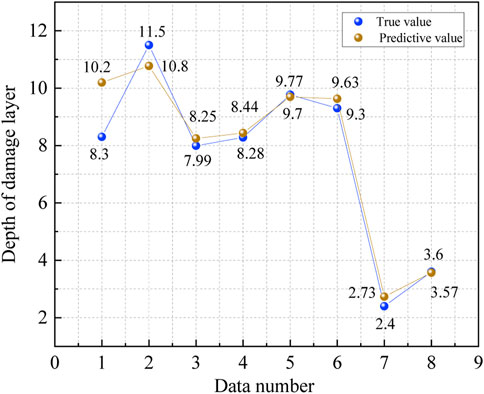
FIGURE 5. Prediction effect of damage layer depth.
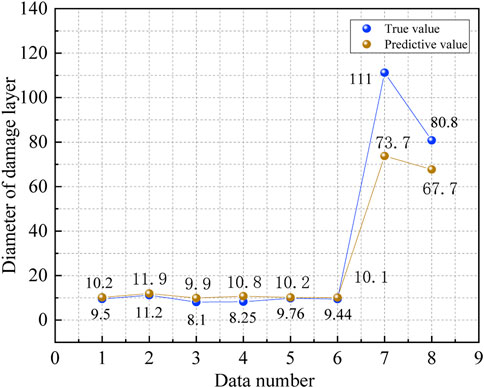
FIGURE 6. Prediction effect of damage layer diameter.
Figures 5, 6 show the prediction effect of damage layer depth and damage layer diameter, respectively. The predicted values in both figures are close to the true values, which means that the trained neural network model has a good prediction effect and can be used to predict the damage degree of composite plates. In the eight sets of data, the prediction effect of composite material 3 is worse than that of composite material 1, and the prediction effect of composite material 1 is not as good as that of composite material 2, which is mainly caused by the number of training samples and the thickness of composite materials.
4 Damage evaluation
In order to realize quantitative calculation and qualitative evaluation transformation, the ratio of damage layer depth in composite plates is calculated by Eq. 9, and the results are shown in Table 5.
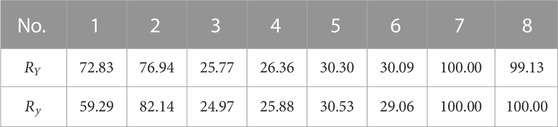
TABLE 5. Damage layer depth ratio for validation data.
Table 5 shows the true depth ratio of the damage layer and the predicted depth ratio of the damage layer. The accuracy of the prediction model is 97.23%, which can be calculated using Eq. 10. In order to realize the quantitative and qualitative conversion of the data and output the damage level reflecting the damage degree, the cloud digital eigenvalues of predicted data need to be obtained. Calculated using Eqs 11–13, the results are shown in Table 6.
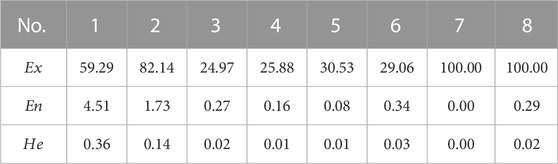
TABLE 6. Cloud digital eigenvalue.
The data in the table reflect the predicted value of the damage layer depth, the deviation between the real value and the predicted value, and the thickness of cloud droplet in the cloud image. The cloud digital eigenvalues in the aforementioned table are obtained based on the known experimental results, as shown in Table 7. Based on the data in Table 7; Eqs 15–17, the evaluation model can be obtained. Based on the trained evaluation model, four sets of evaluation data (each set of data contains five types of parameters) are input into it, and four sets of predicted cloud digital eigenvalues (Ex, En, and He) can be obtained., as shown in Table 8. Based on the data in Table 8, the true value ratio and the predicted value ratio of the evaluation data are compared, and the results are shown in Table 9. The accuracy of evaluation data is found to be 92.41% by substituting the data of Table 9 into Eq. 10 for calculation, and the results show that the cloud model can be used to predict the cloud digital characteristics of the experimental data of composite plates. By further analysis of the data in Table 8 for damage assessment, the cloud droplets can be generated using Eq. 14. The first set of data in the table is taken as an example, and its cloud droplet parameters are shown in Table 10.
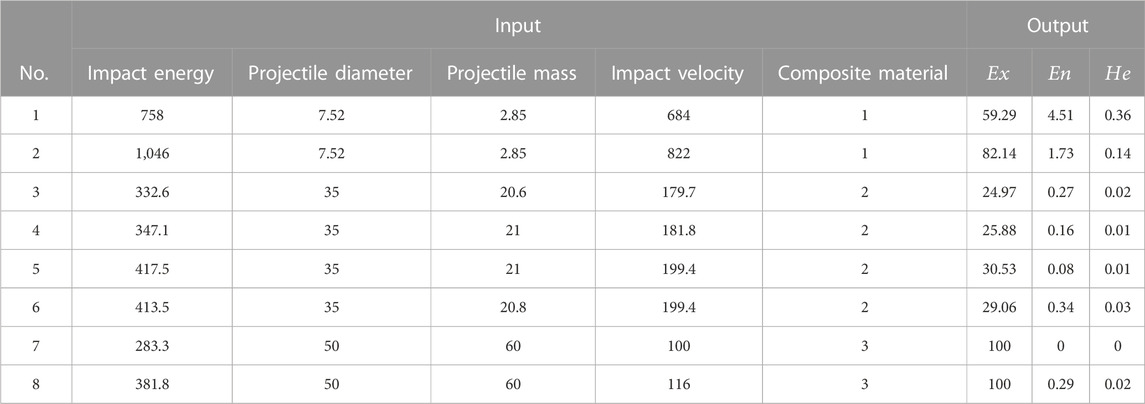
TABLE 7. Cloud model data.
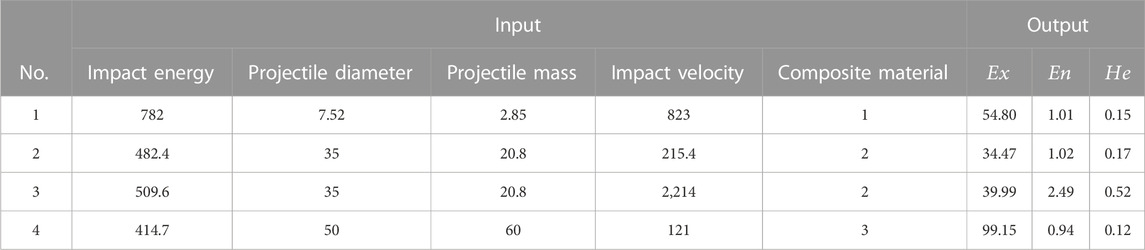
TABLE 8. Evaluation data.
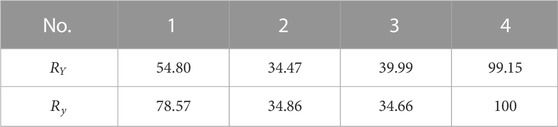
TABLE 9. Damage layer depth ratio for evaluation data.
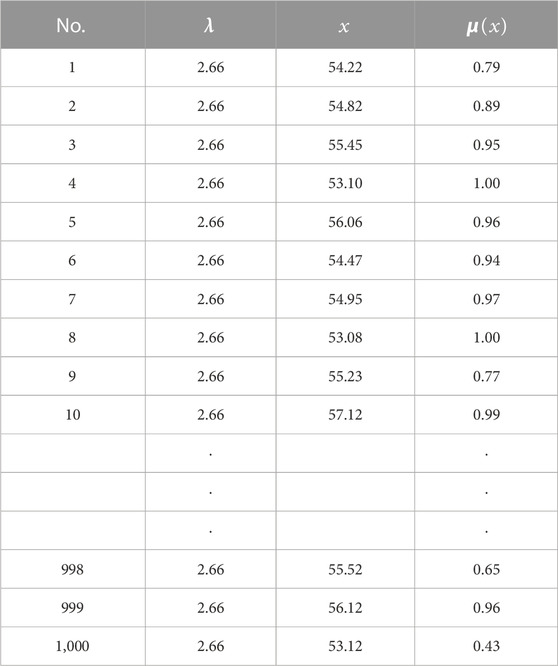
TABLE 10. Cloud droplet parameters.
In Table 10, the independent and dependent variables of each cloud droplet are given. The damage layer depth ratio is used as the independent variable and the membership degree as the dependent variable. Taking no. 1 evaluation data as an example, the evaluation cloud image based on 1,000 cloud droplets is shown in Figure 7. In Figure 7, Ex = 54.8, En = 1.01, and He = 0.15 reflect the overall damage interval, the fluctuation range of damage depth, and the possibility of fluctuation of composite plates, respectively.
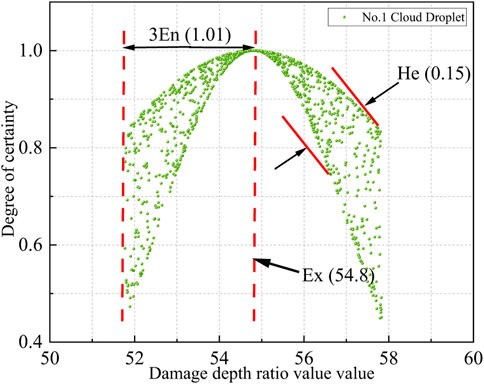
FIGURE 7. Evaluation cloud image.
By comparing the cloud evaluation image with the standard cloud image, it is found that all cloud droplets are in damage level IV (
5 Conclusion
In this paper, a composite plate damage prediction and evaluation model based on the cloud model and neural network is proposed. A total of 31 groups of data related to composite impact damage experiments are collected, and the data involved five kinds of experimental input parameters (impact energy, projectile diameter, projectile mass, impact velocity, and composite plate) and two kinds of experimental output parameters (damage layer depth and damage layer diameter). Finally, the model is analyzed to determine its prediction and evaluation effect, and the conclusions are as follows.
· This paper proposes a computing model based on the cloud model and neural network, which provides a method for predicting and evaluating the damage degree of composite plates.
· The composite damage prediction model has good prediction performance, and the comprehensive accuracy of the model is 89.85%.
· It is found that the prediction error of composite plate 1 is up to 9.37%. The damage difference between composite plate 1 and composite plate 2 is not large, but the impact energy of the former is approximately 300% that of the latter, and the thickness is only 43.75% of the latter.
Data availability statement
The original contributions presented in the study are included in the article/Supplementary Material; further inquiries can be directed to the corresponding author.
Author contributions
All authors listed have made a substantial, direct, and intellectual contribution to the work and approved it for publication.
Funding
This work was supported by the Chinese National Natural Science Fund (Grant Nos: 12227801 and U1864208), the National Science and Technology Major Project (2017-VII-0011-0106), the Fund for Innovative Research Groups of Natural Science Foundation of Hebei Province (A2020202002), the Key Program of Research and Development of Hebei Province (202030507040009), the Key Project of Natural Science Foundation of Tianjin (S20ZDF077), Science and Technology Planning Project of Tianjin (20ZYJDJC00030), Natural Science Foundation of Chongqing (cstc2021jcyj-msxmX0241 and CSTB2022NSCQ-MSX1301), and Xinjiang Production and Construction Corps Regional Innovation Guidance Program (2022BB004).
Conflict of interest
The authors declare that the research was conducted in the absence of any commercial or financial relationships that could be construed as a potential conflict of interest.
Publisher’s note
All claims expressed in this article are solely those of the authors and do not necessarily represent those of their affiliated organizations, or those of the publisher, the editors, and the reviewers. Any product that may be evaluated in this article, or claim that may be made by its manufacturer, is not guaranteed or endorsed by the publisher.
References
Anghileri, M., Castelletti, L.-M. L., Invernizzi, F., and Mascheroni, M. (2005). A survey of numerical models for hail impact analysis using explicit finite element codes. Int. J. Impact Eng. 31, 929–944. doi:10.1016/j.ijimpeng.2004.06.009
Cao, W., Deng, J., Yang, Y., Zeng, Y., and Liu, L. (2022). Water carrying capacity evaluation method based on cloud model theory and an evidential reasoning approach. Mathematics 10, 266. doi:10.3390/math10020266
Dhanisetty, V. S. V., Massart, P. F. R., Esrail, F., Verhagen, W. J. C., Kassapoglou, C., and Curran, R. (2019). Prediction of damage due to impact for composites on the basis of possible impact threats. Int. J. Impact Eng. 132, 103317. doi:10.1016/j.ijimpeng.2019.103317
Doğan, A., and Demir, E. (2022). Structural recurrent neural network models for earthquake prediction. Neural Comput. Appl. 34, 11049–11062. doi:10.1007/s00521-022-07030-w
Dolati, S., Fereidoon, A., and Sabet, A. R. (2014). Experimental investigation into glass fiber/epoxy composite laminates subjected to single and repeated high-velocity impacts of ice. Iran. Polym. J. 23, 477–486. doi:10.1007/s13726-014-0242-y
Formisano, A., Conte, S., and Papa, I. (2022). Neural network predictions of the impact behaviour of GFRP laminates. J. Braz. Soc. Mech. Sci. Eng. 44, 245. doi:10.1007/s40430-022-03554-3
Gao, Z., Ma, D., Guo, X., Wang, W., and Wang, Z. (2019). The comprehensive assessment method of concrete damage after disastrous fire based on game theory-normal cloud model. Math. Problems Eng. 2019, 1–9. doi:10.1155/2019/5159497
Gu, X. B., Wu, S. T., Ji, X. J., Zhu, Y. H., and Oliveto, G. (2021). The risk assessment of debris flow hazards in banshanmen gully based on the entropy weight-normal cloud method. Adv. Civ. Eng. 2021, 1–11. doi:10.1155/2021/8841310
Hosoi, M., Mizuno, M., and Shi, J. (2017). Evaluation of material properties and internal damage within CFRP and CFRP/Al sandwich panels due to impact loading. J. Mech. Sci. Technol. 31, 4079–4084. doi:10.1007/s12206-017-0803-z
Hou, N., Zhao, R., Li, J., Wang, X., Li, X., Cui, H., et al. (2022). Impact damage of composite laminates with high-speed waterjet. Int. J. Impact Eng. 167, 104276. doi:10.1016/j.ijimpeng.2022.104276
Huang, J., Zeng, X., Fu, J., Han, Y., and Chen, H. (2022). Safety risk assessment using a BP neural network of high cutting slope construction in high-speed railway. Buildings 12, 598. doi:10.3390/buildings12050598
Jordan, J. B., and Naito, C. J. (2014). An experimental investigation of the effect of nose shape on fragments penetrating GFRP. Int. J. Impact Eng. 63, 63–71. doi:10.1016/j.ijimpeng.2013.08.002
Koopialipoor, M., Noorbakhsh, A., Ghaleini, E., Armaghani, D., and Yagiz, S. (2019). A new approach for estimation of rock brittleness based on non-destructive tests. Nondestruct. Test. Eval. 34, 354–375. doi:10.1080/10589759.2019.1623214
Li, Z., Wang, Y., Olgun, C. G., Yang, S., Jiao, Q., and Wang, M. (2020). Risk assessment of water inrush caused by karst cave in tunnels based on reliability and GA-BP neural network. Geomatics, Nat. Hazards Risk 11, 1212–1232. doi:10.1080/19475705.2020.1785956
Liang, X., Liang, W., Zhang, L., and Guo, X. (2019). Risk assessment for long-distance gas pipelines in coal mine gobs based on structure entropy weight method and multi-step backward cloud transformation algorithm based on sampling with replacement. J. Clean. Prod. 227, 218–228. doi:10.1016/j.jclepro.2019.04.133
Liu, D., Wang, D., Wu, J., Wang, Y., Wang, L., Zou, X., et al. (2014). A risk assessment method based on RBF artificial neural network - cloud model for urban water hazard. J. Intelligent Fuzzy Syst. 27, 2409–2416. doi:10.3233/ifs-141210
Liu, L., Wei, F., and Zhou, S. (2019). Major project risk assessment method based on BP neural network. Discrete Continuous Dyn. Syst. - S 12, 1053–1064. doi:10.3934/dcdss.2019072
Luo, G., Mo, Y., Wu, C., Zhang, F., Liu, L., and Chen, W. (2020). Experimental study of ice impact on aluminium/carbon fiber reinforced composite dual plate. Int. J. Crashworthiness 27, 510–521. doi:10.1080/13588265.2020.1816438
Maynard, E., and Harris, D. (2022). Using neural networks to predict high-risk flight environments from accident and incident data. Int. J. Occup. Saf. Ergon. 28, 1204–1212. doi:10.1080/10803548.2021.1877455
Oliveira, B. C. F., Seibert, A. A., Borges, V. K., Albertazzi, A., and Schmitt, R. H. (2020). Employing a U-net convolutional neural network for segmenting impact damages in optical lock-in thermography images of CFRP plates. Nondestruct. Test. Eval. 36, 440–458. doi:10.1080/10589759.2020.1758099
Pérez, M. A., Pernas-sánchez, J., Artero-guerrero, J. A., and Serra-lópez, R. (2021). High-velocity ice impact damage quantification in composite laminates using a frequency domain-based correlation approach. Mech. Syst. Signal Process. 147, 107124. doi:10.1016/j.ymssp.2020.107124
Wang, D., Liu, D., Ding, H., Singh, V. P., Wang, Y., Zeng, X., et al. (2016). A cloud model-based approach for water quality assessment. Environ. Res. 148, 24–35. doi:10.1016/j.envres.2016.03.005
Wang, Z., Zhao, M., Liu, K., Yuan, K., and D, J. H. (2022). Experimental analysis and prediction of CFRP delamination caused by ice impact. Eng. Fract. Mech. 273, 108757. doi:10.1016/j.engfracmech.2022.108757
Wei, Q., Zhu, L., Zhu, J., Zhuo, L., Hao, W., and Xie, W. (2020). Characterization of impact fatigue damage in CFRP composites using nonlinear acoustic resonance method. Compos. Struct. 253, 112804. doi:10.1016/j.compstruct.2020.112804
Wu, Z., and Zou, S. (2020). A static risk assessment model for underwater shield tunnel construction. Sādhanā 45, 215. doi:10.1007/s12046-020-01370-w
Xie, W., Zhang, W., Kuang, N., Li, D., Huang, W., Gao, Y., et al. (2016). Experimental investigation of normal and oblique impacts on CFRPs by high velocity steel sphere. Compos. Part B Eng. 99, 483–493. doi:10.1016/j.compositesb.2016.06.020
Xu, Q., and Xu, K. (2018). Assessment of air quality using a cloud model method. R. Soc. Open Sci. 5, 171580. doi:10.1098/rsos.171580
Xue, Y., Li, Z., Li, S., Qiu, D., Su, M., Xu, Z., et al. (2018). Water inrush risk assessment for an undersea tunnel crossing a fault: An analytical model. Mar. Georesources Geotechnol. 37, 816–827. doi:10.1080/1064119x.2018.1494230
Yang, B., Fu, K., Lee, J., and Li, Y. (2021). Artificial neural network (ANN)-Based residual strength prediction of carbon fibre reinforced composites (CFRCs) after impact. Appl. Compos. plate 28, 809–833. doi:10.1007/s10443-021-09891-1
Yang, C. X., Gao, Y., Guo, W. N., Yang, Y. H., Xu, P., and Alqahtani, M. S. (2022). High velocity impact behaviour of curved GFRP composites for rail vehicles Experimental and numerical study. Polym. Test. 116, 107774. doi:10.1016/j.polymertesting.2022.107774
Zhang, M. (2021). Prediction of rock burst hazard based on particle swarm algorithm and neural network. Neural Comput. Appl. 34, 2649–2659. doi:10.1007/s00521-021-06057-9
Zhao, D., Li, C., Wang, Q., and Yuan, J. (2020). Comprehensive evaluation of national electric power development based on cloud model and entropy method and topsis: A case study in 11 countries. J. Clean. Prod. 277, 123190. doi:10.1016/j.jclepro.2020.123190
Zhao, J., Tian, J., Meng, F., Zhang, M., and Wu, Q. (2022). Safety assessment method for storage tank farm based on the combination of structure entropy weight method and cloud model. J. Loss Prev. Process Industries 75, 104709. doi:10.1016/j.jlp.2021.104709
Keywords: projectile damage, damage prediction, neural network, cloud model, machine learning, composite plates
Citation: Zeng X, Hu N, Liu Y, He J, Shang X, Ning H and Shao L (2023) Prediction and evaluation of projectile damage in composite plates using the neural network–cloud model. Front. Mater. 10:1164090. doi: 10.3389/fmats.2023.1164090
Received: 12 February 2023; Accepted: 27 March 2023;
Published: 13 April 2023.
Edited by:
Ruzhuan Wang, Chongqing University of Science and Technology, ChinaReviewed by:
Chuyang Luo, Donghua University, ChinaShaojun Zhu, Tongji University, China
Borui Zheng, Xi’an University of Technology, China
Copyright © 2023 Zeng, Hu, Liu, He, Shang, Ning and Shao. This is an open-access article distributed under the terms of the Creative Commons Attribution License (CC BY). The use, distribution or reproduction in other forums is permitted, provided the original author(s) and the copyright owner(s) are credited and that the original publication in this journal is cited, in accordance with accepted academic practice. No use, distribution or reproduction is permitted which does not comply with these terms.
*Correspondence: Ning Hu, bmluZ2h1QGNxdS5lZHUuY24=