 Qingyuan Yang1
 Song Chen
- 1School of Architecture and Engineering, Guangzhou Panyu Polytechnic, Guangzhou, China
- 2Hebei Key Laboratory of Optoelectronic Information and Geo-detection Technology, Hebei GEO University, Shijiazhuang, China
- 3College of Urban Geology and Engineering, Hebei GEO University, Shijiazhuang, China
Studying the surface settlement caused by foundation pit dewatering has certain practical significance for engineering construction. When the aquifer in the foundation pit is located within a large burial depth range, the impermeable wall does not completely separate the water layer, resulting in water inside and outside the foundation pit communicating around the bottom of the impermeable wall. Taking the foundation pit project of a subway station in Shenzhen as the background, model experiments were conducted to reveal the changes in water level outside the pit caused by precipitation under different conditions inside the pit. (1) Considering the influence of surrounding seepage, the precipitation curve outside the pit presents a concave and then convex form, which is different from the Dupuit theory precipitation curve. (2) For large foundation pit dewatering in layered soil, the downward trend of the dewatering curve outside the foundation pit decreases with the increase of soil depth. (3) Compared to vertical reinjection in close proximity to dense buildings, inclined reinjection has a smaller impact on the side adjacent to the retaining wall, while it is far away from the retaining wall, with a larger impact range. The full well deep reinjection well with an angle of 20° from the vertical direction has the largest reinjection range and the best reinjection effect. It provides a research basis for reasonable control and prevention of surface settlement and adverse deformation of diaphragm walls in narrow spaces under subsequent surrounding seepage conditions.
1 Introduction
At present, scholars, both domestically and internationally, have conducted extensive research on foundation pit dewatering based on the Dupuit theory, which assumes that the water flow in the dewatering well during the dewatering process is horizontal. Infiltration of water in rock and soil is a complex migration process (Bai et al., 2021).
Meinzer (1928) paid attention to and studied the unstable movement of groundwater and the water storage properties of confined aquifers. Li et al. (2020) evaluated the surface settlement near the drawdown well using statistical analysis and numerical simulation, as well as a layered summation method based on the principle of effective stress. The evaluation values were too high, and it was recommended to use coefficients for correction. Xu et al. (2014, 2019) studied the effects of the depth of the well filter screen and the cutoff depth of the water stop curtain on precipitation-induced deformation in aquifers through indoor experiments and numerical simulation. Zeng et al. (2019) investigated the mechanism of support lateral displacement caused by pre-precipitation through engineering measurement and numerical simulation. Wu et al. (2020) studied the characteristics and influencing factors of settlement outside the foundation pit caused by leakage of the water-stop curtain during foundation pit dewatering through numerical simulation. Zhang et al. (2018) found through field measurement and analysis of four foundation pit projects in Singapore that when the water level outside the pit decreases during precipitation, the deformation of the support structure is small and the settlement outside the pit is large. Roy and Robinson (2009) studied the surface settlement of soft soil sites caused by bedrock drainage. Huang et al. (2009) proposed an evaluation method for ground settlement caused by foundation pit dewatering in specific areas. Wang et al. (2009) proposed a calculation method for precipitation-induced settlement of deep foundation pits in subway stations. Yuan and Zhang (2013) proposed an estimation method for ground settlement caused by precipitation under the constraint of lateral friction. Wu and Zhu (2016) proposed a calculation method for ground settlement caused by foundation pit dewatering considering the influence of unsaturated soil in the drainage zone.
When the aquifer where the foundation pit is located is deeply buried, the aquifer is not completely isolated by the diaphragm wall. The water inside and outside the foundation pit flows around the bottom of the diaphragm wall, meaning that the water flow will move horizontally and vertically. Therefore, it is speculated that there will be some differences between the dewatering law of the foundation pit and the aforementioned research results under the influence of the surrounding seepage. Many studies have been conducted on the technology and theory of groundwater recharge outside the foundation pit to control the water level outside the pit and ground settlement (Yu and Gong, 2001; Wang et al., 2012; Zheng et al., 2014; Gambolati and Teatini, 2015; Huang et al., 2015; Zhang et al., 2017), which are all based on vertical recharge. When the foundation pit site is close to dense buildings, only a single row of recharge wells can be arranged between the foundation pit and the building, which cannot meet the requirements for the water level recharge range.
Taking the foundation pit project of a subway station in Shenzhen as an example and using model test methods to study and explore the changes in water level outside the pit caused by precipitation in the pit under different conditions under the influence of surrounding leakage, this paper compares and analyzes the vertical recharge and the inclined recharge with an angle of 10° and 20° from the vertical direction and proposes a recharge strategy suitable for small and narrow spaces. It provides a research basis for reasonable control and prevention of surface settlement and adverse deformation of diaphragm walls in narrow spaces under subsequent surrounding seepage conditions.
2 Design of model tests
The geometric similarity constant, the gravitational acceleration similarity constant, and the density similarity constant are determined as Cl = 1/50, Cρ = 1, and Cg = 1, respectively. Other relevant similarity constants of this test can be obtained by the traditional dimensional analysis method.
2.1 The practical engineering cases
The length, width, and buried depth of the subway station foundation pit are 365 m, 25 m, and 32 m, respectively. Two dewatering wells are arranged every 15 m along the long side of the foundation pit, and the distance between the dewatering wells along the width of the foundation pit is also 15 m. Considering the limitations of the test site, the two rows of dewatering wells in the middle of the foundation pit were selected for the test.
2.2 Design of formation material
The model test in this paper selected 40 orders of refined quartz sand with 150 and 300 orders of quartz sand powder to, respectively, make the mass matching and obtained the matching result meeting the similar proportion, as shown in Table 1.
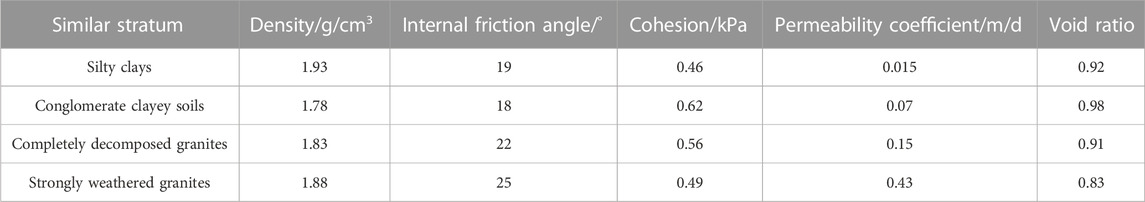
TABLE 1. Physical and mechanical parameters of similar strata.
2.3 Design of similar material of diaphragm wall
Based on the separation similarity design theory, upon the test, the PMMA material was selected as the material similar in structure to the underground continuous wall, and the PMMA sheet model of 11 mm thickness was obtained through calculation according to the similarity equivalence principle of flexural stiffness. A partly station foundation pit structure was considered for the test.
2.4 Design of the test model box
The multi-functional PMMA testing apparatus was applied as the test model tank, with main test dimensions of 2 m (length) × 1.8 m (width) × 1.2 m (height). Around the model tank, the water tank was separated from the main testing apparatus by a clapboard with small holes, which can meet water replenishment requirement upon the test for the main part.
2.5 Design of the test pumping system
The precipitation and observation well tubes are made of PVC spool with an outer diameter of 20 mm. The whole pumping system consists of a suction pump, suction pipe, pump output control valve, and pumping filter screen.
2.6 Preparation before the precipitation test
For every 10 cm of layer material laid, the layer should be immediately compacted. By injecting water from the top of the water tank into the test water tank, the soil layer is saturated from the bottom to top. As certain settlement deformation may occur after saturation inside the soil layer, it is required to continue filling the soil to the required height. Only after 1–2 times of saturation and filling processes, the continued filling and installation of instruments and soil can be monitored, until filling to the height of 1.1 m as required by the test. Upon solidification of the soil layer in the test tank, the water tanks and main tank around shall maintain the water level at a height of 1.1 m. As the formation solidifies under the weight force, when the reading change of the displacement meter at the settlement observation point on the soil layer surface is less than 0.001 mm/d, it shows that the soil layer solidification was basically accomplished. At the time, the model test had achieved the initial status prior to the construction and meets the precipitation test condition.
The layout plan and section of the foundation pit dewatering model test are shown in Figures 1–4. At 0.1 m, 0.25 m, 0.4 m, 0.55 m, 0.7 m, and 0.85 m away from the exterior of the diaphragm wall, measurement points 1–6 are set in the direction of the line connecting 1# and 3#, and measurement points 7 to 12 are set in the direction of the line connecting 2# and 4#. At measurement points 1 to 6 and measurement points 7 to 12, a single pore water pressure gauge is arranged along the depth direction of the model box at the burial depth of 0.07 m, 0.22 m, 0.37 m, and 0.52 m, mainly to monitor the variation of pore water pressure at different distances from the exterior of the foundation pit and the diaphragm wall.
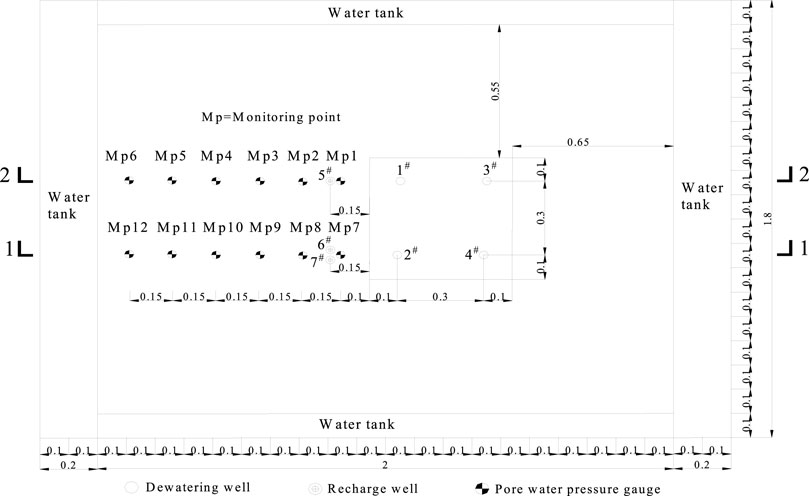
FIGURE 1. Layout diagram of the test.
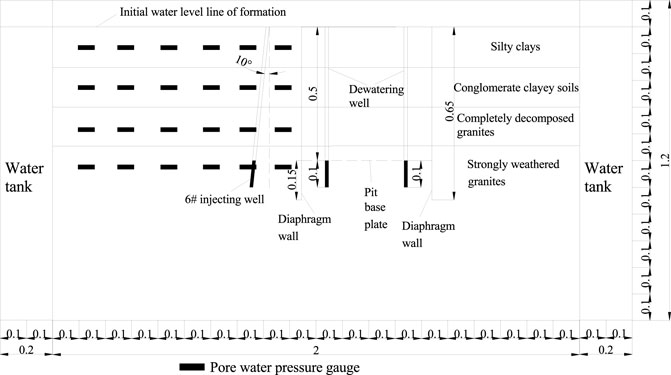
FIGURE 2. 1–1 profile of the test.
FIGURE 3. 1–1 profile of the test.
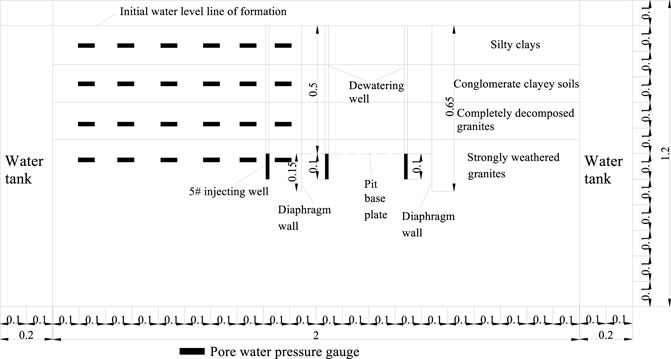
FIGURE 4. 2–2 profile of the test.
The foundation pit of the subway hub is relatively close to the surrounding buildings, and the foundation of the buildings is mostly pile foundations with a relatively significant burial depth. Therefore, when conducting an inclined recharge, the inclination angle should not be too large, and generally the included angle with the vertical direction should not exceed 20°. Otherwise, the existing building foundation will be affected by the construction of the dewatering well, and may even be damaged. The dewatering well is set in the middle of the building and the foundation pit connecting wall, and in the test, it is set at a distance of 0.15 m from the connecting wall. As shown in Figures 2, 4, wells 5 #, 6 #, and 7 # are vertical recharge wells and inclined recharge wells with an angle of 10° and 20° from the vertical direction. Precipitation and reinjection shall be conducted simultaneously, and the reinjection amount shall be taken as 1/2 of the pumping amount.
3 Experimental study on water level change outside the pit caused by precipitation in the pit
Test condition 1: Dewatering of single well in the foundation pit with large drop depth (with a drop depth of 0.5 m).
Test condition 2: Dewatering of double wells in the foundation pit with large drop depth (with a drop depth of 0.5 m).
Test condition 3: Dewatering in single well in the foundation pit by layers (with a drop depth of 0.15 m, 0.25 m, 0.35 m, and 0.5 m).
Test condition 4: Dewatering in double wells in the foundation pit by layers (with a drop depth of 0.15 m, 0.25 m, 0.35 m, and 0.5 m).
3.1 Analysis of test results in condition 1
After decreasing to the specified depth and stabilizing the precipitation, the pore water pressure monitoring data for different burial depths at measurement points 1 to 6 are collated and analyzed to obtain the time-history change curve of pore water pressure for different burial depths outside the foundation pit, as shown in Figure 5.
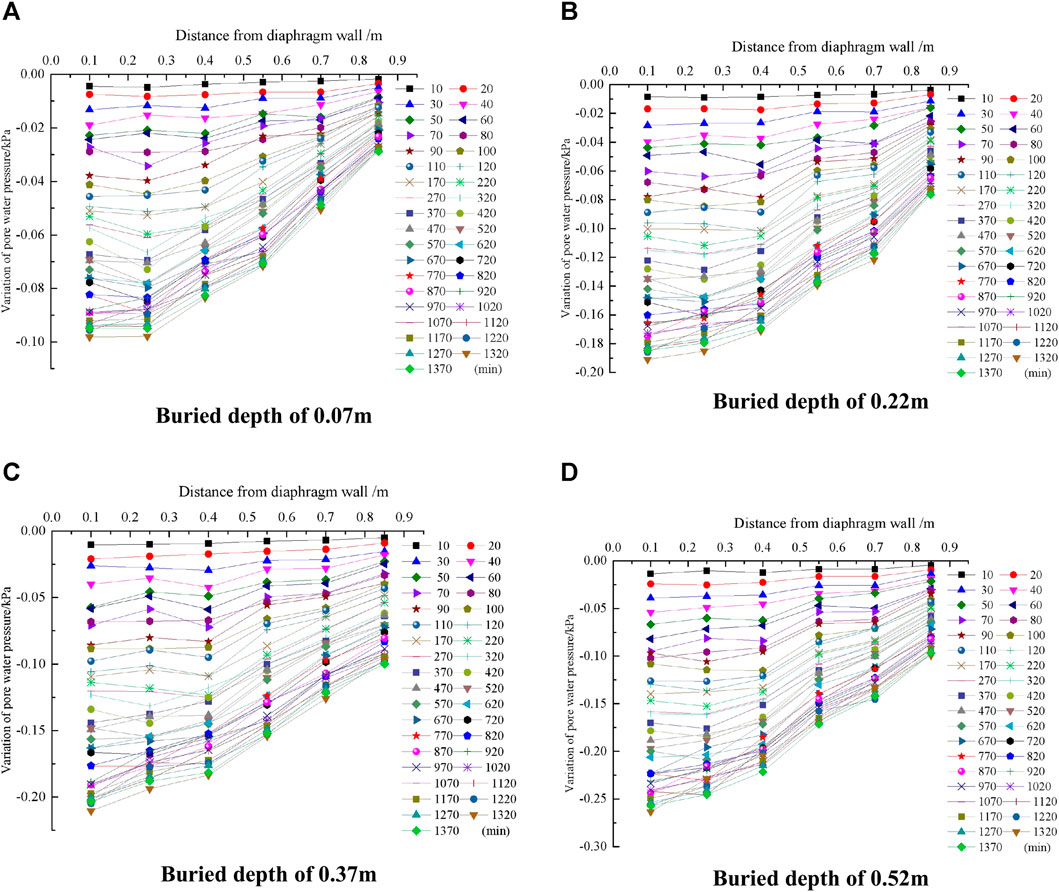
FIGURE 5. Time-history curves of pore water pressure in different depths.
From Figure 5, it can be seen that within the depth range of the underground continuous wall, as the soil depth increases, the variation value of pore water pressure outside the foundation pit increases, and the variation value of pore water pressure at the bottom of the underground continuous wall is the largest. This is due to the influence of seepage around the bottom of the diaphragm wall, which generates horizontal and vertical water flow, leading to an increase in the depth of incomplete well precipitation and an increase in the degree of precipitation impact at the bottom of the diaphragm wall. The precipitation curve outside the diaphragm wall has a similar form to that of the homogeneous formation, both of which are “concave first and then convex upward.” Within the depth range of the diaphragm wall, as the depth of the soil layer increases, the concave amplitude of the precipitation curve outside the foundation pit decreases, and the concave amplitude of the precipitation curve at the bottom of the diaphragm wall is the smallest. It indicates that under the influence of infiltration, the study of precipitation outside the pit does not follow the Dupuit precipitation curve.
3.2 Analysis of test results in condition 2
After decreasing to the specified depth and stabilizing the precipitation, the pore water pressure monitoring data for different burial depths at measurement points 1 to 6 are collated and analyzed to obtain the time-history change curve of pore water pressure for different burial depths outside the foundation pit, as shown in Figure 6.
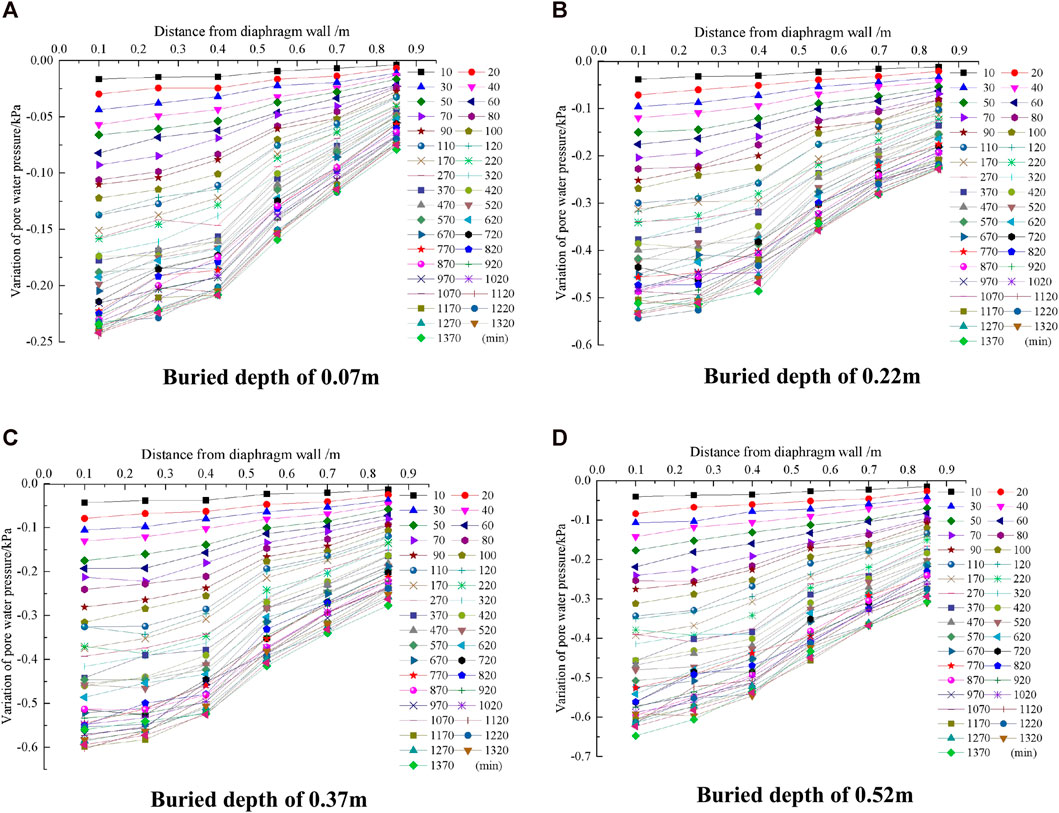
FIGURE 6. Time-history curves of pore water pressure in different depths.
From Figure 6, it can be seen that the variation pattern of pore water pressure outside the pit caused by double-well precipitation and single-well precipitation is similar, within the depth range of the anti-seepage wall, as the soil layer depth increases, the variation value of pore water pressure outside the pit increases, and the variation value of pore water pressure at the bottom of the diaphragm wall is the largest. The form of the precipitation curve outside the diaphragm wall is also “first concave and then slightly convex.” Within the depth range of the diaphragm wall, as the depth of the soil layer increases, the concave amplitude of the precipitation curve outside the foundation pit decreases, and the concave amplitude of the precipitation curve at the bottom of the diaphragm wall is the smallest.
After stable precipitation, the variation value of precipitation outside the foundation pit caused by double-well precipitation with different burial depths is 2–3 times greater than the variation value of pore water pressure outside the foundation pit caused by single-well precipitation. It can be seen that the variation of water level outside the foundation pit caused by double-well precipitation cannot be simply considered the superposition of two single-well precipitation, but will produce a superposition increase effect. Therefore, when multiple-well precipitation is used, the influence of the superposition increase effect should be considered.
3.3 Analysis of test results in condition 3
After decreasing to the specified depth and stabilizing the precipitation, the pore water pressure monitoring data for different depths at measurement points 1–6 are collated and analyzed to obtain the pore water pressure change curve for different depths after stabilizing the precipitation outside the foundation pit, as shown in Figure 7.
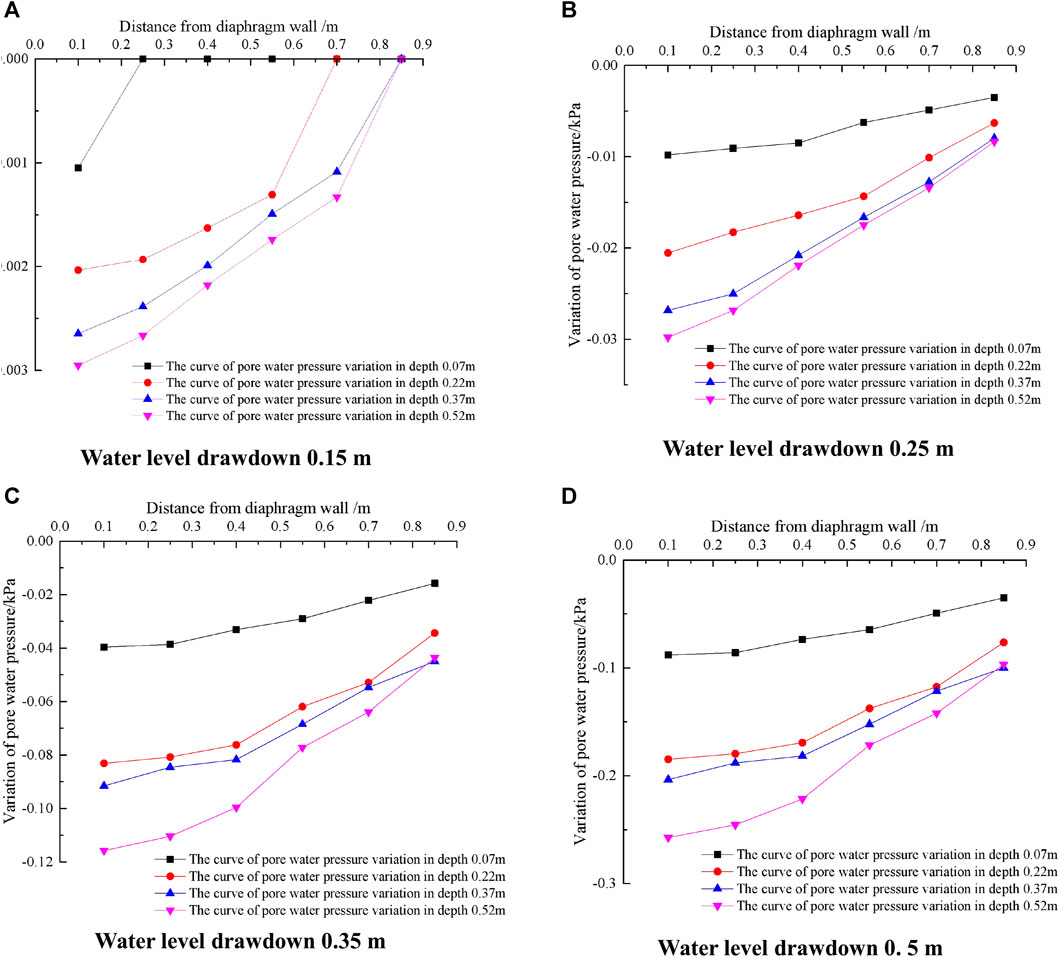
FIGURE 7. Variation curves of pore water pressure in each soil layer of different drawdown.
From Figure 7, it can be seen that as the water level decreases, the variation values of pore water pressure in various soil layers outside the underground continuous wall gradually increase. Among them, the variation value of pore water pressure in strongly weathered granite similar strata is the largest, with a drawdown of 0.15 m, and the maximum variation value of pore water pressure is 0.003 kPa. The ratio to the maximum variation value of pore water pressure in this stratum with large drawdown is 0.012, with a drawdown of 0.25 m, and the maximum variation value of pore water pressure is 0.033 kPa. The ratio to the maximum variation value of pore water pressure in the deep drawdown of this formation is 0.115, the drawdown is 0.35 m, the maximum variation value of pore water pressure is 0.12 kPa, and the ratio to the maximum variation value of pore water pressure in the deep drawdown of this formation is 0.46. It can be seen that within the burial depth range of the diaphragm wall, the variation amplitude of pore water pressure increases with the increase in the burial depth.
3.4 Analysis of test results in condition 4
After decreasing to the specified depth and stabilizing the precipitation, the pore water pressure monitoring data for different depths at measurement points 1 to 6 were collated and analyzed, and the variation curve of pore water pressure for different depths outside the foundation pit after stabilizing the precipitation was obtained, as shown in Figure 8.
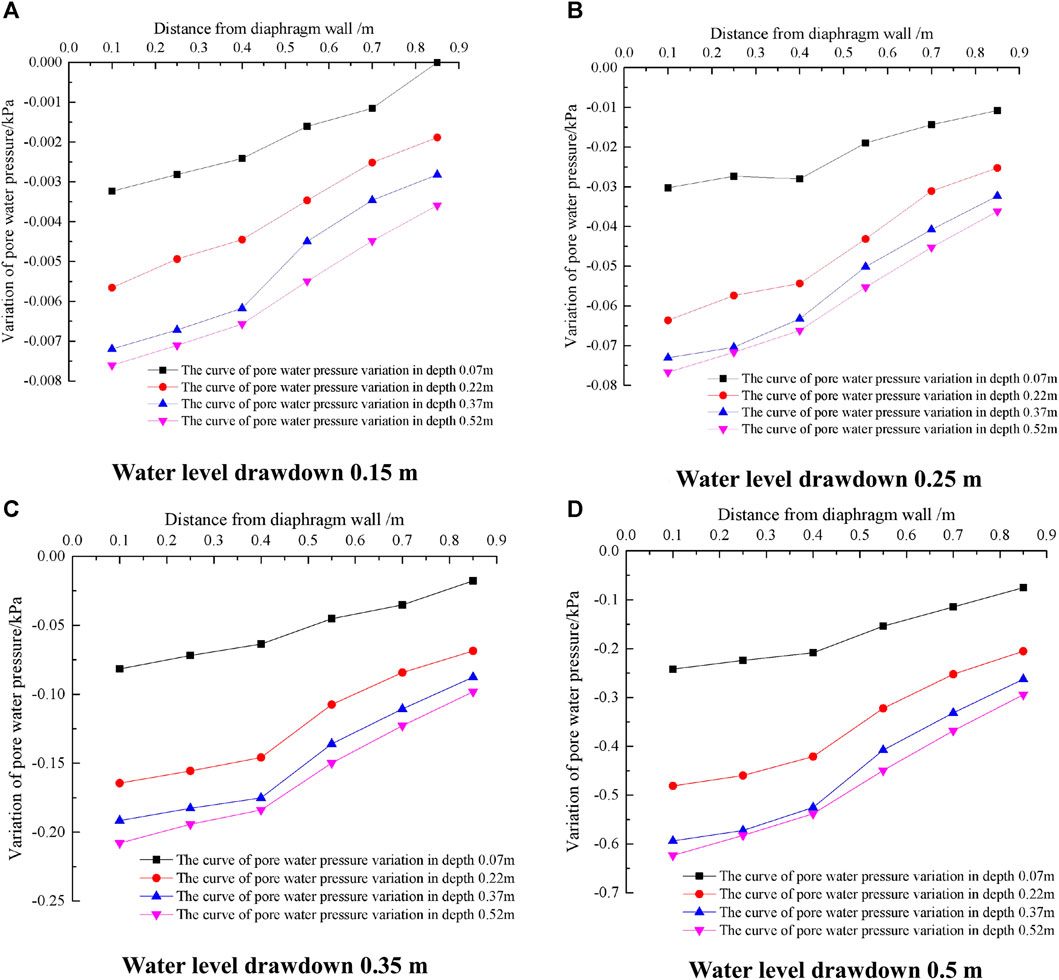
FIGURE 8. Variation curves of pore water pressure in each soil layer of different drawdown.
From Figure 8, it can be seen that as the depth decreases, the variation range of pore water pressure in various soil layers outside the anti-seepage wall gradually increases. Among them, the pore water pressure in strongly weathered granite formations changes the most, with a depth decrease of 0.15 m and a maximum change of 0.007 kPa. The ratio to the maximum variation of pore water pressure in this stratum with a large drawdown is 0.011, with a drawdown of 0.25 m and a maximum variation of 0.075 kPa. The ratio to the maximum variation value of pore water pressure in the deep drawdown of this formation is 0.121, the drawdown is 0.35 m, the maximum variation value of pore water pressure is 0.22 kPa, and the ratio to the maximum variation value of pore water pressure in the deep drawdown of this formation is 0.35. It can be seen that the variation law of the water level outside the pit caused by dual-well layered precipitation is similar to that caused by single-well layered precipitation. Within the burial depth range of the diaphragm wall, the variation range of pore water pressure increases with the increase in the burial depth.
For typical strata in Shenzhen, when the first layer of precipitation is conducted, the variation range of pore water pressure is relatively small. Starting from the second layer of precipitation, the variation range of pore water pressure gradually increases, and the changes in the surrounding environment caused by the changes in pore water pressure also increase. Therefore, starting from the second layer of precipitation, monitoring and analysis of changes in pore water pressure should be strengthened.
4 Experimental study on water level change and deformation caused by dewatering in the foundation pit and reinjection outside the foundation pit
Test condition 1: Dewatering at a large depth within the foundation pit (with a drop depth of 0.5 m) and reinjection at a depth of 1/2 well outside the foundation pit.
Test condition 2: Dewatering at a large depth within the pit (with a drop depth of 0.5 m) and deep reinjection of the entire well outside the foundation pit.
Test condition 3: Dewatering at a large depth within the pit (with a drop depth of 0.5 m) and inclined recharge with an angle of 10° from the vertical direction outside the foundation pit.
Test condition 4: Dewatering at a large depth within the pit (with a drop depth of 0.5 m) and inclined recharge with an angle of 20° from the vertical direction outside the foundation pit.
Test condition 5: Dewatering shall be conducted in layers within the foundation pit (with a drop depth of 0.15 m, 0.25 m, 0.35 m, and 0.5 m), while reinjection shall be conducted at 1/2 well depth outside the foundation pit.
Test condition 6: Dewatering shall be conducted in layers within the foundation pit (with a drop depth of 0.15 m, 0.25 m, 0.35 m, and 0.5 m), while the entire well depth outside the foundation pit shall be reinjected.
Test condition 7: Dewatering shall be conducted in layers within the foundation pit (with a drop depth of 0.15 m, 0.25 m, 0.35 m, and 0.5 m), and the angle between the outside of the foundation pit and the vertical direction was 10° inclined for reinjection.
Test condition 8: Dewatering shall be conducted in layers within the foundation pit (with a drop depth of 0.15 m, 0.25 m, 0.35 m, and 0.5 m), and the angle between the outside of the foundation pit and the vertical direction was 20° inclined for reinjection.
4.1 Analysis of test results in condition 1
After decreasing to the specified depth and stabilizing the dewatering and reinjection processes, the pore water pressure monitoring data for different burial depths at measurement points 1–6 were collated and analyzed, and the time-history variation curve of pore water pressure for different burial depths outside the foundation pit was obtained, as shown in Figure 9.
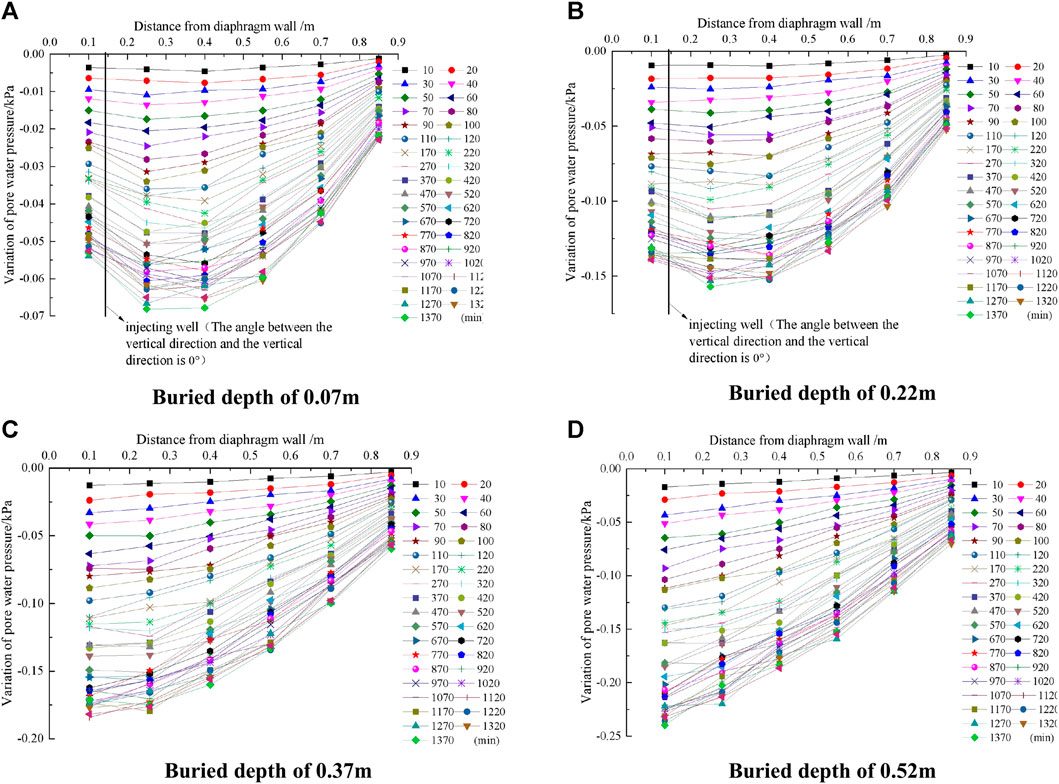
FIGURE 9. Time-history curves of pore water pressure in different depths.
From Figure 9, it can be seen that during the reinjection process at 1/2 well depth, the variation of pore water pressure in the soil layer within the reinjection depth is significantly affected by reinjection. Within the reinjection depth, when the precipitation reinjection is stable, the negative variation value of pore water pressure gradually decreases toward the ground wall side of the reinjection well, and when the precipitation reinjection is stable, the maximum negative variation value is 0.13 kPa. When the precipitation reinjection is stable, the negative variation value of pore water pressure gradually decreases away from the ground wall side. When the precipitation recharge is stable, the maximum negative change occurs in the stratum with a burial depth of 0.22 m, which is 0.16 kPa, which is only reduced by 0.03 kPa compared to no recharge. The variation value of pore water pressure in the outer layer at the depth of reinjection is basically the same as that without reinjection. During the process of reinjection, the length of the reinjection well plays a crucial role in the depth of soil layer reinjection. If the length of the reinjection well is insufficient, that is, the depth of the reinjection well is less than the depth of the precipitation well, it will not be able to effectively carry out soil layer reinjection, and the improvement effect on surface settlement caused by groundwater recharge and precipitation is insufficient.
4.2 Analysis of test results in condition 2
After decreasing to the specified depth and stabilizing the dewatering and reinjection processes, the pore water pressure monitoring data for different burial depths at measurement points 1 to 6 were collated and analyzed, and the time-history variation curve of pore water pressure for different burial depths outside the foundation pit was obtained, as shown in Figure 10.
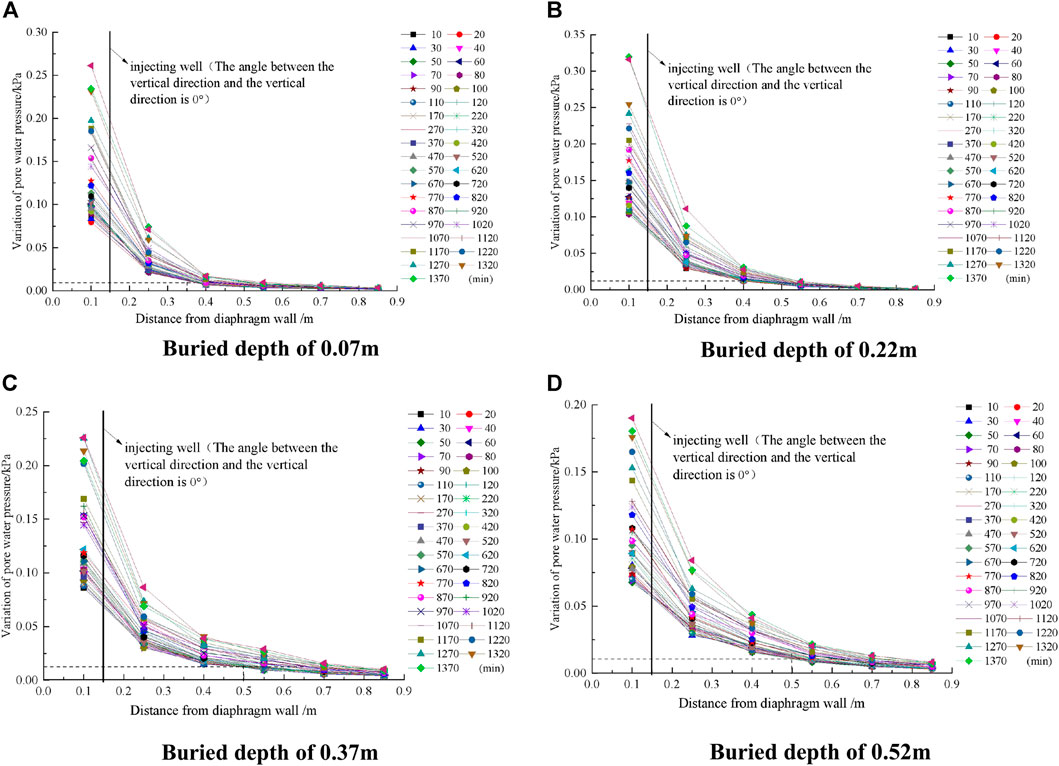
FIGURE 10. Time-history curves of pore water pressure in different depths.
From Figure 10, it can be seen that when the vertical full well is reinjected at a significant depth, the impact on the reinjection of different burial depths within the reinjection depth range is significant. On the side of the reinjection well adjacent to the diaphragm wall, the positive change value of pore water pressure gradually increases toward the diaphragm wall. When the precipitation reinjection is stable, the maximum positive change values of the strata with different burial depths are 0.08 kPa, 0.1 kPa, 0.07 kPa, and 0.06 kPa, respectively. On the side away from the diaphragm wall, the positive change value of pore water pressure in different burial depths gradually decreases. When precipitation recharge is stable, the maximum positive change values in different buried depths are 0.025 kPa, 0.025 kPa, 0.03 kPa, and 0.04 kPa. When the positive change value of pore water pressure is less than 0.0125 kPa after the stabilization of precipitation reinjection, the water level of the soil layer is less affected by reinjection. It can be considered that the horizontal distance between the reinjection well and the corresponding formation position with the positive change value of pore water pressure of 0.0125 kPa is the main influence range of reinjection, and the average main influence range of reinjection for different burial depths of soil layers on the side away from the diaphragm wall is 0.3 m.
When the length of the recharge well is the same as the length of the precipitation well, it can provide certain recharge to groundwater and have a certain improvement effect on surface subsidence caused by precipitation. At the same time, vertical recharge can cause a significant increase in groundwater level in the area adjacent to the diaphragm wall, resulting in significant recharge effects. However, it can also cause significant uplift and deformation of the soil on the side adjacent to the diaphragm wall. For the side far from the ground wall, the range of recharge is small, and the increase in groundwater level caused by recharge is limited.
4.3 Analysis of test results in condition 3
After decreasing to the specified depth and stabilizing the dewatering and reinjection processes, the pore water pressure monitoring data for different burial depths at measurement points 7 to 12 were collated and analyzed, and the time-history variation curve of pore water pressure for different burial depths outside the foundation pit was obtained, as shown in Figure 11.
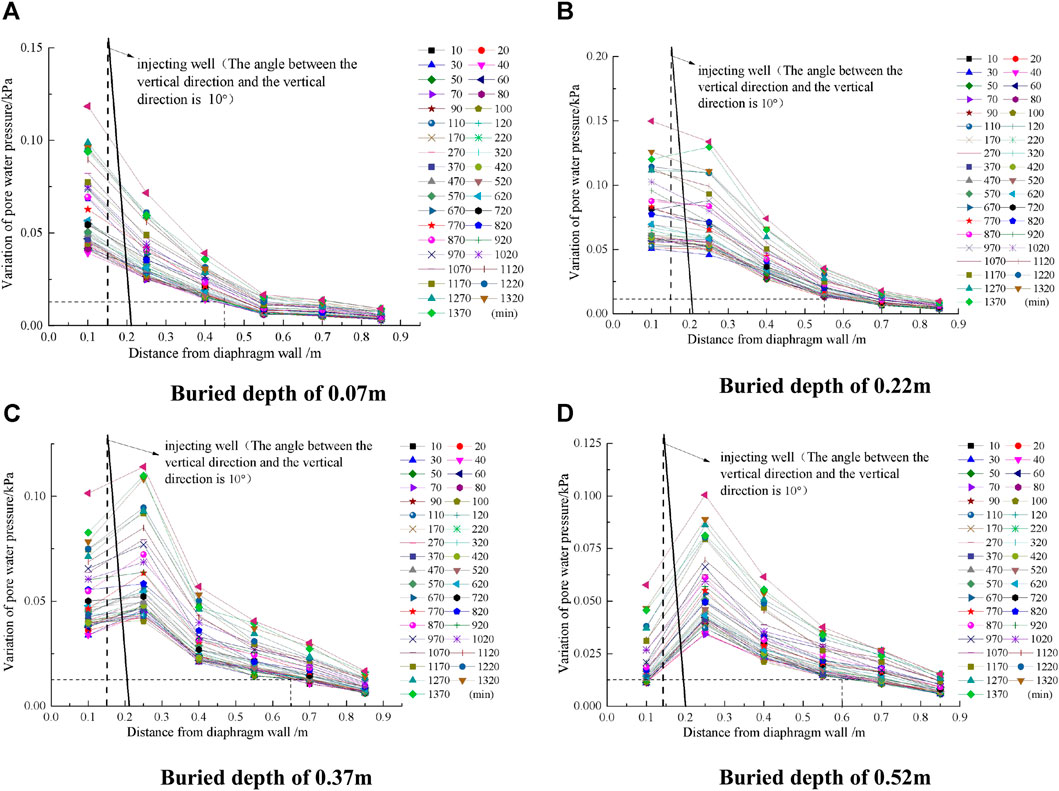
FIGURE 11. Time-history curves of pore water pressure in different depths.
From Figure 11, it can be seen that when reinjection is carried out at a full well depth at an angle of 10° to the vertical direction, the impact of reinjection on different burial depths within the reinjection depth range is significant. On the side of the reinjection well adjacent to the diaphragm wall, the positive change value of pore water pressure gradually decreases toward the diaphragm wall. When precipitation reinjection is stable, the maximum positive change values of the strata with different burial depths are 0.025 kPa, 0.05 kPa, 0.04 kPa, and 0.03 kPa, respectively. On the side away from the diaphragm wall, except for the positive change value of pore water pressure in the strata with a burial depth of 0.07 m, the positive change value of pore water pressure in other strata first increases and then gradually decreases. When the precipitation recharge is stable, the maximum positive change values for the strata with different burial depths are 0.025 kPa, 0.05 kPa, 0.04 kPa, and 0.03 kPa. When the positive change value of pore water pressure after stabilization of precipitation recharge is less than 0.0125 kPa, the water level of the soil layer is less affected by recharge. It can be considered that the horizontal distance between the recharge well and the corresponding formation position with the positive change value of pore water pressure of 0.0125 kPa is the main influence range of recharge, and the average influence range of different burial depths of the soil layer far from the diaphragm wall is 0.4 m.
4.4 Analysis of test results in condition 4
After decreasing to the specified depth and stabilizing the dewatering and reinjection processes, the pore water pressure monitoring data for different burial depths at measurement points 7–12 were collated and analyzed, and the time-history variation curve of pore water pressure for different burial depths outside the foundation pit was obtained, as shown in Figure 12.
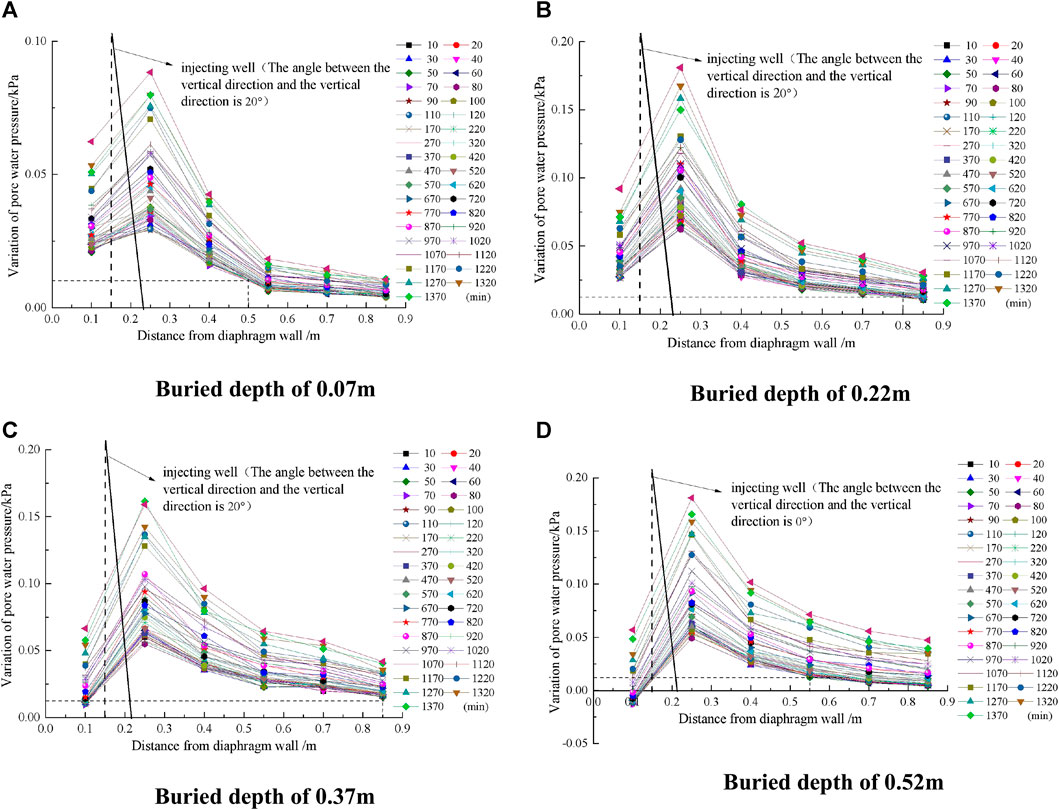
FIGURE 12. Time-history curves of pore water pressure in different depths.
From Figure 12, it can be seen that when reinjection is carried out at a full well depth at an angle of 20° to the vertical direction, the impact of reinjection on different burial depths within the reinjection depth range is significant. On the side of the reinjection well adjacent to the diaphragm wall, the positive change value of pore water pressure gradually decreases toward the diaphragm wall. When precipitation reinjection is stable, the maximum positive change values of the strata with different burial depths are 0.02 kPa, 0.025 kPa, 0.012 kPa, and 0 kPa. On the side away from the diaphragm wall, the positive variation values of pore water pressure in different burial depths first increase and then gradually decrease. When the precipitation recharge is stable, the maximum positive variation values in different burial depths are 0.03 kPa, 0.07 kPa, 0.06 kPa, and 0.05 kPa. When the positive variation value of pore water pressure is less than 0.0125 kPa after the stabilization of precipitation and reinjection, the water level of the soil layer is less affected by reinjection. It can be considered that the horizontal distance between the reinjection well and the corresponding formation position with the positive variation value of pore water pressure of 0.0125 kPa is the main impact range of reinjection, and the average impact range of reinjection for different burial depths of soil layers on the side away from the diaphragm wall is 0.5 m.
4.5 Analysis of test results in condition 5
After decreasing to the specified depth and stabilizing the dewatering and reinjection processes, it is necessary to collate and analyze the monitoring data of pore water pressure at different depths of measurement points 1–6 and obtain the time-history change curve of pore water pressure at different depths outside the foundation pit, as shown in Figure 13.
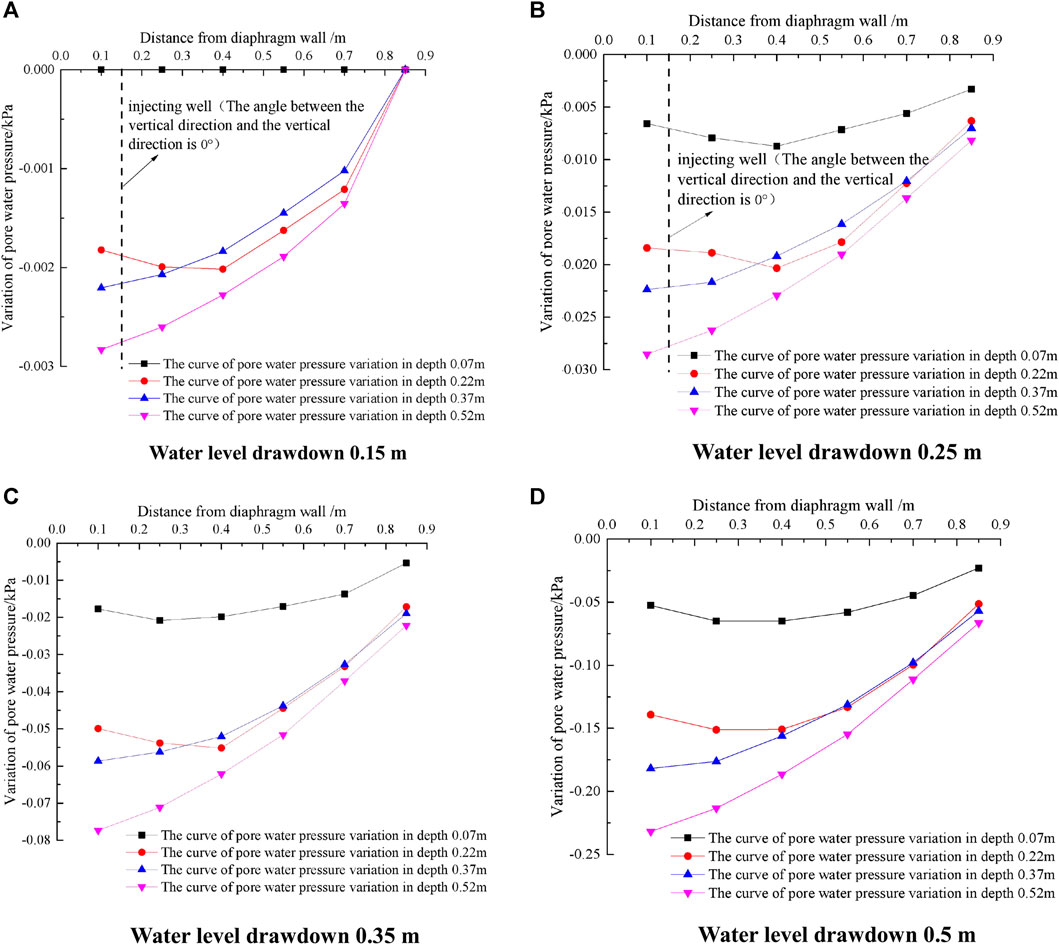
FIGURE 13. Variation curves of pore water pressure in each soil layer of different drawdown.
From Figure 13, it can be seen that during the reinjection process at 1/2 well depth, when the water level does not decrease beyond the reinjection depth, the reinjection has a significant impact on the changes in pore water pressure in the soil layer. The negative change in pore water pressure gradually decreases toward the diaphragm wall side of the reinjection well, while the negative change in pore water pressure gradually decreases away from the diaphragm wall side. When the drawdown exceeds the reinjection depth, the pore water pressure changes in silty clay similar formations and gravelly clay similar formations located within the reinjection depth are less affected by reinjection, and the pore water pressure changes in completely weathered granite similar strata and strongly weathered granite similar strata located outside the reinjection depth are basically the same as those without reinjection.
4.6 Analysis of test results in condition 6
After decreasing to the specified depth and stabilizing the dewatering and reinjection processes, the pore water pressure monitoring data for different depths at measurement points 1 to 6 were collated and analyzed, and the time-history variation curve of pore water pressure for different depths outside the foundation pit was obtained, as shown in Figure 14.
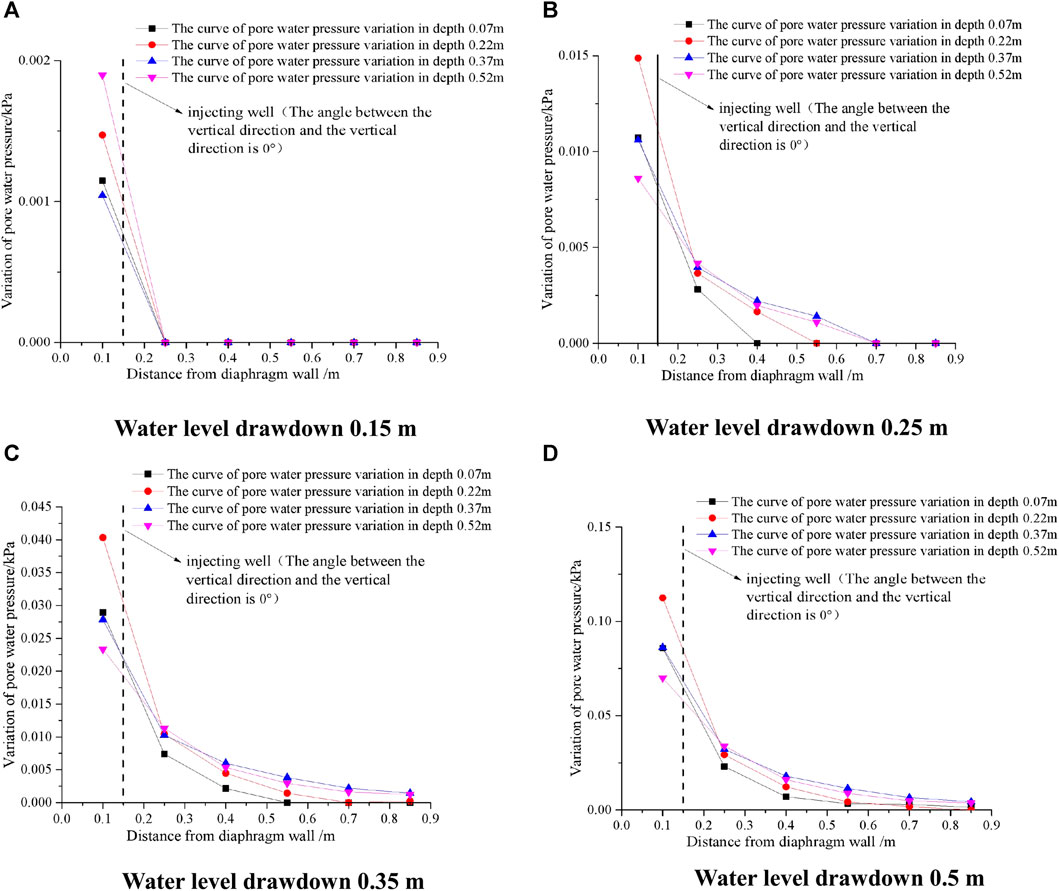
FIGURE 14. Variation curves of pore water pressure in each soil layer of different drawdown.
From Figure 14, it can be seen that when the vertical full well depth layered dehydration and reinjection are stable, the positive change value of pore water pressure at different burial depths increases with the increase in the dehydration and reinjection depth. When the dewatering and reinjection depth is 0.5 m, the positive change value of pore water pressure in different burial depths reaches the maximum. The positive change value of pore water pressure gradually decreases toward the diaphragm wall side of the reinjection well. The maximum positive change values for different precipitation reinjection depths are 0.002 kPa, 0.015 kPa, 0.04 kPa, and 0.11 kPa, respectively. On the side away from the diaphragm wall, the positive change value of pore water pressure gradually decreases toward the direction away from the diaphragm wall, and the maximum positive change values for different precipitation reinjection depths are 0 kPa, 0.004 kPa, 0.012 kPa, and 0.025 kPa.
When the positive change value of pore water pressure after the stabilization of the precipitation recharge is 0 kPa, the formation water level is less affected by recharge. It can be considered that the horizontal distance between the recharge well and the corresponding formation position with the positive change value of pore water pressure of 0 kPa is the main influence range of recharge, and the influence range of soil recharge at different precipitation recharge depths on the side away from the diaphragm wall is 0.1 m, 0.25 m, 0.4 m, and 0.4 m.
4.7 Analysis of test results in condition 7
After decreasing to the specified depth and stabilizing the dewatering and reinjection processes, the pore water pressure monitoring data for different drawdowns at measurement points 7–12 were collated and analyzed, and the variation curve of pore water pressure for different drawdowns outside the foundation pit after stabilizing the dewatering process was obtained, as shown in Figure 15.
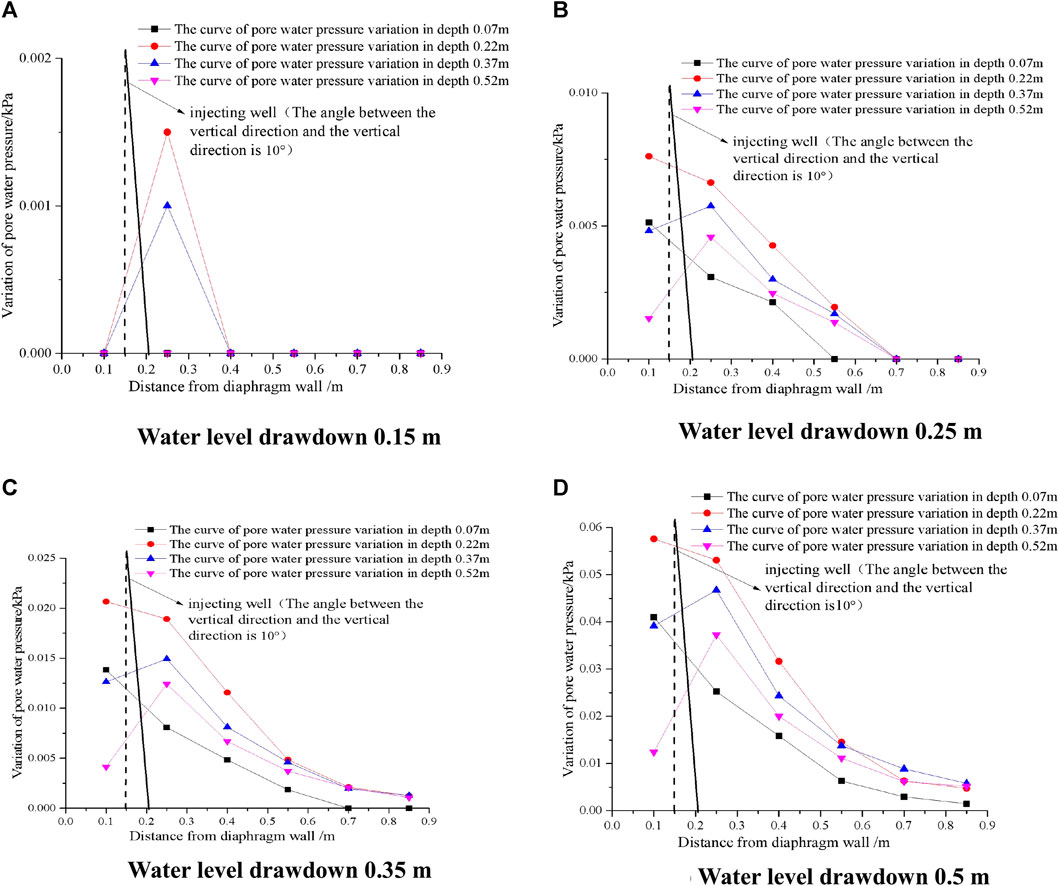
FIGURE 15. Variation curves of pore water pressure in each soil layer of different drawdown.
From Figure 15, it can be seen that the layered dehydration and reinjection of the full well depth are stable at an angle of 10° to the vertical direction, and the positive changes in pore water pressure at different burial depths increase with the increase in the dehydration and reinjection depth. When the dewatering and reinjection depths are 0.5 m, the positive variation value of pore water pressure in different burial depths reaches the maximum. The positive change value of pore water pressure gradually decreases toward the diaphragm wall when the reinjection well is close to the diaphragm wall. The maximum positive change values for different precipitation reinjection depths are 0 kPa, 0.005 kPa, 0.02 kPa, and 0.06 kPa. The positive change value of pore water pressure gradually decreases toward the direction away from the diaphragm wall when the reinjection well is away from the diaphragm wall. The maximum positive change values for different precipitation reinjection depths are 0.001 kPa, 0.004 kPa, 0.02 kPa, and 0.055 kPa.
When the positive change value of pore water pressure after the stabilization of precipitation recharge is 0 kPa, the formation water level is less affected by recharge. It can be considered that the horizontal distance between the recharge well and the corresponding formation position with the positive change value of pore water pressure of 0 kPa is the main influence range of recharge. The influence ranges of soil recharge at different precipitation recharge depths on the side away from the diaphragm wall are 0.25 m, 0.4 m, 0.55 m, and 0.65 m.
4.8 Analysis of test results in condition 8
After decreasing to the specified depth and stabilizing the dewatering and reinjection processes, the pore water pressure monitoring data for different burial depths at measurement points 7–12 were collated and analyzed, and the pore water pressure change curve for different burial depths outside the foundation pit after stabilizing the dewatering process was obtained, as shown in Figure 16.
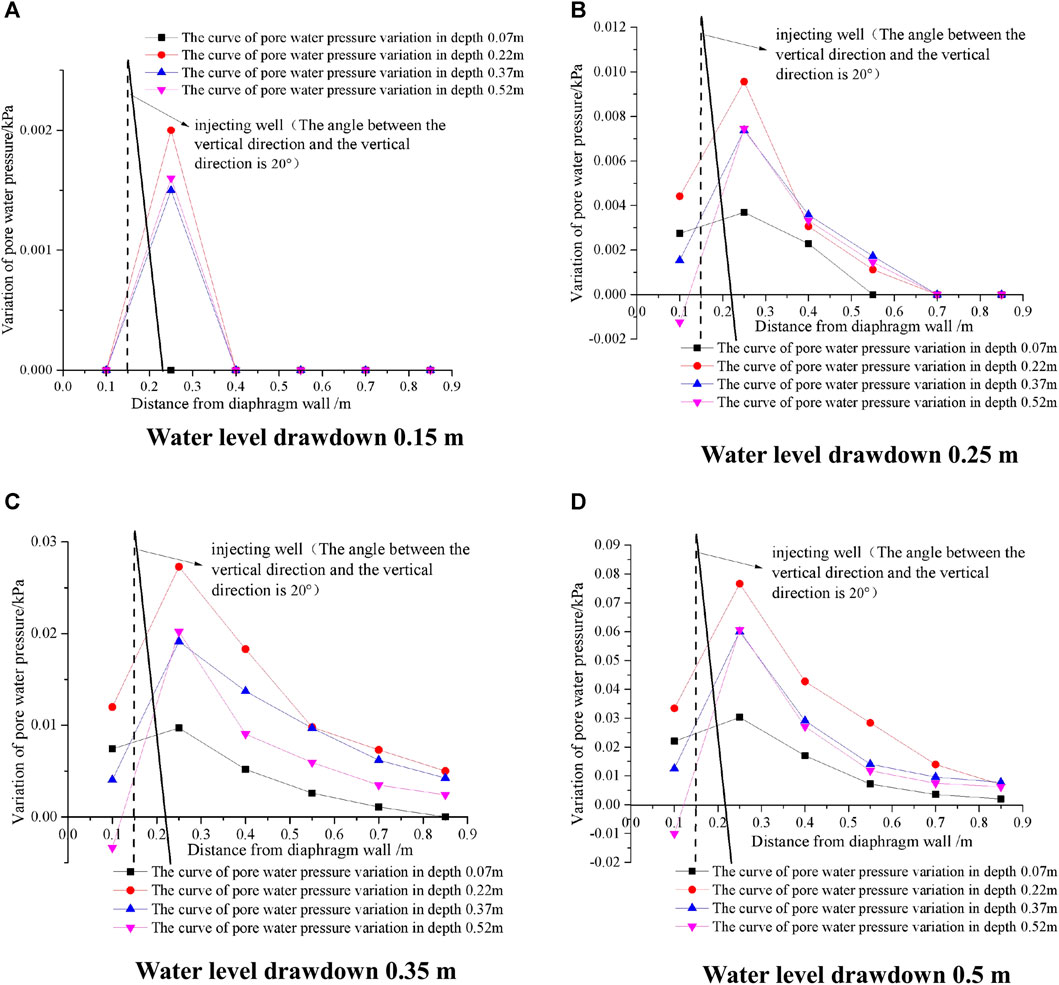
FIGURE 16. Variation curves of pore water pressure in each soil layer of different drawdown.
From Figure 16, it can be seen that when the vertical angle is 20°, the positive change value of pore water pressure in different burial depths of soil layers increases with the increase in the precipitation and reinjection depth. When the depth of precipitation and reinjection is 0.5 m, the positive variation value of pore water pressure in the soil layers with different burial depths reaches the maximum. The positive change value of pore water pressure gradually decreases toward the diaphragm wall when the reinjection well is close to the diaphragm wall. The maximum positive change values for different precipitation reinjection depths are 0 kPa, 0.004 kPa, 0.01 kPa, and 0.03 kPa. The positive change value of pore water pressure gradually decreases toward the direction away from the diaphragm wall when the reinjection well is away from the diaphragm wall. The maximum positive change values for different precipitation reinjection depths are 0.002 kPa, 0.01 kPa, 0.03 kPa, and 0.08 kPa.
When the positive change value of pore water pressure after stabilization of precipitation recharge is 0 kPa, the formation water level is less affected by recharge. It can be considered that the horizontal distance between the recharge well and the corresponding formation position with the positive change value of pore water pressure of 0 kPa is the main influence range of recharge. The influence ranges of soil recharge at different precipitation recharge depths on the side away from the diaphragm wall are 0.24 m, 0.4 m, 0.7 m, and 0.7 m.
5 Conclusion
Based on the model experiment of foundation pit dewatering in the phreatic layer, the focus was on studying the changes in water level outside the foundation pit and surface settlement caused by dewatering inside the phreatic layer foundation pit. The following conclusions are drawn:
(1) By studying the incomplete precipitation inside the foundation pit within the depth range of the underground continuous wall, the variation curve of the outer water level of the foundation pit is “concave first and then convex,” which is different from the Dupuit theory precipitation curve form.
(2) For the case of a large amount of precipitation in a layered soil foundation pit, as the depth of the soil layer increases, the curve of downward depression of precipitation outside the foundation pit is smaller, and the curve of the downward depression of the precipitation at the bottom of the retaining wall is the smallest. For layered dewatering of foundation pits, with the increase in precipitation, the variation value of pore water pressure in the soil layer outside the underground continuous wall gradually increases.
(3) Compared with vertical reinjection adjacent to dense buildings, inclined reinjection has a smaller impact on the side near the retaining wall and a greater impact on the side away from the retaining wall. Among them, the full well deep reinjection well with an angle of 20° from the vertical direction has the largest reinjection range and the best reinjection effect.
Data availability statement
The original contributions presented in the study are included in the article/Supplementary Material; further inquiries can be directed to the corresponding authors.
Author contributions
There are some authors in this manuscript and each one has contributed properly. The mathematical model has been proposed and all the numerical computations and their graphs have been carried out by QY, the final review and amendments in the manuscript have been carried out by SC, and YY has performed corresponding work on revising and polishing the paper. All authors contributed to the article and approved the submitted version.
Funding
This study is supported by the National Science Fund (52272341) and Guangzhou Panyu Polytechnic project (XJ2023000601) and funded by the Science and Technology Project of Hebei Education Department (QN2023060), the National Pre-research Funds of Hebei GEO University in 2023 (KY202305), and the Technology Innovation Team Project of Hebei GEO University (KJCXTD-2021-08).
Conflict of interest
The authors declare that the research was conducted in the absence of any commercial or financial relationships that could be construed as a potential conflict of interest.
Publisher’s note
All claims expressed in this article are solely those of the authors and do not necessarily represent those of their affiliated organizations, or those of the publisher, the editors, and the reviewers. Any product that may be evaluated in this article, or claim that may be made by its manufacturer, is not guaranteed or endorsed by the publisher.
References
Bai, B., Jiang, S. C., Liu, L. L., Li, X., and Wu, H. Y. (2021). The transport of silica powders and lead ions under unsteady flow and variable injection concentrations. Powder Technol. 387, 22–30. doi:10.1016/j.powtec.2021.04.014
Gambolati, G., and Teatini, P. (2015). Geomechanics of subsurface water withdrawal and injection. Water Resour. Res. 51 (6), 3922–3955. doi:10.1002/2014wr016841
Huang, Y. H., Lu, Y. J., Zhou, Y., and Zhao, J. T. (2009). A method for estimating land subsidence induced by groundwater extraction and its application to site evaluation of Yizhuang light railway in Beijing. ROCK SOIL Mech. 30 (8), 2457–2462.
Huang, Y., Yang, Y., and Li, J. (2015). Numerical simulation of artificial groundwater recharge for controlling land subsidence. KSCE J. Civ. Eng. 19, 418–426. doi:10.1007/s12205-015-0505-y
Li, M. G., Chen, J. J., Xia, X. H., Zhang, Y. Q., and Wang, D. F. (2020). Statistical and hydro-mechanical coupling analyses on groundwater drawdown and soil deformation caused by dewatering in a multi-aquifer-aquitard system. J. Hydrology 589, 125365. doi:10.1016/j.jhydrol.2020.125365
Meinzer, O. E. (1928). Compressibility and elasticity of artesian aquifers. Econ. Geol. 23 (3), 263–291. doi:10.2113/gsecongeo.23.3.263
Roy, D., and Robinson, K. E. (2009). Surface settlements at a soft soil site due to bedrock dewatering. Eng. Geol. 107 (3-4), 109–117. doi:10.1016/j.enggeo.2009.05.006
Wang, J., Wu, Y., Zhang, X., Liu, Y., Yang, T., and Feng, B. (2012). Field experiments and numerical simulations of confined aquifer response to multi-cycle recharge–recovery process through a well. J. Hydrology 464, 328–343. doi:10.1016/j.jhydrol.2012.07.018
Wang, J. X., Wu, L. G., Zhu, Y. F., Tang, Y., Yang, P., and Lou, R. (2009). Mechanism of dewatering-induced ground subsidence in deep subway station pit and calculation method. Chin. J. Rock Mech. Eng. 28 (5), 1010–1019.
Wu, Y. Q., and Zhu, Y. P. (2016). Calculation of settlement considering unsaturated soil influence on the dewatering of foundation pits. Eng. Mech. 33 (3), 179–187.
Wu, Y. X., Shen, S. L., Lyu, H. M., and Zhou, A. (2020). Analyses of leakage effect of waterproof curtain during excavation dewatering. J. Hydrology 583, 124582. doi:10.1016/j.jhydrol.2020.124582
Xu, Y. S., Shen, S. L., Ma, L., Sun, W. J., and Yin, Z. Y. (2014). Evaluation of the blocking effect of retaining walls on groundwater seepage in aquifers with different insertion depths. Eng. Geol. 183, 254–264. doi:10.1016/j.enggeo.2014.08.023
Xu, Y. S., Yan, X. X., Shen, S. L., and Zhou, A. N. (2019). Experimental investigation on the blocking of groundwater seepage from a waterproof curtain during pumped dewatering in an excavation. Hydrogeology J. 27 (7), 2659–2672. doi:10.1007/s10040-019-01992-3
Yu, J. L., and Gong, X. N. (2001). Study on the design and the application of the groundwater recharge system in excavation. J. Build. Struct. 22 (5), 70–74.
Yuan, H., and Zhang, Q. (2013). Estimation method for surface subsidence induced by dewatering under the constraint of lateral friction. J. Shanghai Jiaot. Univ. 47 (08), 1328.
Zeng, C. F., Zheng, G., Zhou, X. F., Xue, X. L., and Zhou, H. Z. (2019). Behaviours of wall and soil during pre-excavation dewatering under different foundation pit widths. Comput. Geotechnics 115, 103169. doi:10.1016/j.compgeo.2019.103169
Zhang, W. G., Goh, A. T. C., Goh, K. H., Chew, O. Y. S., Zhou, D., and Zhang, R. (2018). Performance of braced excavation in residual soil with groundwater drawdown. Undergr. Space 3 (2), 150–165. doi:10.1016/j.undsp.2018.03.002
Zhang, Y. Q., Li, M. G., Wang, J. H., Chen, J. J., and Zhu, Y. F. (2017). Field tests of pumping-recharge technology for deep confined aquifers and its application to a deep excavation. Eng. Geol. 228, 249–259. doi:10.1016/j.enggeo.2017.08.019
Keywords: dewatering of foundation pit, model test, precipitation curve, reinjection form, experimental study
Citation: Yang Q, Chen S and Yuan Y (2023) Experimental study on the variation rule of water level outside the pit caused by dewatering in the pit and the rule of reinjection outside the pit. Front. Mater. 10:1192557. doi: 10.3389/fmats.2023.1192557
Received: 23 March 2023; Accepted: 30 May 2023;
Published: 15 June 2023.
Edited by:
Xianze Cui, China Three Gorges University, ChinaCopyright © 2023 Yang, Chen and Yuan. This is an open-access article distributed under the terms of the Creative Commons Attribution License (CC BY). The use, distribution or reproduction in other forums is permitted, provided the original author(s) and the copyright owner(s) are credited and that the original publication in this journal is cited, in accordance with accepted academic practice. No use, distribution or reproduction is permitted which does not comply with these terms.
*Correspondence: Song Chen, Y2hlbm5zb25nZ0AxNjMuY29t; Ying Yuan, eXVhbnlpbmdzb25AaGd1LmVkdS5jbg==