 Lubin Qian
 Sihao Liu2
- 1School of Urban Rail Transportation, Shanghai University of Engineering Science, Shanghai, China
- 2Shanghai Urban Railway Operation Co., Ltd., Shanghai, China
- 3Wuhan Ruimin Testing Technology Co., Ltd., Wuhan, Henan, China
- 4Luoyang Sunrui Rubber and Plastic Technology Co., Ltd., Luoyang, Henan, China
In this paper, a Wav2Vec2.0 neural network based on an attention mechanism is proposed to locate defects in array ultrasonic testing signals. This method does not require knowledge of the a priori condition of the sample sound velocity or the feature extraction of ultrasonic scattering signals. First, an array piezoelectric ultrasonic testing system is used to detect a signal through hole defects at different positions in the plate structure. Then, three different neural networks—1D-CNN, Muti-Transformer, and Wav2Vec2.0—are used to locate the defects in the collected ultrasonic testing data. The performance of the network is verified with the data set collected through finite element simulation and the experimental system, and the identification accuracy and the calculation efficiency of different networks are compared and analyzed. To provide a solution for the poor balance of the experimental data set and the weak noise resistance of the simulation data set, a data set expansion method based on time domain transformation technology is proposed. The research results show that, the positioning accuracy of the Wav2Vec2.0 neural network proposed in this article is 98.46%, and the positioning accuracy is superior to Muti Transformer and ID-CNN.
1 Introduction
With the sustained and rapid development of the national economy, industries such as aerospace, petrochemical, and transportation have made significant progress. Thin plates, as a special structure, are widely used in various industries (Lu et al., 2016). As an active monitoring technology, structural health monitoring (SHM) based on Lamb waves can be used to realize the rapid and large-scale nondestructive testing of plates (Li et al., 2019). SHM often uses piezoelectric ceramics as an exciter to excite Lamb waves on the surface of a monitored structure and uses piezoelectric ceramics as sensors to detect and receive defect response signals (Stepinski and Ambrozinski, 2013). In recent years, array imaging methods based on ultrasound guided waves have been widely applied in the field of Structural Health Monitoring (SHM)/Non-Destructive Testing (NDT), and various array imaging algorithms have been developed; Ma et al. (2020), (2022) analyzed the time-reversal (TR) mirrors in acoustic focusing and imaging. However, existing array imaging methods are difficult to effectively extract weak scattering information of damage from array sensing data, and cannot accurately characterize the location, degree, and type of damage.
With the development of artificial intelligence, deep learning provides a new tool in piezoelectric ultrasonic guided wave sensing signal characterization, feature extraction, and anomaly detection (Rizvi and Abbas, 2021; Rautela et al., 2021; Sikdar and Pal, 2021). Since the 1970s, researchers have been using neural networks to identify defects in ultrasonic testing data, and this research mainly focuses on two aspects. On the one hand, the method of feature extraction and shallow neural network is used to classify the detection data. On the other hand, deep learning methods are directly used, and the input data is mainly manually extracted feature values. In recent years, deep learning algorithms have gradually developed to automatically extract features. Shi et al. (2016) used a wavelet transform to extract the feature information from an ultrasonic A-scan signal and classified and identified the defect through a deep neural network (DNN), with an increased accuracy of 21.66%. Shao et al. (2020) proposed a defect-type recognition method based on a VGG16 convolution neural network to directly identify the original signal of array ultrasonic testing and proved that a two-dimensional convolution neural network had higher recognition accuracy. Meng et al., (2017) proposed the use of a convolutional neural network (CNN) to classify and train the wavelet features of different layers through hierarchical wavelet transform to achieve the defect classification of carbon fiber materials, with an accuracy rate of 98.15%. He et al. (2014) used the electro-mechanical impedance (EMI) technology of a PZT unit to measure impedance spectrum and used a backpropagation (BP) neural network to quantify the health status of a truss structure. The results showed that the developed neural network model can not only determine the position of a loose rod but can also quantify the looseness level (He et al., 2014). Munir et al., (2020) used a CNN model to classify ultrasonic signals after denoising through variational autoencoders (VAEs). Drai et al., (2002) extracted the eigenvalues of the echo signals of welding defects through the time domain, frequency domain and discrete wavelet, and used K-nearest neighbor (KNN) clustering and artificial neural networks (ANNs) for classification and recognition. Khumaidi et al., (2017) proposed the use of ultrasonic inspection images of welding surface defects as input and used a CNN to classify different types of welding defects, with an accuracy rate of 95.83%. Caputo et al., (2021) and others used finite elements and experimental methods to generate ultrasonic guided wave scattering signals at different positions in an aluminum plate, and they obtained the complex mapping relationship between guided wave scattering signals and damage locations through an artificial neural network. This achieved the accurate location of damage in the aluminum plate and achieved good results in the location of damage in a carbon fiber-reinforced polymer composite plate. Ewald et al., (2021) and others simulated ultrasonic Lamb wave signals in aviation composite materials collected by multiple piezoelectric sensors using the finite element method and combined the signals collected by multiple sensors into a group of mixed time-frequency maps through a normalized short-time Fourier transform. A convolutional neural network was used to extract the abstract features of the mixed time-frequency image, and the mapping relationship between the abstract features and the damage location was established to achieve accurate damage identification. Su et al. (2019) collected the ultrasonic Lamb wave scattering signals of different types of defects in composite materials through experiments, obtained the amplitude frequency characteristics of the scattering signal using a fast Fourier transform, and established a complex mapping relationship between the amplitude frequency characteristics of the scattering signal and the damage location through the depth neural network to achieve accurate defect identification.
In summary, in recent years, intelligent structural damage assessment methods based on deep learning algorithms have been able to achieve damage location determination (Chen and Liu, 2018; Li, 2019), but their feature extractor structure only focuses on local features and ignores the global features of the signal, failing to fully utilize the correlation information between channels of multi-channel piezoelectric array signals. In response to the above issues, this article applies the Wav2Vec2.0 neural network to the raw ultrasound signal data collected by array probes. The array data is used as the input of the Wav2Vec2.0 network, and the Transformer and product quantization structural components are used to extract general features of the ultrasound detection data. The extracted general features are applied to downstream defect localization tasks, achieving an improvement in recognition accuracy on larger datasets.
2 Damage location method based on Wav2Vec2.0 neural network
2.1 Wav2Vec2.0 neural network
Wav2vec 2.0 is discussed in a paper published by the Facebook AI Lab in 2020 (Alexei et al., 2020). Through unsupervised training, this model can enable the network to map the original voice samples to a feature space more representative of data features. The use of the calculated feature vector to replace traditional features such as Mel-scaleFrequency Cepstral Coefficients (MFCC) can improve subsequent tasks such as speech recognition or voice event detection. The network structure of the Wav2Vec2.0 pre-training model is shown in Figure 1.
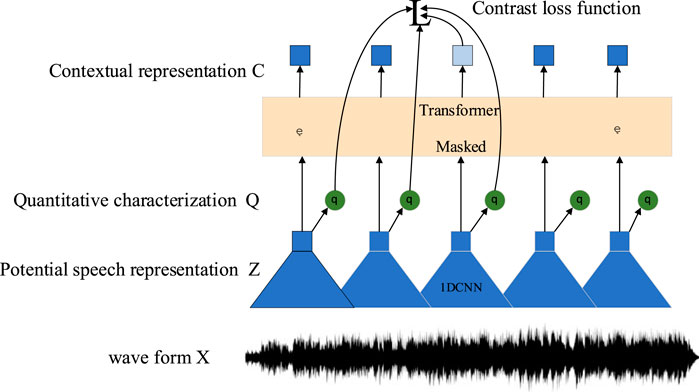
FIGURE 1. Wav2Vec2.0 network structure.
The Wav2Vec2.0 pre-training model includes a convolutional neural network for coding and a context network based on Transformer (Sadhu et al., 2021). The convolution neural network maps the original input audio signal to the hidden space to obtain the hidden variable Z. The hidden variable Z is mapped to the quantized hidden variable Q through the quantization module and then some positions of the random mask are input to the Transformers network to obtain the context feature vector C. Wav2Vec2.0 uses the comparative learning method to calculate the loss for the masked positions to carry out self-supervised pre-training. For the context feature vector
The formula of the loss function of comparative learning is as follows:
where sim uses cosine similarity.
In addition to the loss function of comparative learning
By maximizing the entropy value of the probability distribution of the selecting code in each codebook group in the quantization module, the model can select each vector in the codebook more evenly to avoid the problem of pattern collapse. The final loss function is L =
After building the model of wav2vec 2.0, this paper uses wav2vec 2.0 as a feature extractor, applies Transformer and quantization module components to extract the general features of ultrasonic testing data, and then adds a layer of randomly initialized linear layer in the network structure as a Linear classifier to achieve accurate damage identification.
2.2 Damage location method based on Wav2Vec2.0
The flowchart of a macroscopic damage location system for a thin plate structure proposed in this paper is shown in Figure 2. The deep network feature extraction method combining convolution and the attention mechanism used to determine the macroscopic damage location of the thin plate structure through the Wave2Vec2 model. The specific process is as follows:
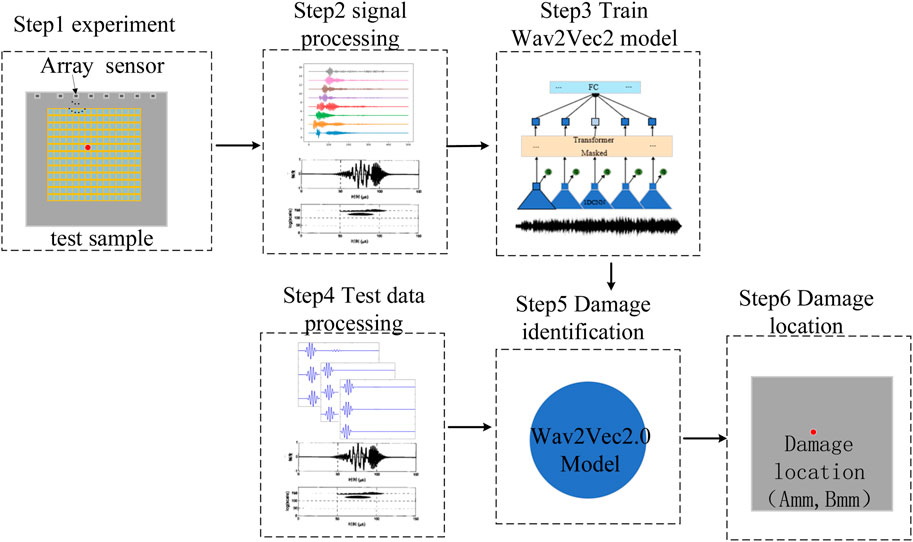
FIGURE 2. Flowchart of macroscopic damage location system of the thin plate structure.
Step 1. The Lamb wave response signal is collected.
Step2. Signal filtering removes the noise signals and normalizes them.
Step 3. The Wave2Vec2 model is trained, and the trained model is obtained.
Step4. The test data are processed, including filtering and normalization; Steps 5 and 6: The test data are put back into the training model, and the damage results are obtained and analyzed.
3 Experiment setup
3.1 Datasets
In this study, due to the lack of a publicly available database on ultrasonic non-destructive testing data and the difficulty in obtaining a large amount of measured data in experiments, numerical simulations and experiments were conducted to collect data on aluminum plates with single circular through-hole damage.
3.1.1 Collection of simulation datasets
In order to understand the interaction between Lamb waves and damage, a numerical analysis model for ultrasonic guided wave excitation/sensing in aluminum plate structures with typical damage was established based on commercial finite element software PZflex. The sound field of ultrasonic guided waves was simulated, as shown in Figure 3. The simulated test sample is an isotropic aluminum plate, and its model parameters are shown in Table 1. In order to excite a single S0 mode ultrasonic guided wave, this article uses a customized 5-cycle sine wave with Gaussian Hanning window in MATLAB as the excitation signal, and the excitation frequency is selected as 200 kHz (Zhu et al., 2023). By analyzing the excitation signal using MATLAB, the normalized time-domain and frequency signals are shown in Figure 4.
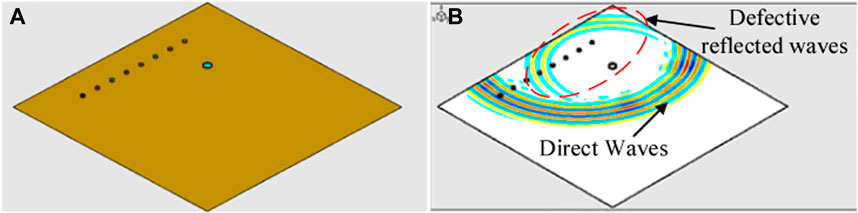
FIGURE 3. Finite element model and process simulation of ultrasonic signal propagation in the model. (A) The finite element model; (B) Ultrasonic signal propagation.
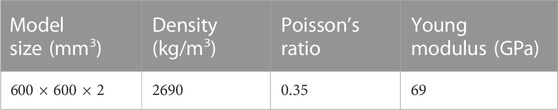
TABLE 1. Finite element Model parameters.
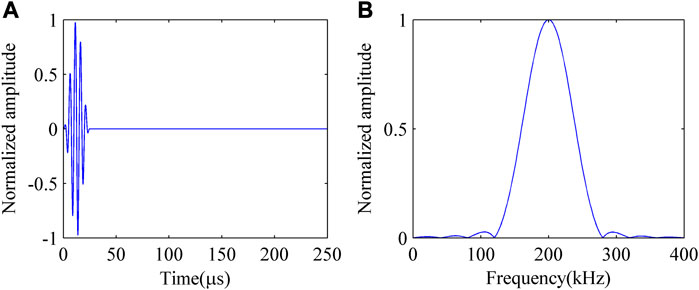
FIGURE 4. Ultrasonic excitation signal: (A) Time domain signal; (B) Spectrum.
This article divides the aluminum plate into 64 areas, each with a size of 5 cm × 5 cm, as shown in Figure 5. Simulate symmetrical open cracks at different locations by drilling through holes with a diameter of 1 cm in different areas (Zhang et al., 2019). Similarly, the aluminum plate can be divided into 441 areas, each with a size of 2 cm × 2 cm and collect ultrasonic sensor signals through simulation. The sensor positions are shown in Table 2.
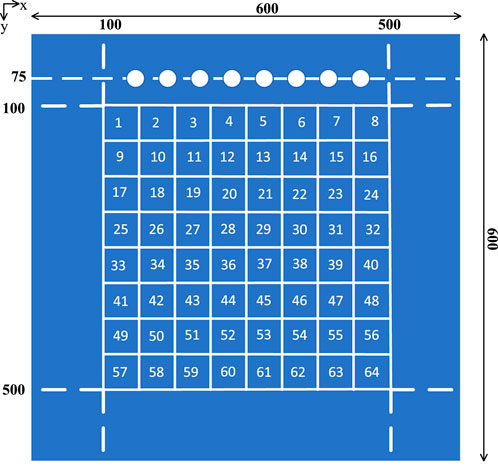
FIGURE 5. Schematic diagram of sensor and damage location.
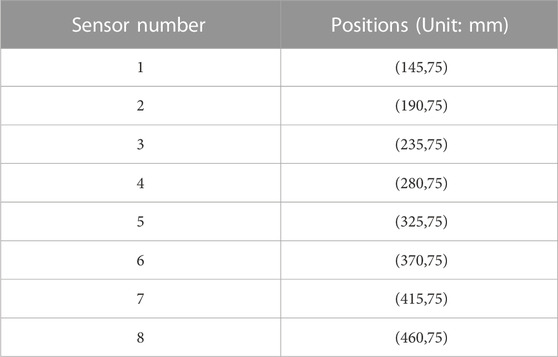
TABLE 2. Sensor positions.
3.1.2 Experimental data collection
The size of the aluminum plate is 600 mm × 600 mm × 2 mm. This article pasted 8 piezoelectric elements on an aluminum plate to form a linear array (Liu et al., 2016). The 8 piezoelectric elements in the linear array were PZT-5 piezoelectric sheets produced by Wuxi Haiying Company, with a diameter of 10 mm and a thickness of 0.3 mm. The center distance between adjacent two piezoelectric elements was 45 mm. The excitation signal with a center frequency of 200 kHz is generated by the JPR-600C ultrasonic generator. The excitation signal is loaded onto the designated channel piezoelectric plate through the MUX-16 multi-channel conversion switch, and the ultrasonic guided wave data propagated in the aluminum plate is received through the piezoelectric plate. The sampling frequency of the system is 2 MHz.The specific hardware models are shown in Table 3. The experimental device and the photos of the ultrasonic array data acquisition system are shown in Figure 6. The sensor and damage location of the experimental system are consistent with the simulation system and will not be repeated here.
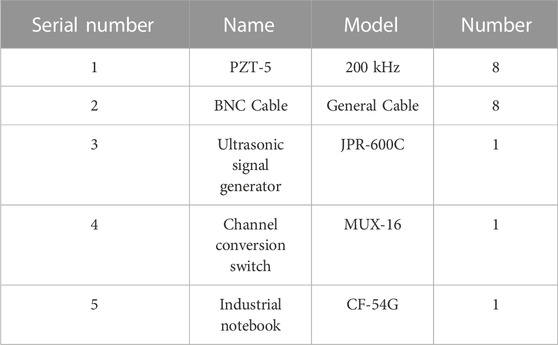
TABLE 3. Main hardware parameters.
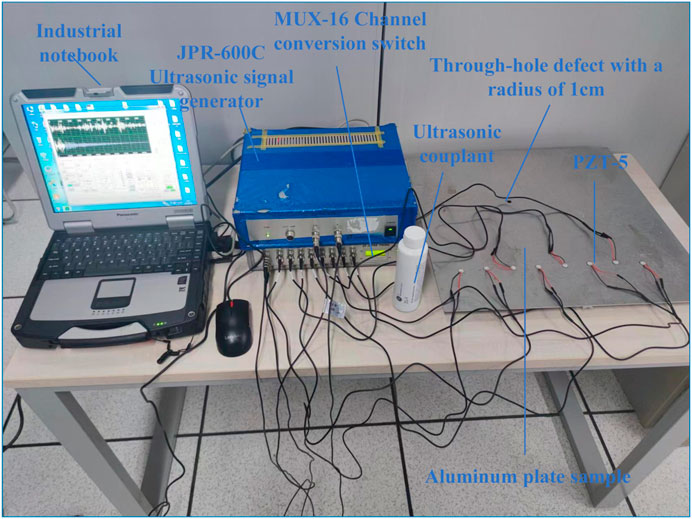
FIGURE 6. Experimental device of ultrasonic array data acquisition system.
3.2 Preprocessing and database settings
In the experiment, due to the internal noise and environmental interference of the system, noise is inevitably introduced. The noise type is white noise. “Db5” wavelets and four-scale decompositions are used to eliminate noise (Tiwari et al., 2017). Figure 7 shows the results of wavelet decomposition denoising for the received ultrasonic guided wave signal. During the excitation signal triggering process, each piezoelectric element in the piezoelectric array takes turns as a driver. When one of the piezoelectric elements acts as a driver, the other piezoelectric elements act as sensors. Figure 8 shows signals received by all sensors when the first sensor is the excitation source.
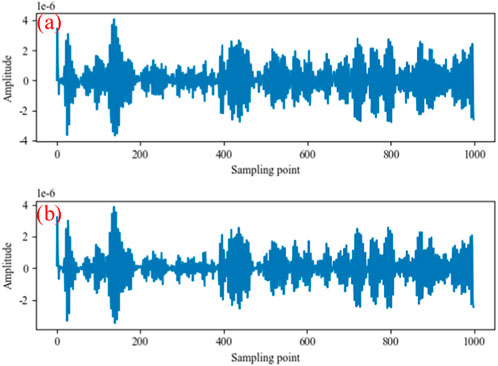
FIGURE 7. Schematic diagram of wavelet reconstruction signals: (A) Original signals; (B) Signals after wavelet reconstruction.
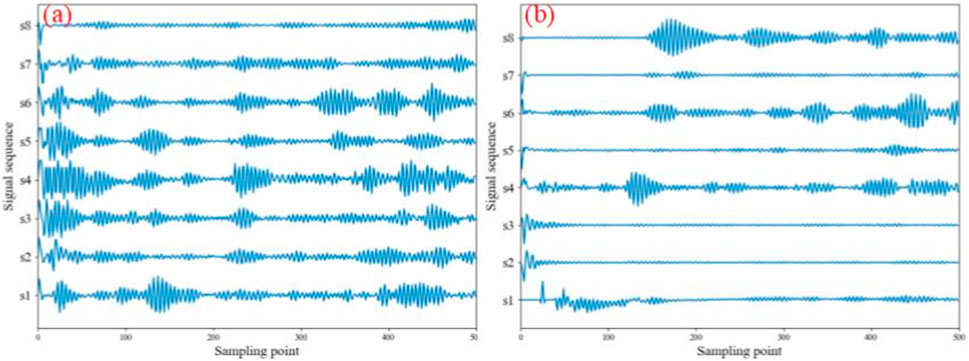
FIGURE 8. Signals received by all sensors when the first sensor is the excitation source: (A) Original signals; (B) Scattering signals.
To eliminate the false signal generated by the boundary reflection wave, the filtered signal needs to be windowed (Lu and LiSong, 2016). The signal after adding the boundary reflection coefficient to the signal is expressed as:
It can be seen from the above formula that when the boundary reflection coefficient is added to the signal received by the sensor, all signals before the first boundary reflection wave reaches the ith sensor are completely retained, and the amplitudes of all signals after the first boundary reflection wave reaches the ith sensor are attenuated in exponential mode. Figure 9 shows that the boundary-reflected wave signal attenuates the original signal.
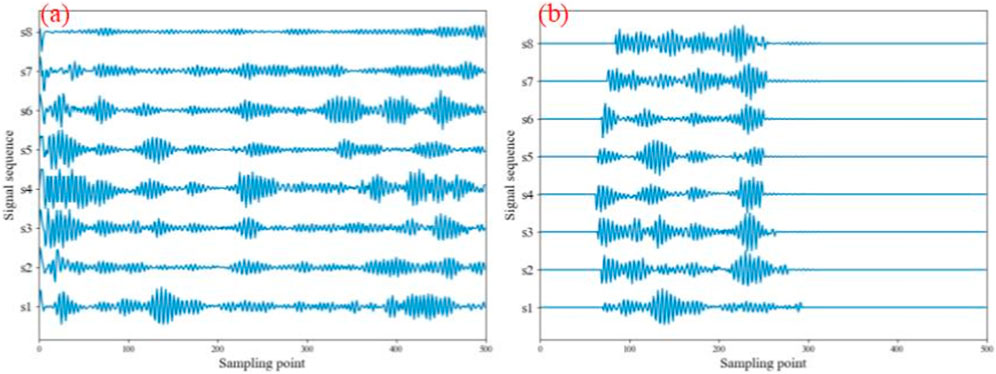
FIGURE 9. Effect of boundary reflection coefficient on the original signals: (A) No reflection coefficient is added; (B) The reflection coefficient is added.
The good training of neural networks requires a large amount of data as support, and the array ultrasound guided wave signal data required in this article can be obtained through numerical simulation or experiments. The signal obtained from numerical simulation has high accuracy, but it takes a long time; The efficiency of experimental methods is relatively higher, but they require many experimental samples, have high costs, and are prone to environmental noise interference, resulting in relatively poor results.
There are two ways to enhance a data set. The first way is to collect the ultrasonic nondestructive testing data by changing the size of the finite element divided by the program in the finite element simulation process for the finite element simulation data set, as shown in Figure 10. A certain amount of 3 dB and −3 dB Gaussian white noise is added to the collected simulation data set, as shown in Figure 11. The second method involves translating the signal up and down for the experimental data set and doubling the number of samples, as shown in Figure 12.

FIGURE 10. Ultrasonic NDT data in simulation model: (A) [0: 1,500]; (B) [900: 1,500].
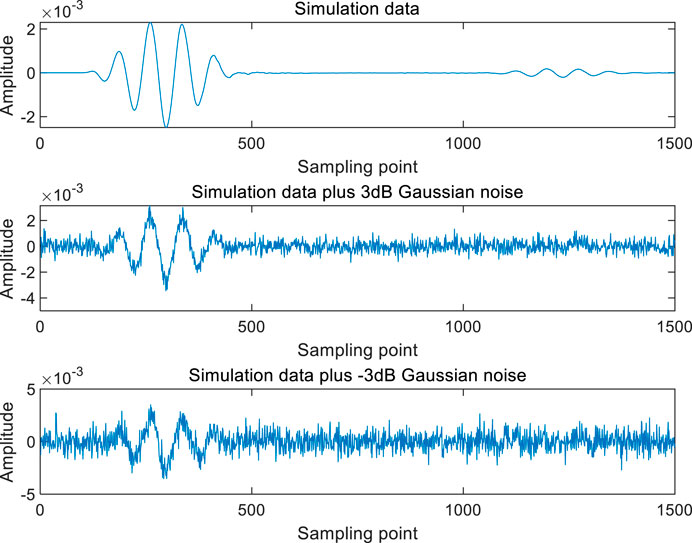
FIGURE 11. Simulation data plus noise.
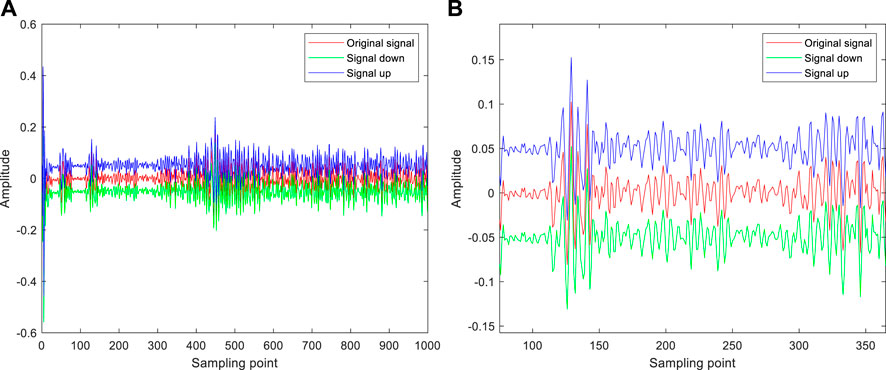
FIGURE 12. Expansion of experimental data set: (A) [0: 1,000]; (B) [80: 360].
To summarize, 192 and 1,323 groups of data are collected for simulation defects by changing the size of the finite element and expanding to 384 and 2,646 groups through the above method, totaling 576 and 3,969 groups of data. For the experimental data, six experiments are carried out at each defect location. Overall, 384 groups of experimental data are collected from 64 groups of defect locations and are amplified to 768 groups by the amplification method, a total of 896 groups of experimental data. The number of samples after amplification is shown in Table 4. The dataset names and sample sizes used in this experiment are shown in Table 5. The dataset used in each experimental scheme is allocated to the neural network for experimentation, with 70% of the dataset being the training set, 20% being the testing set, and 10% being the validation set.
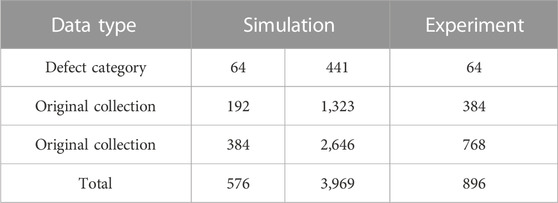
TABLE 4. Number of samples after amplification.
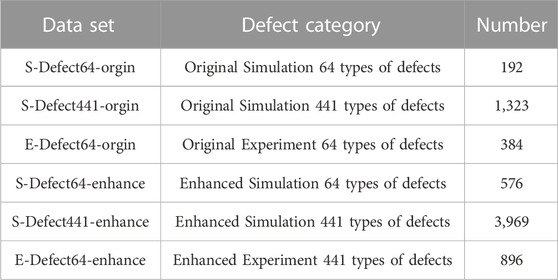
TABLE 5. Dataset and sample size.
3.3 Models and schemes for comparison with this article
In order to compare and analyze the performance of the proposed model, this article compares the training effects with the following two models. The experimental environment used in this study is the Ubuntu 18.04 system, which uses a GPU NVIDIA GeForce RTX 3090. Its graphics card memory is 24 GB, and the CPU model is Intel (R) Xeon (R) Platinum 8157 CPU @ 2.30 GHz. The programming language is Python 3.8, and the in-depth learning model is built using Python 1.10.
3.3.1 1D-CNN
The 1D-CNN model used for comparing experimental results is consistent with the convolutional neural network used for encoding in the Wave2vec2.0 model proposed in this paper. In the experiment, the 1D-CNN model is set with a seven-layer CNN, the step size is (5,2,2,2,2,2,2,2), the convolution kernel width is (10,3,3,3,3,2,2), the parameters of the feedforward neural network are set to 512, and the weight attenuation is 0.0001. The model uses the Adam optimizer, as shown in Figure 13.
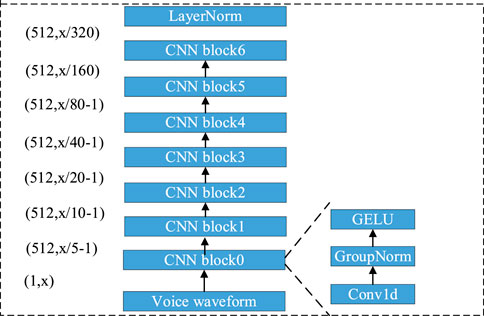
FIGURE 13. 1D-CNN network structure and parameters.
3.3.2 Muti-Transformer
Following the approach of reference (Sun et al., 2021), the context network based on Transformer in the Wave2Vec2.0 neural network proposed in this paper is transformed into a Muti-Transformer model that adapts to multi-channel signals. In the experiment, the number of attention modules in the Muti-Transformer is set to three layers, the number of attention heads in each layer is eight, the dropout is set to 0.3, the parameter of the feedforward neural network is set to 512, and the weight attenuation is 0.0001. The model uses the Adam optimizer. The size of pooled cores is 32 × 32 and 8 × 8. The size of the convolution core is 64 × 64, as shown in Figure 14.
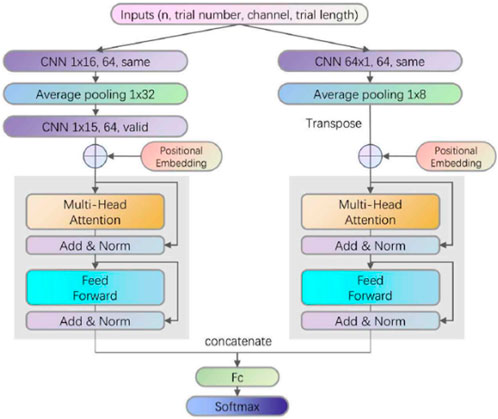
FIGURE 14. Muti-Transformer network structure and parameters.
4 Results and analysis
4.1 Wav2Vec2.0 neural network training and result analysis
Considering the experimental requirements of the defect guided wave positioning model based on the Wav2vec2.0 neural network, the open-source deep learning framework Pytorch is selected as the main framework when conducting experiments related to s deep learning. The specific experimental environment and computer configuration are shown in Table 6 below:
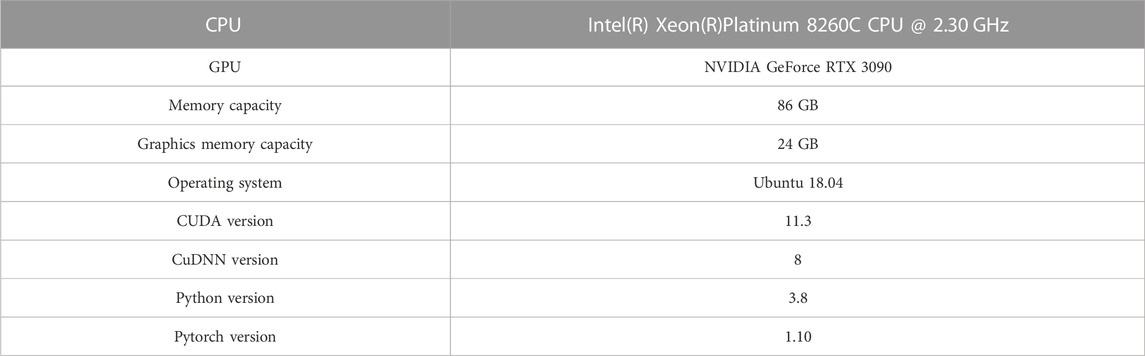
TABLE 6. Configuration of computer deep learning environment used in the experiment.
In this paper, relative entropy is chosen as the optimized loss function. Relative entropy (KL divergence), also known as cross entropy, is used to represent the difference between two probability distributions. When two random distributions are the same, their relative entropy is zero. When the difference between two random distributions increases, their relative entropy also increases.
Expanding relative entropy yields Eq. 5:
In order to evaluate the model, this article uses the E-Defect64-enhance dataset provided in Section 3.2 as deep learning experimental data and calculates the accuracy and loss values of the model. From Figures 15A, B, it can be seen that in the training set, when epochs reach the 600th time, the accuracy rate is the highest, and the accuracy rate of the training samples reaches 100%.
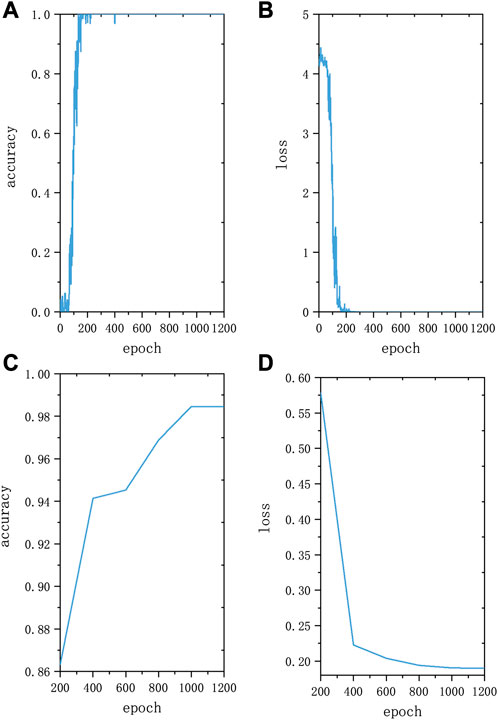
FIGURE 15. Model iteration results. (A) Training accuracy curve; (B) Training loss curve; (C) Test accuracy curve; (D) Test loss curve.
For the test set, place the test set data into the trained model, and the model testing iteration results are shown in Figures 15C, D The results obtained from damage localization and quantitative identification are shown in Figure 16 When epochs reach the end, the accuracy is the highest and the error is the smallest. At this point, the accuracy rate of the training sample reaches 98.46%. From Figure 16, it can be seen that among the 64 types of test samples, only one damage location was identified incorrectly, while the other samples were correctly tested with accuracy rate of 98.46%. The misidentified samples identified the defect at 47 as 40.
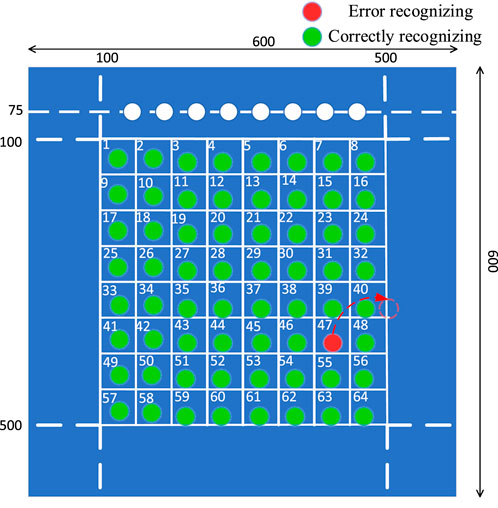
FIGURE 16. Results from damage location and quantitative identification.
4.2 Analysis of deep learning network models
4.2.1 Network model noise resistance
To verify the noise resistance of the neural network model, using the S-Defect64-orgin and E-Defect64-orgin datasets respectively, different network models were used for training, with 1,200 iterations. The positioning accuracy is shown in Table 7. Among them, the positioning accuracy of 1D-CNN, Muti Transformer, and Wav2vec2.0 neural network models in the S-Defect64-orgin dataset is 100%. The positioning accuracy in the E-Defect64-orgin dataset is 87.5%, 92.78%, and 96.87%, respectively. It can be seen that the positioning accuracy of the model in the simulation dataset has significantly improved compared to the experimental dataset, because the noise of the ultrasonic guided wave signal collected in the experiment is significantly higher than that in the simulation dataset. Table 7 shows that the high-precision detection network proposed in this paper has strong noise resistance and excellent robustness for datasets with different signal-to-noise ratios.

TABLE 7. Effect of experimental data and simulation data on recognition accuracy.
4.2.2 Accuracy of network model positioning results
To verify the accuracy of the neural network model in identifying defect locations, different network models were trained using the S-Defect64-orgin and S-Defect441-orgin datasets, with 1,200 iterations. The scale of defects corresponding to different datasets varies. The defect localization scale of the S-Defect64-orgin dataset is 5 cm, while the defect localization scale of the S-Defect441-orgin dataset is 2 cm. The positioning accuracy of different neural network models is shown in Table 8. Among them, the positioning accuracy of 1D-CNN, Muti Transformer, and Wav2vec2.0 neural network models in the S-Defect64-orgin dataset is 100%. The positioning accuracy in the S-Defect441-orgin dataset is 89.84%, 96.09%, and 98.46%, respectively. It can be seen that the positioning accuracy of the three models in the S-Defect64-orgin dataset is significantly improved compared to the S-Defect441-org dataset. This is because the signal category in the S-Defect441-org dataset is significantly higher than that in the S-Defect64-orgin dataset. The three models can fit the function well at 1,200 iterations, but the fitting ability of the model in the S-Defect441-org dataset did not reach its optimal level. Table 8 also proves that the Wav2vec2.0 neural network has higher performance in identifying defect locations with higher accuracy.
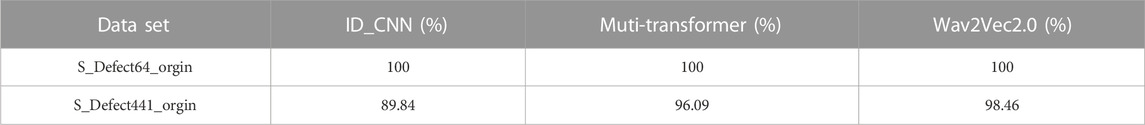
TABLE 8. Impact of dataset size on recognition accuracy.
4.2.3 The generalization ability of neural networks
To verify the generalization ability of neural networks for different datasets, using the S-Defect64-orgin, E-Defect64-orgin datasets, and the enhanced S-Defect64-enhancer, E-Defect64-enhancer datasets, different network models were used for training, with 1,200 iterations. The positioning accuracy results are shown in Table 9. The positioning accuracy of the 1D-CNN, Muti Transformer, and Wav2Vec2.0 models in the S-Defect64-enhance dataset is 100%. The positioning accuracy of the 1D-CNN, Muti Transformer, and Wav2Vec2.0 models in the E-Defect64-enhanc dataset is 90.62%, 95.31%, and 98.46%, respectively. It can be seen that the data augmentation method has significantly improved the positioning accuracy of various network structures. Similarly, this also indicates that the wave2vec2.0 neural network has better generalization ability.
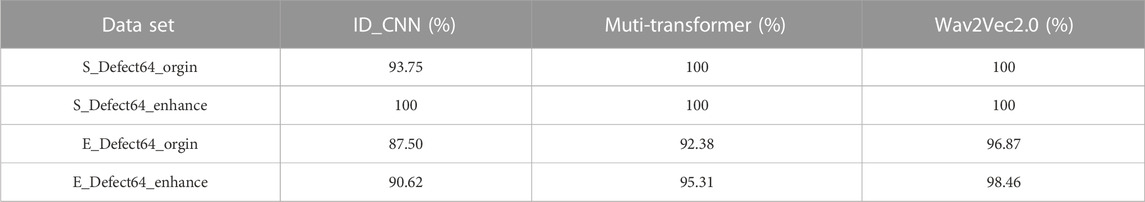
TABLE 9. Effect of data enhancement methods on recognition accuracy.
5 Conclusion
In this paper, a method based on the Wav2Vec2.0 neural network is proposed to directly locate defects in array ultrasonic testing signals. This method does not require knowledge of the a priori condition of the sample sound velocity or the feature extraction of ultrasonic scattering signals. The study draws the following conclusion:
(1) The positioning accuracy of the Wav2Vec2.0 neural network proposed in this article is 98.46%, and the positioning accuracy is superior to Muti-Transformer and ID-CNN.
(2) A metal plate structure piezoelectric array ultrasonic guided wave data acquisition scheme based on numerical simulation and on-site experiments was proposed, and the obtained piezoelectric array ultrasonic guided wave data processing method was used to produce a piezoelectric array ultrasonic guided wave dataset.
(3) The analysis of the impact on the positioning accuracy of deep learning models shows that:
1) The Wav2vec2.0 neural network has stronger fitting ability than other networks in experimental datasets, indicating that the method proposed in this paper has stronger robustness
2) The Wav2vec2.0 neural network has stronger fitting ability in larger datasets, which means it has higher recognition performance for smaller scale defects.
3) The use of data augmentation methods can improve model performance. The Wav2vec2.0 neural network has better recognition performance in enhanced datasets and stronger generalization ability.
Data availability statement
The raw data supporting the conclusion of this article will be made available by the authors, without undue reservation.
Author contributions
Data curation, XL, YM, YX, and ZW; Investigation, HZ and YX; Methodology, SL and GF; Project administration, HZ and ZW; Resources, LQ and HZ; Software, SL; Supervision, GF, XL, and ZW; Validation, LQ and YX; Visualization, XL and YM; Writing–original draft, SL and YM; Writing–review and editing, LQ and GF. All authors contributed to the article and approved the submitted version.
Funding
This project was funded by the National Natural Science Foundation of China (No. 12104290).
Conflict of interest
SL was employed by Shanghai Urban Railway Operation Co., Ltd. XL was employed by Wuhan Ruimin Testing Technology Co., Ltd. ZW was employed by Luoyang Sunrui Rubber and Plastic Technology Co., Ltd.
The remaining authors declare that the research was conducted in the absence of any commercial or financial relationships that could be construed as a potential conflict of interest.
Publisher’s note
All claims expressed in this article are solely those of the authors and do not necessarily represent those of their affiliated organizations, or those of the publisher, the editors and the reviewers. Any product that may be evaluated in this article, or claim that may be made by its manufacturer, is not guaranteed or endorsed by the publisher.
References
Alexei, B., Henry, Z., Abdelrahman, M., and Michael, A. (2020). Wav2vec 2.0: A framework for self-supervised learning of speech representations facebook ai research. https://arxiv.org/abs/2006.11477.
Caputo, F., De Luca, A., Perfetto, M., and Lamanna, G. (2021). Damage detection in flat panels by guided waves based artificial neural network trained through finite element method. Materials 14 (24), 7602. doi:10.3390/ma14247602
Chen, H., and Liu, Z. (2018). Application and challenges of signal processing techniques for Lamb waves structural integrity evaluation: Part B-defects imaging and recognition techniques. London, UK: Intech open.
Drai, R., Khelil, M., and Benchaala, A. (2002). Time frequency and wavelet transform applied to selected problems in ultrasonics NDE. NDT E Int. 35 (8), 567–572. doi:10.1016/s0963-8695(02)00041-5
Ewald, V., VenkatAsokkumar, R. S. A., Benedictus, R., Boller, C., and Groves, R. M. (2021). Perception modelling by invariant representation of deep learning for automated structural diagnostic in aircraft maintenance: A study case using DeepSHM. Mech. Syst. Signal Process. 165, 108153. doi:10.1016/j.ymssp.2021.108153
He, C., Shen, Y., and Liu, Z. (2014). Damage localization and quantification of truss structure based on electromechanical impedance technique and neural network. Shock Vib. 2014, 727404. doi:10.1155/2014/727404
Khumaidi, A., Yuniarno, E. M., and Purnomo, M. H. (2017). Welding defect classification based on convolution neural network(CNN) and Gaussian kernel. IEEE, 261–265.
Li, Y. (2019). “Self-supervised representation learning from videos for facial action unit detection[C],” in IEEE conference on computer vision and pattern recognition(CVPR) 2019, oral (IEEE).
Li, Z., He, C., Liu, Z., and Wu, B. (2019). Quantitative detection of lamination defect in thin-walled metallic pipe by using circumferential Lamb waves based on wavenumber analysis method. NDT E Int. Indep. Nondestruct. Test. Eval. 102, 56–67. doi:10.1016/j.ndteint.2018.11.005
Liu, Z., SunSong, K. G., He, C., and Wu, B. (2016). Damage localization in aluminum plate with compact rectangular phased piezoelectric transducer array. Mech. Syst. Signal Process. 70, 625–636. doi:10.1016/j.ymssp.2015.09.022
Lu, G., Li, Y., Wang, T., Xiao, X., and Song, G. (2016). A multi-delay-and-sum imaging algorithm for damage detection using piezoceramic transducers. J. Intelligent Material Syst. Struct. 28 (9), 1150–1159. doi:10.1177/1045389x16666184
Lu, G., and LiSong, Y. G. (2016). A delay-and-Boolean-ADD imaging algorithm for damage detection with a small number of piezoceramic transducers. Smart Mater. Struct. 25 (9), 095030. doi:10.1088/0964-1726/25/9/095030
Ma, F., Chen, J., Wu, J., and Jia, H. (2020). Realizing broadband sub-wavelength focusing and a high intensity enhancement with a space-time synergetic modulated acoustic prison. J. Mater. Chem. C 8 (28), 9511–9519. doi:10.1039/d0tc01984d
Ma, F., Huang, Z., Liu, C., and Wu, J. (2022). Acoustic focusing and imaging via phononic crystal and acoustic metamaterials. J. Appl. Phys. 131, 011103. doi:10.1063/5.0074503
Meng, M., Chua, Y. J., Wouterson, E., and Ong, C. P. K. (2017). Ultrasonic signal classification and imaging system for composite materials via deep convolutional neural networks. Neurocomputing 257, 128–135. doi:10.1016/j.neucom.2016.11.066
Munir, N., Park, J., Kim, H. J., Song, S. J., and Kang, S. S. (2020). Performance enhancement of convolutional neural network for ultrasonic flaw classification by adopting autoencoder. NDT E Int. 111, 102218. doi:10.1016/j.ndteint.2020.102218
Rautela, M., Senthilnath, J., Moll, J., and Gopalakrishnan, S. (2021). Combined two-level damage identification strategy using ultrasonic guided waves and physical knowledge assisted machine learning. Ultrasonics 115, 106451. doi:10.1016/j.ultras.2021.106451
Rizvi, H., and Abbas, M. (2021). Lamb wave damage severity estimation using ensemble-based machine learning method with separate model network. Smart Mater. Struct. 30 (11), 115016. doi:10.1088/1361-665x/ac2e1a
Sadhu, S., He, D., and Huang, C. W. (2021). Wav2vec-C: A self-supervised model for speech representation learning[C]. Interspeech Conf.
Shao, J., Zheng, J., and Zhang, B. (2020). Deep convolutional neural networks for thyroid tumor grading using ultrasound B-mode images. J. Acoust. Soc. Am. 148 (3), 1529–1535. doi:10.1121/10.0001924
Shi, C., Shi, F., and Zhang, B. (2016). Analysis on defect classification by deep neural networks and wavelet packet transform [J]. Acta Acust. 41 (4), 499–506.
Sikdar, S., and Pal, J. (2021). Bag of visual words based machine learning framework for disbond characterisation in composite sandwich structures using guided waves. Smart Mater. Struct. 30 (7), 075016. doi:10.1088/1361-665x/ac01a8
Stepinski, T., Ambrozinski, L., and Uhl, T. (2013). Designing 2D arrays for SHM of planar structures: A review [C]. Conference on nondestructive characterization for composite materials. Aerosp. Eng. Civ. Infrastructure, Homel. Secur. 8694, 86941R. doi:10.1117/12.2010000
Su, C., Jiang, M., Lv, S., Lu, S., Zhang, L., Zhang, F., et al. (2019). Improved damage localization and quantification of CFRP using lamb waves and convolution neural network. IEEE Sensors J. 19 (14), 5784–5791. doi:10.1109/jsen.2019.2908838
Sun, J., Xie, J., and Zhou, H. (2021). “EEG classification with transformer-based models[C],” in 2021 IEEE 3rd global conference on life Sciences and technologies (LifeTech) (IEEE).
Tiwari, K. A., Raisutis, R., and Samaitis, V. (2017). Hybrid signal processing technique to improve the defect estimation in ultrasonic non-destructive testing of composite structures. Sensors 17 (12), 2858. doi:10.3390/s17122858
Zhang, H., Lu, Y., Ma, S., Cao, S., Xia, Q., Liu, Y., et al. (2019). Adaptive sparse reconstruction of damage localization via Lamb waves for structure health monitoring. Computing 101 (6), 679–692. doi:10.1007/s00607-018-00694-0
Keywords: lamb wave, Wav2Vec2.0 neural network, ultrasonic testing, structural health monitoring, defect identification
Citation: Qian L, Liu S, Fan G, Liu X, Zhang H, Mei Y, Xing Y and Wang Z (2023) Damage localization method using ultrasonic lamb waves and Wav2Vec2.0 neural network. Front. Mater. 10:1212909. doi: 10.3389/fmats.2023.1212909
Received: 27 April 2023; Accepted: 10 July 2023;
Published: 09 August 2023.
Edited by:
Fuyin Ma, Xi’an Jiaotong University, ChinaReviewed by:
Yong Li, Nanyang Technological University, SingaporeHui Zhang, Southeast University, China
Maoxun Sun, University of Shanghai for Science and Technology, China
Ben Li, Nanyang Institute of Technology, China
Copyright © 2023 Qian, Liu, Fan, Liu, Zhang, Mei, Xing and Wang. This is an open-access article distributed under the terms of the Creative Commons Attribution License (CC BY). The use, distribution or reproduction in other forums is permitted, provided the original author(s) and the copyright owner(s) are credited and that the original publication in this journal is cited, in accordance with accepted academic practice. No use, distribution or reproduction is permitted which does not comply with these terms.
*Correspondence: Lubin Qian, cWlhbmxiQHN1ZXMuZWR1LmNu; Guopeng Fan, cGhkZmFucnlAc3Vlcy5lZHUuY24=