 Jinwook Yeo1
 Seunghwa Ryu
- 1Department of Mechanical Engineering, Korea Advanced Institute of Science and Technology (KAIST), Daejeon, Republic of Korea
- 2Department of Mechanical Engineering, University of California, Berkeley, Berkeley, CA, United States
Significant attention has been paid to developing highly flexible and highly stretchable strain sensors due to the increasing demand for wearable devices such as motion-capturing devices and health-monitoring devices. Especially, carbon nanotube (CNT) network-based elastomeric sensors have been studied extensively for their unique strong piezoresistive response under large deformation. Despite its importance for the facile design of sensors, the effect of length and volume fraction of CNT on the piezoresistivity over a large strain range has not been fully uncovered. In this study, by combining coarse-grained molecular statics (CGMS) simulations and efficient percolation network analysis, we investigate the piezoresistive response of the CNT network for a wide range of the length and volume fraction and visualized the CNT network topology to understand the mechanism behind the piezoresistivity response. Based on the set of calculations, we obtain the design map of stretchability and sensitivity for the CNT-elastomer nanocomposite sensors over a wide range of design parameters of CNT, which can be used to fabricate the strain sensor with a desired performance.
1 Introduction
The demands for flexible and wearable strain sensors are increasing for versatile applications such as motion-capturing devices, human health monitoring devices, and structural monitoring systems (Lorussi et al., 2005; Yamada et al., 2011; Amjadi et al., 2014; Farooq and Sazonov, 2015; Kwon et al., 2016; Huo et al., 2019; Lu et al., 2019). Therefore, significant efforts have been made to develop strain sensors to meet the requirements of various engineering applications concerning the sensitivity, stretchability, or combination of both (Liu and Choi, 2009; Helmer et al., 2011; Xiao et al., 2011; Zhang et al., 2011; Lu et al., 2012; Wang et al., 2015). One of the promising candidate materials for stretchable strain sensors is the carbon nanotube (CNT) reinforced elastomer nanocomposite which exploits the superior mechanical and electrical properties of CNT. In the nanocomposite, the CNTs form percolation networks that endow electrical conductivity (Kang et al., 2006; Obitayo and Liu, 2012; Sun et al., 2020), and the topology change of the percolation network under mechanical loading leads to the piezoresistive response. Because of the persistent percolationnetwork made of CNTs, the nanocomposites can sustain conductivity under large stretches, which makes them a promising candidate for highly flexible and highly stretchable strain sensors.
It is reported that, in general, the stretchability and sensitivity of sensors are in a trade-off relationship (Song et al., 2018), and the same is true for nanocomposite sensors. If we can properly tune the two characteristics in a trade-off relationship, appropriate CNT-elastomer nanocomposite sensors can be designed for the desired purpose. For this purpose, many studies have been conducted to investigate the piezoresistive effect of the nanocomposite (Hu et al., 2008; Seidel and Lagoudas, 2009; Haghgoo et al., 2020). Theoretical and computational modeling have been conducted extensively to deepen the microscopic origin behind the piezoelectric response (Jung et al., 2019; Mora et al., 2020).
In computational simulations, the topological change of CNT networks under stretch is predicted, and then the resulting resistance change is computed based on percolation analyses (Grujicic et al., 2004; Li and Kim, 2007). The mechanical behavior of CNTs is affected by embedding medium significantly. When CNT networks are embedded in the elastomer as shown in Figure 1A, the response of CNT is rather constrained due to the polymer matrix. By considering the high ratio between Young’s moduli of CNTs and the elastomeric matrix, one can describe the CNT network change based on the affine transformation that preserves a ratio of the distance between any pairs of points (Taya et al., 1998; Hu et al., 2012). This is capable of fast calculation for various cases, which allows the investigation of a wide range of alignment, the volume fraction of CNT, strain range, and so on (Hu et al., 2011; Njuguna et al., 2012; De Vivo et al., 2014). On the other hand, when the CNT network is formed on the polymer substrate as shown in Figure 1B, CNT-to-CNT interaction based on van der Waals forces becomes dominant and CNTs could move much more freely, which can not be modeled by affine transformation unlike in the former case. Lihuan Jin et al. (Jin et al., 2018) introduced coarse-grained molecular statics (CGMS) simulations to exploit the CNT network change considering the interaction between CNTs and determined the resistance change of nanocomposite over deformation. Although their study revealed the key factor determining the piezoresistivity of CNT networks, a wider range of volume fraction of CNT, length of CNT, and strain must be explored to design highly stretchable sensors with desired properties.
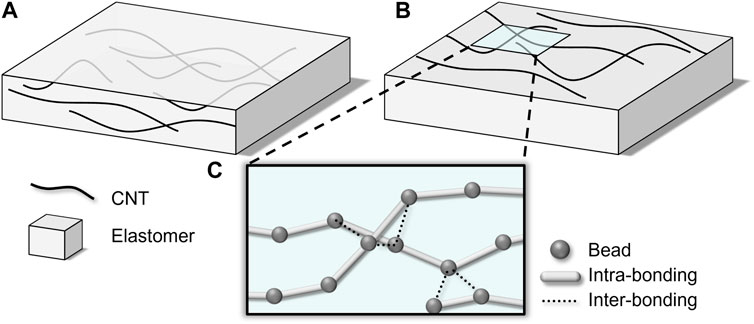
FIGURE 1. Two types of composites in which (A) CNT network is embedded in a polymer and (B) CNT network is coated on a polymer substrate. (C) Configuration of CNT modeled by coarse-grained model.
In this research, we develop an efficient analysis method for analyzing CNT percolation network in the nanocomposites. And, we applied the method for obtaining the piezoresistive sensor performance in a wide range of volume fractions and lengths of CNT under large stretches. We construct the CNT network on a polymer substrate as shown in Figure 2A and employ molecular statics simulation with a coarse-grained force field for intra-CNT and inter-CNT interactions, which makes us to invest more real-like CNT behavior (Levitt, 1976; Gorban and Karlin, 2002; Chen et al., 2011). By adopting a sparse matrix and depth-first search (DFS) algorithm, we significantly reduced the computational time for obtaining percolation analysis compared to existing methods (Lee et al., 2015; Jung et al., 2020), which permits us to consider a large strain range at a low computational cost. The proposed model is utilized to reveal the piezoresistive response of CNT-elastomer nanocomposites over a wide range of length and volume fraction of CNT, and the microscopic origin of the piezoresistive response was analyzed by visualizing the CNT network topology. Last, we provide a design map that can be used as a reference to fabricate CNT-elastomer nanocomposite sensors.
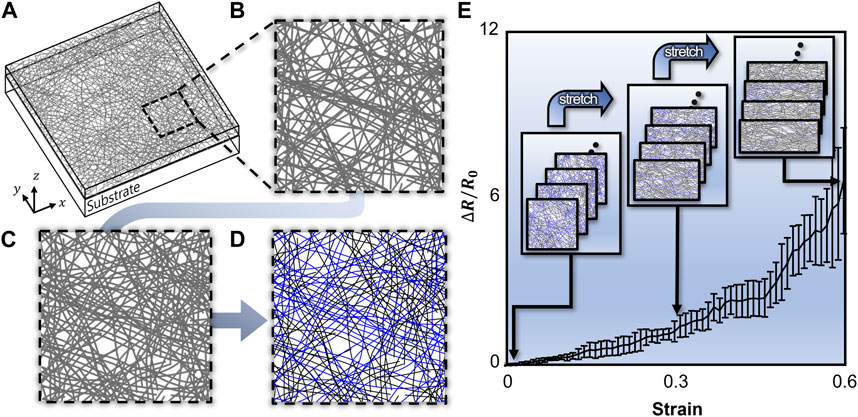
FIGURE 2. (A) Simulation cell for CNT network analysis under periodic boundary conditions along x and y direction (B) Randomly distributed CNT before energy minimization, and (C) CNT network after energy minimization. (D) CNT network classified percolated (blue) and non-percolated (black) CNT. (E) strain versus resistance plot drawn for 10 iterations.
2 Methods
We perform two numerical analyses in series to predict the piezoresistive response of a CNT-elastomer nanocomposite. First, a CGMS simulation modeling is performed to obtain the CNT network topology on an elastomeric substrate over the stretch. Second, the percolation network analysis is performed to analyze the connectivity between CNTs, find the percolating networks, and calculate the effective conductivity of the CNT network.
2.1 Preparation of initial distribution of CNTs
The initial distribution of CNTs is randomly assigned, whereas straight CNTs were considered for convenience. When the geometric properties such as length, volume fraction of CNT, and elastomeric substrate size are given, initial positions and orientations of CNTs, who is as, are randomly chosen as depicted in Figure 2B. To reduce statistical errors originating from the randomly assigned initial CNT networks, for each design parameter set, i.e., length and volume fraction of CNT, 10 different samples are generated and analyzed, and the averaged conductance values at each strain are obtained as shown in Figure 2E.
2.2 CGMS simulation model for CNT network topology
To analyze the distribution and behavior of CNT according to external deformation, Large-scale Atomic/Molecular Massively Parallel Simulator (LAMMPS) is utilized for atomistic simulation, in which the stable configuration of CNTs is obtained through the energy minimization (Plimpton, 1995). Due to the high computational cost of full atomistic simulations, CGMS simulation was introduced for modeling CNT network. In the CGMS simulation model, several atoms or molecules are lumped into a bead as shown in Figure 1C, so that the system’s degree of freedom can be greatly reduced (Fish et al., 2021). For the newly defined beads, the interaction between beads must be defined. In this research, axial direction interaction between two beads in the same CNT, bending interaction between three beads in the same CNT, and interaction between two beads in different CNTs are considered. The interactions are implemented in the model through interatomic potential functions, and the model parameters are determined through a comparison between CGMS and full atomistic simulation (Buehler, 2006), as shown in Table 1 which is calculated under the assumption that the two beads’ equilibrium distance is 10 Å. Besides, the conjugate gradient method is adopted as a minimization method, and the convergence criterion is defined as follows,
where
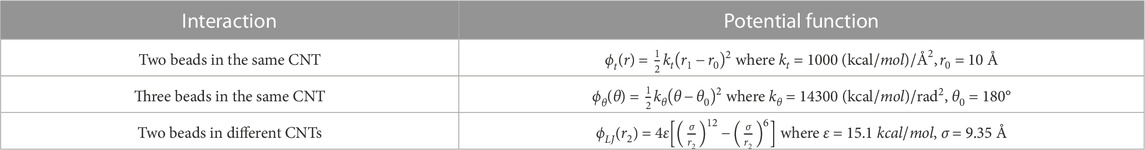
TABLE 1. Interatomic potential function for CNT beads.
2.3 Percolation network analyses and electric conductivity calculation
From the CNT network configuration obtained from the CGMS simulation, the resistances of the composite are calculated by using the percolation analysis (Lee et al., 2015; Jung et al., 2020). As shown in Figures 3A, B, the lines connecting the two neighboring beads in the same CNT are defined as segments having intrinsic resistance. A distance (
where
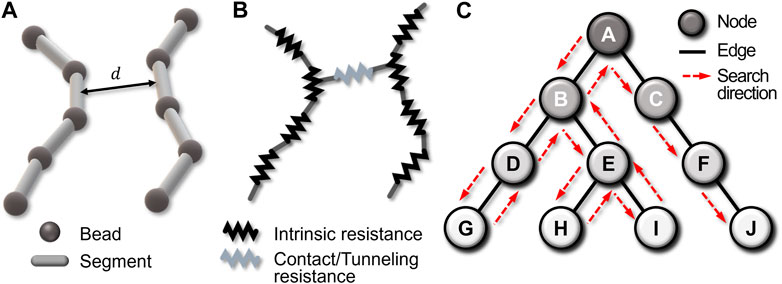
FIGURE 3. (A) CNT network which is represented with a coarse-grained model can be represented as (B) a circuit composed of contact/tunneling and intrinsic resistances. (C) DFS algorithm scheme; From the given example, the algorithm searches in A-B-D-…-C-F-J node order.
Because a CNT segment has only a few connections with other CNT segments, most components of the connectivity matrix are zero, thus the matrix is regarded as a sparse matrix. To eliminate unnecessary information, we introduce a dictionary of key format that contains only positions and values of non-zero components. Consequently, the required memory for connectivity information is dramatically reduced. When the volume fraction and CNT length are 0.16 vol% and 600 nm, respectively, 97% less memory was used for the connectivity matrix.
After that, the depth-firsts search (DFS) algorithm is utilized to find clustered CNTs as shown in Figure 3C. A connectivity graph can be constructed from connectivity information. Each node and edge represent a CNT segment and connectivity between CNT segments, respectively. DFS algorithm starts at an arbitrary node and explores as far as possible along each branch as shown in the red arrows of Figure 3C. If the exploration is no longer available, the algorithm explores backward on the same path to find other nodes to traverse. In the algorithm, CNTs that do not form percolating clusters are filtered out, and only CNT clusters contacted with both sides of walls are extracted as shown in Figure 2D.
Finally, the resistance of CNT-elastomer nanocomposite can be obtained by constructing a matrix containing the clustering information of the CNTs and using Kirchhoff’s law which dictates that the sum of the incoming and outgoing currents to any node in the circuit is zero. The relationship between resistance and voltage for ith node is expressed as follows,
where
where A is the conductance matrix, V is the voltage vector, and B is the source vector. A and B are obtained from resistance information and current source, respectively. The kth component of vector B has a value of assigned voltage. Components of vector B other than the nodes touching either constant voltage boundary are zero, and V indicates the voltage at each node, which is solved using a Cholesky decomposition algorithm for sparse matrices.
3 Result
Before applying the proposed model for investigating the effect of design variables, our model is validated against an experimental measurement of the piezoresistive response of spray-coated carbon nanotubes on PDMS substrates (Lipomi et al., 2011). The length and volume fraction of CNT are set up to 2,400 nm and 0.18 vol%, respectively. As shown in the Figure 4, the average of the estimated value from proposed model is not completely consistent with the experimental results, but the same tendency is shown. And, it is confirmed that the error range of prediction increases because of variability and uncertainty due to randomly dispersed initial CNTs. The experimental result falls within the model’s error bounds, demonstrating that the suggested model covers experiments. So, it could be said the numerical analysis matches well with experiments except for a slight discrepancy at the finite strain range. Hence, we can conclude that the proposed model is reasonable to predict the effect of CNT length and volume fraction on the piezoresistivity.
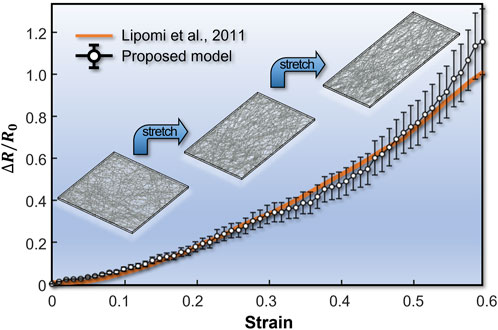
FIGURE 4. Strain versus
3.1 Effect of volume fraction of CNT
To unveil the effect of the CNT volume fraction, the simulation is conducted by changing only the volume fraction while the other design conditions are kept fixed. i.e., length and diameter of CNT are 300 nm and 1 nm, respectively. As depicted in Figure 5A, a similar linear piezoresistive response is observed in the small strain regime (
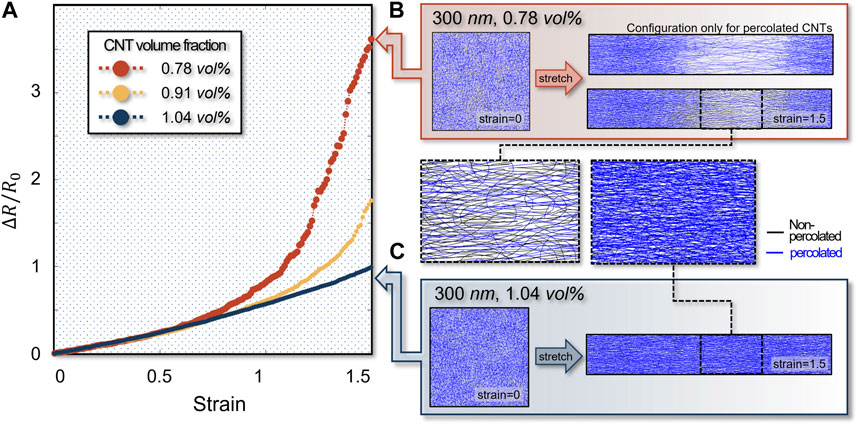
FIGURE 5. (A) Strain versus
3.2 Effect of length of CNT
We also analyzed the piezoresistive response of the CNT composites by varying CNT length and investigated its effect on the piezoresistive response. Here, the volume fraction and diameter of CNT are 0.78 vol% and 1 nm, respectively. Similar to the previous section, in the small strain regime, a linear piezoresistive response is observed regardless of CNT length as shown in Figure 6A. On the other hand, in the high strain regime, composites consisting of shorter CNT fibers show a nonlinear increase of resistance with the strain, whereas composites with longer CNT fibers sustain linear response longer. Figures 6B, C shows that such a nonlinear response originates from the bottleneck in the percolation network topology. This is because the CNT length gets shorter, the percolation network is more sparsely connected and becomes less persistent over the stretch making agglomeration more likely to occur. In short, the initiation of nonlinear behavior became faster with a smaller length of CNT for fixed volume fraction and diameter of CNT.
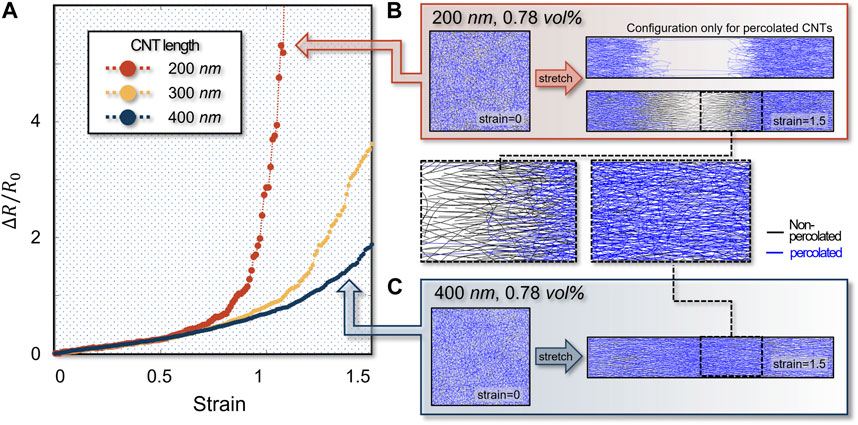
FIGURE 6. (A) Strain versus
3.3 Performance map
Using the proposed numerical model, we modeled the piezoresistive response for 51 different combinations of volume fraction and length to generate a performance map in Figure 7. Figure 7A visualizes the maximum strain at which the composite has a linear piezoresistive response, which can be interpreted as the stretchability of the sensor. The stretchability is interpreted by the linearly stretchable range and defined as the maximum strain with
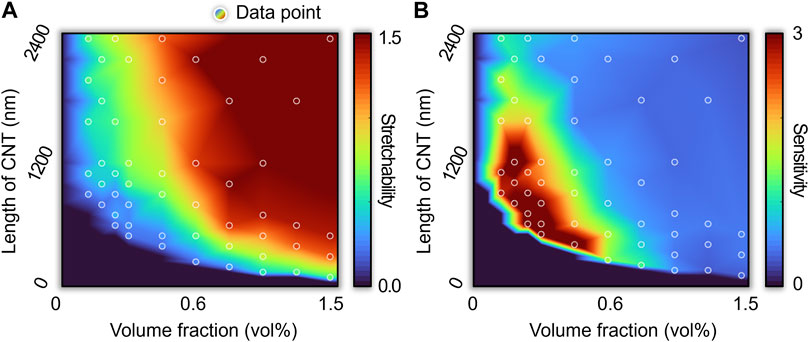
FIGURE 7. (A) Stretchability and (B) sensitivity map when volume fraction and length of CNT are design parameters. The lower left region forms a non-percolation network. The stretchability is defined as linearly stretchable range. The sensitivity is represented by a gauge factor within linear response range.
In the very low volume fraction or short length regime (lower left corner of the performance map), there is no piezoresistivity because no percolation network is formed. In the very large volume fraction and long length regime, the percolation network is very densely connected. Despite very high stretchability, the predicted sensitivity is low because the uniformly connected percolation network persists until a large mechanical strain is applied. In the volume fraction and length ranges just above the percolation threshold (a convex region connecting the upper left corner to the lower right corner), the gauge factor is very large because the percolation network topology changes significantly over the strain, but its stretchability is very limited. Overall, the performance map shows the trade-off relationship between the stretchability and the sensitivity (i.e., gauge factor). The performance map can serve as a guideline for designing the piezoresistive sensors to achieve the desired stretchability and sensitivity by considering the performance limit.
4 Conclusion
In this research, based on an efficient numerical model for predicting the piezoresistivity response of coated CNT network-based nanocomposites, we constructed a performance map featuring stretchability and sensitivity. Based on an efficient sparse matrix-based algorithm, we reduce the computing time for percolation analyses, which enabled us to effectively obtain the piezoresistive response in a large strain range for a variety of combinations of volume fraction and length of CNT. First, we show that the piezoresistive response predicted from our simulation model matches well with existing experimental measurements. Second, we identify the microscopic origin behind the transition between linear and nonlinear piezoresistive response upon volume fraction or length change. Moreover, we construct the strain sensing performance map showing the stretchability and sensitivity over a wide range of volume fractions and lengths, which has not been explored in detail so far. We expect that the performance map can serve as a guideline to design CNT-elastomer nanocomposite piezoresistive sensors.
Data availability statement
The raw data supporting the conclusion of this article will be made available by the authors, without undue reservation.
Author contributions
JY and SR contributed to conception and design of the study. JY implemented simulation code, collected data, and analyzed the result under the guidance of SR. JJ provided feedback and helped shape the research. JY wrote the first draft of the manuscript with support from JJ. All authors contributed to the article and approved the submitted version.
Funding
This work is financially supported by the National Research Foundation of Korea (NRF) (2022R1A2B5B02002365).
Conflict of interest
The authors declare that the research was conducted in the absence of any commercial or financial relationships that could be construed as a potential conflict of interest.
Publisher’s note
All claims expressed in this article are solely those of the authors and do not necessarily represent those of their affiliated organizations, or those of the publisher, the editors and the reviewers. Any product that may be evaluated in this article, or claim that may be made by its manufacturer, is not guaranteed or endorsed by the publisher.
References
Amjadi, M., Pichitpajongkit, A., Lee, S., Ryu, S., and Park, I. (2014). Highly stretchable and sensitive strain sensor based on silver nanowire–elastomer nanocomposite. ACS nano8, 5154–5163. doi:10.1021/nn501204t
Buehler, M. J. (2006). Mesoscale modeling of mechanics of carbon nanotubes: Self-assembly, self-folding, and fracture. J. Mater. Res.21, 2855–2869. doi:10.1557/jmr.2006.0347
Büttiker, M., Imry, Y., Landauer, R., and Pinhas, S. (1985). Generalized many-channel conductance formula with application to small rings. Phys. Rev. B31, 6207–6215. doi:10.1103/physrevb.31.6207
Chen, Y., Zimmerman, J., Krivtsov, A., and Mcdowell, D. L. (2011). Assessment of atomistic coarse-graining methods. Int. J. Eng. Sci.49, 1337–1349. doi:10.1016/j.ijengsci.2011.03.018
DE Vivo, B., Lamberti, P., Spinelli, G., Tucci, V., Vertuccio, L., and Vittoria, V. (2014). Simulation and experimental characterization of polymer/carbon nanotubes composites for strain sensor applications. J. Appl. Phys.116, 054307. doi:10.1063/1.4892098
Farooq, M., and Sazonov, E. (2015). Wearable Electronics sensors. Springer. Strain sensors in wearable devices.
Fish, J., Wagner, G. J., and Keten, S. (2021). Mesoscopic and multiscale modelling in materials. Nat. Mater.20, 774–786. doi:10.1038/s41563-020-00913-0
Forro, L., and Schoenenberger, C. (2001). Physical properties of multi-wall nanotubes. Carbon nanotubes: Synthesis, structure, properties, and applications. Springer.
Gorban, A. N., and Karlin, I. V. (2002). Macroscopic dynamics through coarse-graining: A solvable example. Phys. Rev. E65, 026116. doi:10.1103/physreve.65.026116
Grujicic, M., Cao, G., and Roy, W. (2004). A computational analysis of the percolation threshold and the electrical conductivity of carbon nanotubes filled polymeric materials. J. Mater. Sci.39, 4441–4449. doi:10.1023/b:jmsc.0000034136.11779.96
Haghgoo, M., Hassanzadeh-Aghdam, M., and Ansari, R. (2020). A comprehensive evaluation of piezoresistive response and percolation behavior of multiscale polymer-based nanocomposites. Compos. Part A Appl. Sci. Manuf.130, 105735. doi:10.1016/j.compositesa.2019.105735
Helmer, R., Farrow, D., Ball, K., Phillips, E., Farouil, A., and Blanchonette, I. (2011). A pilot evaluation of an electronic textile for lower limb monitoring and interactive biofeedback. Procedia Eng.13, 513–518. doi:10.1016/j.proeng.2011.05.123
Hu, B., Hu, N., Li, Y., Akagi, K., Yuan, W., Watanabe, T., et al. (2012). Multi-scale numerical simulations on piezoresistivity of CNT/polymer nanocomposites. Nanoscale Res. Lett.7, 402–411. doi:10.1186/1556-276x-7-402
Hu, N., Fukunaga, H., Atobe, S., Liu, Y., and Li, J. (2011). Piezoresistive strain sensors made from carbon nanotubes based polymer nanocomposites. Sensors11, 10691–10723. doi:10.3390/s111110691
Hu, N., Masuda, Z., Yan, C., Yamamoto, G., Fukunaga, H., and Hashida, T. (2008). The electrical properties of polymer nanocomposites with carbon nanotube fillers. Nanotechnology19, 215701. doi:10.1088/0957-4484/19/21/215701
Huo, Q., Jin, J., Wang, X., Lu, S., Zhang, Y., Ma, J., et al. (2019). Preparation of graphene-based sensor and its application in human behavior monitoring. Mater. Res. Express6, 075613. doi:10.1088/2053-1591/ab17ac
Jin, L., Chortos, A., Lian, F., Pop, E., Linder, C., Bao, Z., et al. (2018). Microstructural origin of resistance-strain hysteresis in carbon nanotube thin film conductors. Proc. Natl. Acad. Sci. U. S. A.115, 1986–1991. doi:10.1073/pnas.1717217115
Jung, J., Lee, S., Pugno, N. M., and Ryu, S. (2020). Orientation distribution dependence of piezoresistivity of metal nanowire-polymer composite. Multiscale Sci. Eng.2, 54–62. doi:10.1007/s42493-020-00035-4
Jung, S., Choi, H. W., Mocanu, F. C., Shin, D.-W., Chowdhury, M. F., Han, S. D., et al. (2019). Modeling electrical percolation to optimize the electromechanical properties of CNT/polymer composites in highly stretchable fiber strain sensors. Sci. Rep.9, 20376–20410. doi:10.1038/s41598-019-56940-8
Kang, I., Schulz, M. J., Kim, J. H., Shanov, V., and Shi, D. (2006). A carbon nanotube strain sensor for structural health monitoring. Smart Mater. Struct.15, 737–748. doi:10.1088/0964-1726/15/3/009
Klimm, W., and Kwok, K. (2022). Tunneling resistance model for piezoresistive carbon nanotube polymer composites. Nanotechnology34, 045502. doi:10.1088/1361-6528/ac9c0d
Kwon, D., Lee, T. I., Shim, J., Ryu, S., Kim, M. S., Kim, S., et al. (2016). Highly sensitive, flexible, and wearable pressure sensor based on a giant Piezocapacitive effect of three-Dimensional Microporous elastomeric Dielectric Layer. ACS Appl. Mater Interfaces8, 16922–16931. doi:10.1021/acsami.6b04225
Lee, S., Amjadi, M., Pugno, N., Park, I., and Ryu, S. (2015). Computational analysis of metallic nanowire-elastomer nanocomposite based strain sensors. AIP Adv.5, 117233. doi:10.1063/1.4936635
Levitt, M. (1976). A simplified representation of protein conformations for rapid simulation of protein folding. J. Mol. Biol.104, 59–107. doi:10.1016/0022-2836(76)90004-8
Li, J., and Kim, J.-K. (2007). Percolation threshold of conducting polymer composites containing 3D randomly distributed graphite nanoplatelets. Compos. Sci. Technol.67, 2114–2120. doi:10.1016/j.compscitech.2006.11.010
Lipomi, D. J., Vosgueritchian, M., Tee, B. C., Hellstrom, S. L., Lee, J. A., Fox, C. H., et al. (2011). Skin-like pressure and strain sensors based on transparent elastic films of carbon nanotubes. Nat. Nanotechnol.6, 788–792. doi:10.1038/nnano.2011.184
Liu, C.-X., and Choi, J.-W. (2009). “An embedded PDMS nanocomposite strain sensor toward biomedical applications,” in Annual International Conference of the IEEE Engineering in Medicine and Biology Society (IEEE), 6391–6394.
Lorussi, F., Scilingo, E. P., Tesconi, M., Tognetti, A., and DE Rossi, D. (2005). Strain sensing fabric for hand posture and gesture monitoring. IEEE Trans. Inf. Technol. Biomed.9, 372–381. doi:10.1109/titb.2005.854510
Lu, N., Lu, C., Yang, S., and Rogers, J. (2012). Highly sensitive skin-mountable strain gauges based entirely on elastomers. Adv. Funct. Mater.22, 4044–4050. doi:10.1002/adfm.201200498
Lu, S., DU, K., Wang, X., Tian, C., Chen, D., Ma, K., et al. (2019). Real-time monitoring of low-velocity impact damage for composite structures with the omnidirection carbon nanotubes’ buckypaper sensors. Struct. health Monit.18, 454–465. doi:10.1177/1475921718757937
Mora, A., Verma, P., and Kumar, S. (2020). Electrical conductivity of CNT/polymer composites: 3D printing, measurements and modeling. Compos. Part B Eng.183, 107600. doi:10.1016/j.compositesb.2019.107600
Njuguna, M., Yan, C., Hu, N., Bell, J., and Yarlagadda, P. (2012). Sandwiched carbon nanotube film as strain sensor. Compos. Part B Eng.43, 2711–2717. doi:10.1016/j.compositesb.2012.04.022
Obitayo, W., and Liu, T. (2012). A review: Carbon nanotube-based piezoresistive strain sensors. J. Sensors, 2012, 1–15. doi:10.1155/2012/652438
Plimpton, S. (1995). Fast parallel algorithms for short-range molecular dynamics. J. Comput. Phys.117, 1–19. doi:10.1006/jcph.1995.1039
Seidel, G. D., and Lagoudas, D. C. (2009). A micromechanics model for the electrical conductivity of nanotube-polymer nanocomposites. J. Compos. Mater.43, 917–941. doi:10.1177/0021998308105124
Simmons, J. G. (1963). Generalized formula for the electric tunnel effect between similar electrodes separated by a thin insulating film. J. Appl. Phys.34, 1793–1803. doi:10.1063/1.1702682
Song, Z., Li, W., Bao, Y., Han, F., Gao, L., Xu, J., et al. (2018). Breathable and skin-mountable strain sensor with tunable stretchability, sensitivity, and Linearity via Surface strain Delocalization for versatile skin Activities' Recognition. ACS Appl. Mater Interfaces10, 42826–42836. doi:10.1021/acsami.8b14365
Sun, X., Qin, Z., Ye, L., Zhang, H., Yu, Q., Wu, X., et al. (2020). Carbon nanotubes reinforced hydrogel as flexible strain sensor with high stretchability and mechanically toughness. Chem. Eng. J.382, 122832. doi:10.1016/j.cej.2019.122832
Taya, M., Kim, W., and Ono, K. (1998). Piezoresistivity of a short fiber/elastomer matrix composite. Mech. Mater.28, 53–59. doi:10.1016/s0167-6636(97)00064-1
Wang, X., Lu, S., Ma, K., Xiong, X., Zhang, H., and Xu, M. (2015). Tensile strain sensing of buckypaper and buckypaper composites. Mater. Des.88, 414–419. doi:10.1016/j.matdes.2015.09.035
Xiao, X., Yuan, L., Zhong, J., Ding, T., Liu, Y., Cai, Z., et al. (2011). High-strain sensors based on ZnO nanowire/polystyrene hybridized flexible films. Adv. Mater.23, 5440–5444. doi:10.1002/adma.201103406
Yamada, T., Hayamizu, Y., Yamamoto, Y., Yomogida, Y., Izadi-Najafabadi, A., Futaba, D. N., et al. (2011). A stretchable carbon nanotube strain sensor for human-motion detection. Nat. Nanotechnol.6, 296–301. doi:10.1038/nnano.2011.36
Zhang, J., Liu, J., Zhuang, R., Mäder, E., Heinrich, G., and Gao, S. (2011). Single MWNT-glass fiber as strain sensor and switch. Adv. Mater.23, 3392–3397. doi:10.1002/adma.201101104
Keywords: piezoresistive effect, percolation network, coarse-grained molecular statics, CNT-elastomer nanocomposite, numerical simulation
Citation: Yeo J, Jung J and Ryu S (2023) Coarse-grained modeling for predicting the piezoresistive response of CNT-elastomer nanocomposite. Front. Mater. 10:1219688. doi: 10.3389/fmats.2023.1219688
Received: 09 May 2023; Accepted: 21 June 2023;
Published: 06 July 2023.
Edited by:
Nicola Maria Pugno, University of Trento, ItalyReviewed by:
Wang Xiaoqiang, Shenyang Aerospace University, ChinaAndreas Schiffer, Khalifa University, United Arab Emirates
Copyright © 2023 Yeo, Jung and Ryu. This is an open-access article distributed under the terms of the Creative Commons Attribution License (CC BY). The use, distribution or reproduction in other forums is permitted, provided the original author(s) and the copyright owner(s) are credited and that the original publication in this journal is cited, in accordance with accepted academic practice. No use, distribution or reproduction is permitted which does not comply with these terms.
*Correspondence: Seunghwa Ryu, cnl1c2hAa2Fpc3QuYWMua3I=