 Hong Guo1,2
 Shaofei Wang1,2Chen Guo1,2
 Kuibin Yang1,2Rui Guo1,2
 Jiangtao Fu1,2Yalin Nan3,4*
 Mingjiang Tao5*
- 1School of Civil Engineering and Architecture, Shaanxi University of Technology, Hanzhong, China
- 2Research Center of Geotechnical Environment and Geological Hazards Control in Qinling-Daba Mountains, Shaanxi University of Technology, Hanzhong, China
- 3China Electronic Research Institute of Engineering Investigations and Design, Xi’an, China
- 4Shaanxi Provincial Soil Engineering Technology Research Center, Xi’an, China
- 5Department of Civil and Environmental Engineering, Worcester Polytechnic Institute, Worcester, MA, United States
In this study, we investigated the effect of particle size distribution on the shear properties of sand. Direct shear tests were conducted using four types of sand samples with different particle size distributions obtained from standard sand produced by Xiamen ISO Co. Ltd. The results show that the influence of particle size distribution on the internal friction angle was significant. Typically, the internal friction angle increases with increasing the coefficient of non-uniformity (Cu) and decreasing the curvature coefficient (Cc). The discrete element results show that the initial particle size distribution significantly affects the porosity, coordination number, and particle slide fraction. In addition, the grey relation analysis revealed that the sliding fraction and coordination number have the greatest correlation with the internal friction angle. The research results of this study help to understand the changes in particle contact, internal stress, and particle sliding during the shear failure process of sand.
1 Introduction
Sandy soil, as a porous material (Bai et al., 2017) is widely used in practical geotechnical engineering, such as rockfill dams, sandy soil foundations, slopes, etc. (Sato et al., 2022; Kamalzadeh and Pender, 2023; Pei et al., 2023). Researches showed that sand’s physical and mechanical properties are closely related to its particle size (BELKHATIR et al., 2011; Murat and Eyubham, 2020; Li et al., 2022; Wang et al., 2022), or rearrangement (Bai Bing Zhou et al., 2021), even reinforced sand is no exception (Liu et al., 2022). It is difficult for conventional geotechnical tests to understand the deeper mechanism of the shear deformation of sand. Therefore, discrete element numerical analysis has been widely increasing in the mechanical property analysis of sand (Ibrahim and Meguid, 2023; Li et al., 2023; Xie et al., 2023). The discrete element can easily consider the effect of sand particle gradation. Kong and Jiefeng, 2013) studied the shear characteristics of Qingdao sea sand. They observed that sand with better gradation shows higher shear strength, larger local coordination number, and weaker dilatancy. Liu Yingjing Wang Jianhua Yin Zhenyu, 2015) established the correspondence between the particle gradation index non-uniformity coefficient (Cu) and the critical state parameters of granular materials. They introduced the critical state mechanical characteristics related to particle size into the constitutive model of sand. Li (2013) observed that the larger the content of coarse particles, the greater the internal friction, which was also reported by Vangla and Latha (2015). Belkhatir et al. (2012) analyzed the influence of effective particle size d10, average particle size d50, and non-uniformity coefficient Cu on the shear peak of sand, and found that the shear peak of sand increases with d10 and d50, decreases with Cu. Bayat and Bayat (2013) observed that under constant d50, the shear strength increases with Cu. For discontinuously graded sand, decreasing d50 can increase its shear strength. Havaee et al. (2015) studied sandy soil in central Iran as a research object equation and established the prediction of the internal friction angle and cohesion of the soil with the content of each component (clay, silt, sand, gravel, etc.) as a variable. Sezer (2013) proposed an internal friction angle fitting equation that considers the regularity of particles, fractal dimension, curvature coefficients (Cc), d10, and relative density. However, there are currently no literature reports on how Cc and Cu jointly affect the shear strength of sand. In addition, the relationship between the mesoscopic indexes, such as porosity, coordination number and contact slip of sand in the shear process, and the shear process needs further study.
Further research is still needed in the following two aspects: one is establishing a quantitative relationship between the particle gradation parameters, such as non-uniformity and curvature coefficient, and the shear strength of the sand is rarely reported in the literature; another is investigating the effect of the combining porosity, coordination number, and particle contact slip on the shear strength of sand.
Based on this, the standard sand (hereinafter referred to as standard sand) produced by Xiamen Aisou Company was used as the primary raw material. Sand samples of different grades were prepared. Laboratory shear tests were conducted to obtain the particle size parameters and their influence on the internal friction angle. Due to the indoor direct shear test limitations, analyzing the microscopic changes of sand samples during the shearing process was quite difficult. Therefore, this paper applied the particle flow analysis software PFC2D to prepare discrete element numerical samples with the same gradation as the laboratory test. The mechanical properties of the particle-level paired sands were further explained by the changes in microscopic indicators such as porosity, coordination number, and sliding fraction.
2 Direct shear test
Standard sand was used as the raw material, and its relative density was 2.66. The sand was sieved through standard sieves (round hole) of 4, 2, 1, 0.75, 0.5, 0.25, and 0.1 mm, and sand samples of different grades were configured. In this test, the sand sample has a total of four gradations, namely A, B, C, and D. The particle gradation curve is shown in Figure 1. The Cc and Cu values of different graded sand samples were calculated based on d10, d30, and d60, as shown in Table 1. The direct shear test was conducted using a direct shear instrument by Nanjing Soil Instrument Factory. The sand was dried and packed in a 6.18 cm diameter and 2 cm height shear box. The initial state was considered medium sand, and the initial void ratio
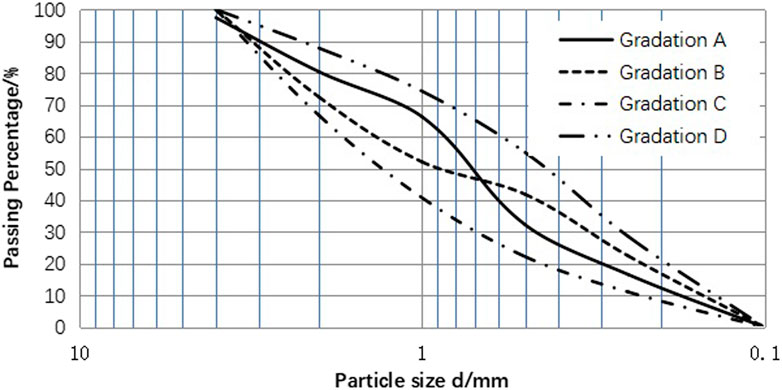
FIGURE 1. Particle size distributions of 4 types of sands.
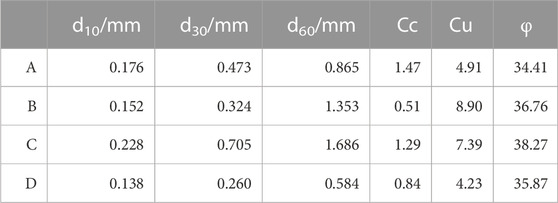
TABLE 1. Cc and Cu values of 4 types of sands.
Each group of sand samples was tested in parallel three times, and the shear stress under each level of vertical pressure was finally obtained. The average value was denoted as the basic value of the histogram, and the standard deviation as the error line, as shown in Figure 2. The slopes of the histograms of each group were fitted to 0.685, 0.747, 0.789, and 0.723, and the arc tangent values were calculated. The internal friction angles of the four groups of sand samples were 34.41°, 36.76°, 38.27°, and 35.87°.
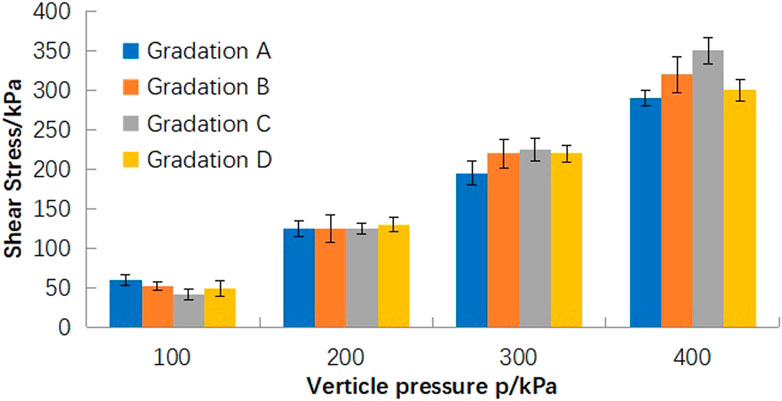
FIGURE 2. Vertical pressure-shear stress histogram of 4 graded sand samples.
Based on Table 1, it is easy to observe that from the curvature coefficient (Cc) and non-uniformity coefficient (Cu), the engineering evaluation of gradation C is good, and its internal friction angle is relatively the largest. This indicates the importance of particle grading in practical engineering. The internal friction angle of gradation B is also relatively large due to its large non-uniformity coefficient (Cu). Although its curvature coefficient (Cc) indicates that it is not a well graded soil. This indicates that, compared to the curvature coefficient (Cc), the non-uniformity coefficient (Cu) is the main factor affecting the internal friction angle. This has been verified in the gradation A soil samples, as although the curvature coefficient (Cc) of gradation A soil is between 1 and 3, the internal friction angle is small due to the small non-uniformity coefficient (Cu). In addition, comparing gradation A and D, it can be observed that the internal friction angle decreases with the increase of curvature coefficient.
3 DEM simulation analysis
Direct shear test, as a method to study the macro shear characteristics of soil, has some limitations. For example, it fails to understand the action mechanism from a meso-level. Therefore, it is imperative to investigate the contact change and internal stress of sand particles of different grades in the shearing process. The discrete element method (numerical direct shear test) is the better way to achieve this goal.
3.1 Numerical experiment
(a) 2D numerical packing fraction
Two-dimensional particles (discs) were used to simulate three-dimensional particles (spheres). The particle porosity (n) and the degree of compaction varied with the dimensions of the same particle system. Therefore, referring to the ideas of soil mechanics, the concept of relative density was used to link the relative density in three dimensions (3d) with the relative density in two dimensions (2d). According to the concept of relative density, there are:
where e is the void ratio (
The relationship between packing fraction
Therefore, we get
where
Substituting the value of the initial void ratio (
(b) Discrete Element Modeling
The DEM simulation applied a linear elastic contact model to establish a two-dimensional shear test model. The sample size was consistent with the indoor shear sample, with 2 cm high and 6.18 cm wide. The sample used the layering method of Jiang et al. (2003). The dimensions as those of the indoor shear test were maintained, and the effect of sample size was overlooked for the time being (Omar and Sadrekarimi, 2014; Park and Jeong, 2015). Consistent with the indoor test, the lateral compression test and angle of repose test were used to calibrate the sand particles’ stiffness and friction coefficient. The microscopic parameters of the simulated sand particles are shown in Table 2. The shear box stiffness was selected as ten times the sand’s stiffness as 100,000 kN m–1; irrespective of the shear box roughness, its friction coefficient was 0. Notably, the particle size in the discrete element simulation was set according to the gradation of the actual particles. The system’s local damping uses the default value of 0.7, and the normal and tangential stiffness of the sand particles use the same value. The Cc and Cu values were also consistent with the laboratory test values. The method for obtaining important microscopic parameters is shown in the Figure 3. As shown in Figures 3A–D are discrete element model diagrams under the four particle gradations of A, B, C, and D, respectively. Three measuring circles, 1, 2, and 3, were set on each gradation of the numerical samples to capture the variation of the mesoporosity, coordination number, local shear stress, and particle slip of the numerical samples (Figure 4). The radius of the measuring circles was 5 mm, and the centers were 1, 3, and 5 cm from the left side of the shear box. Fish language programming was used to simulate the process of direct cutting. The lower part of the cutting box was fixed. When the vertical pressure was applied and stabilized, the upper part of the cutting box was moved to the left at a constant speed, and the cutting rate was controlled to 1 mm/min. The shear failure criterion was used at the peak value of the shear displacement of 6 mm.

TABLE 2. Microscopic parameters of numerical samples.
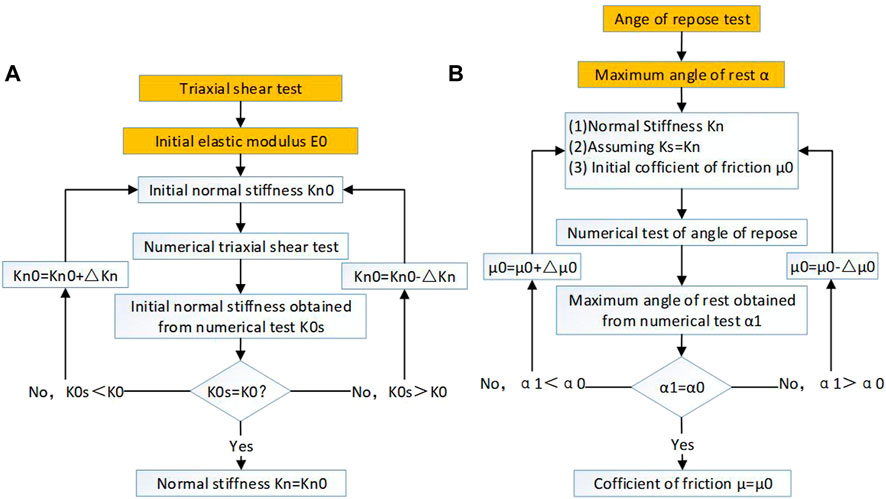
FIGURE 3. Process for obtaining stiffness and friction coefficient in discrete element simulation: (A) stiffness; (B) coefficient of friction.
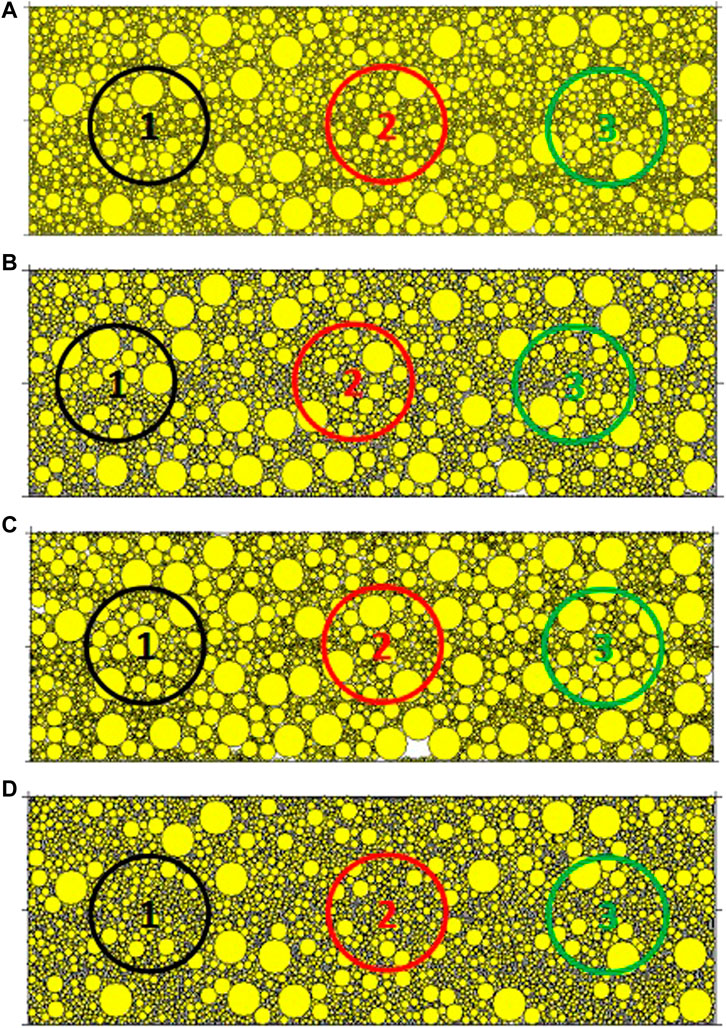
FIGURE 4. Discrete model of 4 types of sands: (A) Gradation A; (B) Gradation B; (C) Gradation C; (D) Gradation D.
Figure 5A is the force chain diagram of gradation A under a steady vertical compressive stress. Figure 5B is the force chain diagram of gradation A immediately after the shear stress peaks. The black line in the figure is the force chain, and its width is proportional to the magnitude of the force. The higher the density of the force chain, the more particles in that area come into contact with each other. The force chain diagrams of the other samples in these two cases are similar to those of the gradation C and, therefore, not listed here individually. Before shearing, the entire specimen reaches equilibrium under the action of vertical compressive stress (the figure uses 100 kPa vertical compressive stress as an example). The main force chain after shear failure is distributed from the upper right corner to the lower left corner of the shear box. The force chain distribution at the upper part of the shear box is left sparse and right dense. Thus, it explains that in actual shear tests, the shear “lift” phenomenon of the top cover of the cutting box near the shearing force is essentially the dilatancy effect of sand particles.
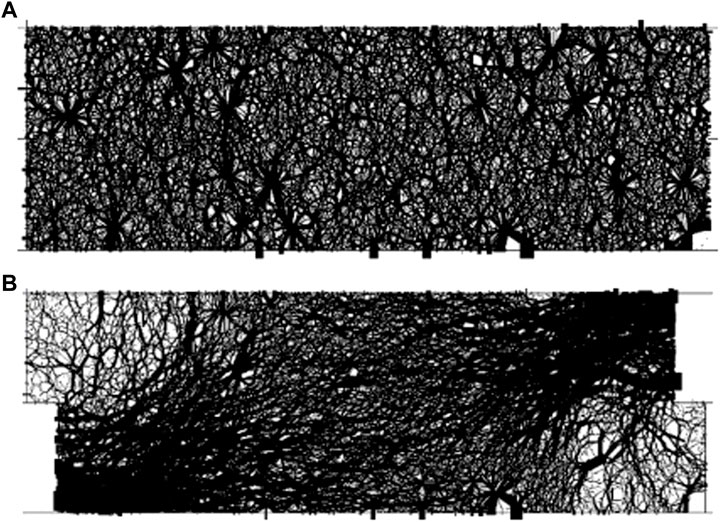
FIGURE 5. Force chain distribution before and after shearing: (A) Force chain diagram before shearing; (B) Force chain diagram after shearing.
3.2 Coordination number
The particles produce local dilatancy or shrinkage during shearing in the macroscopic view. The dilatancy and shrinkage of particles vary with different initial packing fractions and particle gradations. This study focused on analyzing the meso-particle contact situation of different grading particles and ignored the different initial packing fractions for the time being. Therefore, this section explores the change law of the coordination number under different particle gradations.
The coordination number is a parameter characterizing the closeness of the particle contact in a certain range. For one particle, the coordination number refers to the number of other particles in contact with the particle. For particles in a region, the coordination number is the ratio of the total number of particles with particles in a specific range to the total number of particles. Its expression is shown in Eq. 4:
where
Figure 6 shows the variation in the coordination number of the particles in the three measurement circles with shear displacement. The effect of the gradation coordination number is pronounced. Gradation D exhibited the highest content of fine particles in the three measurement circles because it had the largest content of fine particles and relatively close contact with large particles. Although the fine particle content of gradation A in Figure 6A is smaller than that of gradation D, its coordination number reaches the maximum in the later stage, which indicates that the samples with good gradation were in closer contact with each other in the late stage of shear. The coordination numbers in Figures 6B, C increased and decreased, respectively, which is consistent with the nature of the porosity changes analyzed earlier. Figure 6D shows the coordination law of different positions during gradation A (the situation of gradation B, C, and D is similar to that of gradation A). When the shear displacement is small, the coordination numbers in circle 1 and circle 2 gradually increase, indicating that the particles at the middle and right ends of the shear box more closely mesh with each other during the shearing process. However, with the continuous increase of the shear displacement, the coordination number at the right end decreased, and the corresponding coordination number at the middle continuously increased, indicating that the shear “pushes” the middle particles to continue to bite. The coordination number of particles at the left end of the shear box kept decreasing, indicating that its bite was weakened and its fluidity was enhanced.
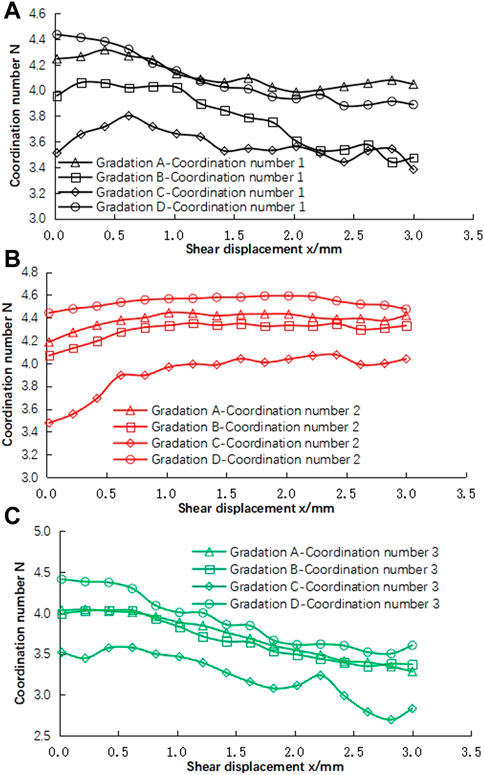
FIGURE 6. Relation curve of coordination number vs. shear displacement: (A) relations of shear displacement vs. coordination number of measure circle 1; (B) relations of shear displacement vs. coordination number of measure circle 2; (C) relations of shear displacement vs. coordination number of measure circle 3.
The coordination number in Figure 6 is averaged over the entire shear displacement, and the results are shown in Table 3. For different positions, the average coordination number of gradation C was the lowest, and the average coordination number of gradation B was the second lowest. In measurement circle 1, the average coordination number of gradation A was the highest, and the average coordination number of gradation D was the second highest. The above rule seems to be the opposite of the internal friction angle rule, except for measurements 2 and 3, where the gradations A and D are slightly different.
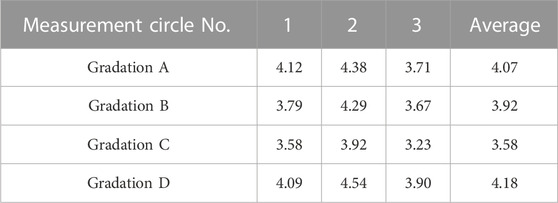
TABLE 3. Coordination number of different gradations at different positions.
3.3 Variation of local shear stress
The shear stress at different shear positions (inside the measurement circle) is obtained by Eq. 5:
where
Figure 7 shows the typical relationship between local shear stress vs. shear displacement. The shear stress near the shear direction (green line in the figure), the shear stress far from the shear direction (black line in the figure), and the shear stress in the middle part of the sample (red line in the figure) reaching the peak particle grading vary. For example, in gradation A, the order of peak shear stress is measurement circle 1> measurement circle 3> measurement circle 2. Also, the initial slope of the local shear stress curve of measurement circle 2 is significantly lower. The overall trend of other gradation situations is identical to that of gradation A and is not repeated in this section. Thus, while shearing, the shear box boundary significantly constrained the local shear stress (measurement circles 1 and 3 are on the left and right boundaries, respectively). Further, the peak value of measurement circle 1 is the largest because the upper shear box is pushed from right to left, and the particles near the left border squeeze slightly.
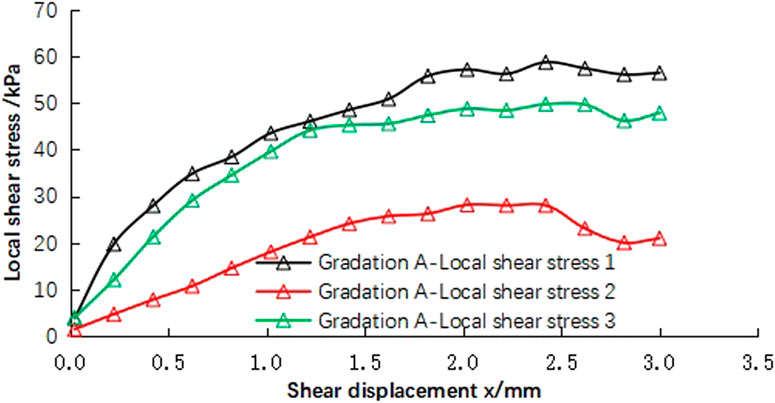
FIGURE 7. Relationship between local shear stress vs. shear displacement (Gradation A).
3.4 Sliding fraction
In the discrete element simulation, the particle sliding fraction is measured by the ratio of the contacts that cause slippage to the total number of contacts. Table 4 summarizes the average particle sliding fraction over the whole shear displacement at different positions (measurement circles) under different gradations. Generally, the sliding fraction of gradation C is the largest, and that of gradation A is the smallest. This behavior is nearly the same as the law of influence of the internal friction angle of the gradation.
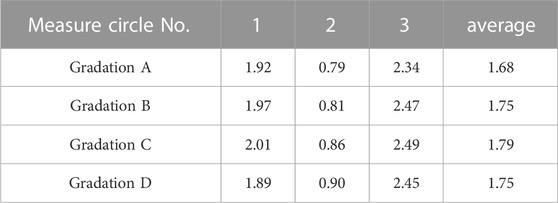
TABLE 4. Particle slide fraction of different gradations at different positions (%).
3.5 Grey relation analysis
This section used the grey relation theory (Zhao et al., 2023) to analyze the correlation between the four factors of uniformity coefficient—Curvature coefficient, coordination number, sliding fraction, and the angle of internal friction. The relevant parameters are listed in Table 5 and are represented as a matrix in Eq. 6. It should be noted that the coordination number and sliding fraction are the average values in the shearing process.
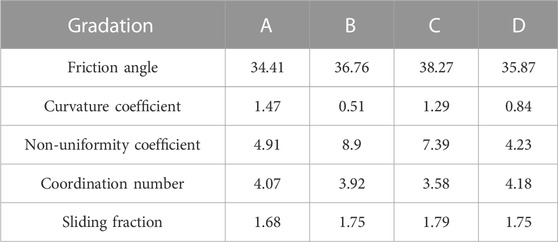
TABLE 5. Particle slide fraction of different gradations at different positions (%).
Defining the first column in the matrix as the reference data column, we get
Then all values in the table, including the friction angle, were normalized using
The resolution coefficient
By considering the average of the relation coefficient in the entire gradation range, we get the following:
This indicates that the correlation between sliding fraction and internal friction angle is strongest, and it is not that sliding fraction affects the internal friction angle. The larger the internal friction angle, the more fully the particles engage, and the more obvious the sliding phenomenon of particles during shear failure. The correlation between coordination number and internal friction angle can also be explained in this way. Due to the fact that the non-uniformity and curvature coefficients of samples with different gradations remain unchanged throughout the shear test, it can be seen from
4 Conclusion and discussion
The research of this paper can be summarized as the following conclusions:
(1) The indoor direct shear test results and grey correlation analysis both indicate that the non-uniformity coefficient and curvature coefficient of sand particles have a significant impact on the internal friction angle, but the non-uniformity coefficient has a relatively large impact. Specifically, the larger the non-uniformity coefficient, the larger the internal friction angle, the larger the curvature coefficient, and the smaller the internal friction angle.
(2) The results of force chain analysis explain the stress concentration and dilatancy in the sand direct shear test from the meso perspective. Through the change of Coordination number, local stress, and sliding fraction with the shear process, the internal mechanism of shear failure can be more deeply understood from the microscopic perspective. For example, the contact between particles, the stress inside the particle cluster, and the sliding of particles can all be clearly presented through discrete element simulation. This is of great significance for studying the shear failure process of particulate matter.
Due to the relatively small number of graded samples, there may be limitations in the applicability of the relationship between curvature coefficient, non-uniformity coefficient, and internal friction angle of sand. In addition, this article did not consider the influence of confining pressure through simple direct shear tests.
The particles of sand are relatively large, and the influence of sand particle shape was not considered in the discrete element simulation modeling in this article, which may lead to inconsistency with the actual situation. For example, different particle shapes may exhibit different occlusions and rotations when subjected to shear forces.
Based on the two limitations mentioned above, the next step of work will continue in the following areas: increasing the number of samples, using triaxial shear tests instead of direct shear tests, and establishing a discrete element numerical model that can consider particle shape.
Data availability statement
The original contributions presented in the study are included in the article/supplementary material, further inquiries can be directed to the corresponding authors.
Author contributions
For research articles with several authors, a short paragraph specifying their individual contributions must be provided. The following statements should be used: “conceptualization, HG and MT; methodology, HG; software, KY; validation, CG; formal analysis, SY; resources, HG; data curation, RG; writing—Original draft preparation, HG and JF; writing—Review and editing, HG, CG, SW, and YN”. All authors contributed to the article and approved the submitted version.
Funding
This research was funded by Shaanxi Province Key R&D Program, grant number 2023-YBSF-324; Research Project of China Electronic Research Institute of Engineering Investigations and Design, grant number 2020-DKY-W02.
Acknowledgments
I express my gratitude to all those who have helped me during the writing of this paper. Especially, I gratefully acknowledge the financial support of Shaanxi Province, and the Research Project of the China Electronic Research Institute of Engineering Investigations and Design.
Conflict of interest
The authors declare that the research was conducted in the absence of any commercial or financial relationships that could be construed as a potential conflict of interest.
Publisher’s note
All claims expressed in this article are solely those of the authors and do not necessarily represent those of their affiliated organizations, or those of the publisher, the editors and the reviewers. Any product that may be evaluated in this article, or claim that may be made by its manufacturer, is not guaranteed or endorsed by the publisher.
References
Bai, B., Long, F., Rao, D., and Xu, T. (2017). The effect of temperature on the seepage transport of suspended particles in a porous medium. Hydrol. Process. 31 (2), 382–393. doi:10.1002/hyp.11034
Bai, B., Zhou, R., Cai, G., Hu, W., and Yang, G. (2021). Coupled thermo-hydro-mechanical mechanism in view of the soil particle rearrangement of granular thermodynamics. Comput. Geotechnics 137 (8), 104272. doi:10.1016/j.compgeo.2021.104272
Bayat, E., and Bayat, M. (2013). Effect of grading characteristics on the undrained shear strength of sand: Review with new evidences. Arabian J. Geosciences 2013 6 6 (11), 4409–4418. doi:10.1007/s12517-012-0670-y
Belkhatir, M., Arab, A., Della, N., et al. (2012). Experimental study of undrained shear strength of silty sand: Effect of fines and gradation. Geotechnical Geol. Eng. 30 (5), 1103–1118. doi:10.1007/s10706-012-9526-1
Belkhatir, M., Arab, A., and Schanz, T. (2011). Laboratory study on the liquefaction resistance of sand-silt mixtures: Effect of grading characteristics. Granul. Mater 13 (5), 599–609. doi:10.1007/s10035-011-0269-0
Havaee, S., Mosaddeghi, M. R., and Ayoubi, S. (2015). In situ surface shear strength as affected by soil characteristics and land use in calcareous soils of central Iran. Geoderma 237-238, 137–148. doi:10.1016/j.geoderma.2014.08.016
Ibrahim, A., and Meguid, M. A. (2023). CFD-DEM simulation of sand erosion into defective gravity pipes under constant groundwater table. Tunn. Undergr. space Technol. 131, 1–17. doi:10.1016/j.tust.2022.104823
Jiang, M., Konrad, J. M., and Leroueil, S. (2003). An efficient technique for generating homogeneous specimens for DEM studies. Comput. Geotechnics 2003 30 30 (5), 579–597.
Kamalzadeh, A., and Pender, M. J. (2023). Dilatancy effects on surface foundations on dry sand. Int. J. geomechanics 23 (3), 1.1–1.13. doi:10.1061/IJGNAI.GMENG-7826
Kong, L., Ji, L., and Cao, J. (2013). Deformation mesomechanism of sands with different grain gradations under different stress paths. Chin. J. Rock Mech. Eng. 11, 2334–2341. (in Chinese). doi:10.1061/IJGNAI.GMENG-7826
Li, X., Sun, J., Ren, H., Lu, T., and Ren, Y. (2022). The effect of particle size distribution and shape on the microscopic behaviors of loess via DEM. Berlin, Germany: Springer.
Li, Y. Effects of particle shape and size distribution on the shear strength behavior of composite soils. Bull. Eng. Geol. Environ., 2013, 72(3-4): 371–381.doi:10.1007/s10064-013-0482-7
Li, Y., Fang, Y., and Yang, Z. (2023). Two criteria for effective improvement depth of sand foundation under dynamic compaction using discrete element method. Comput. Part. Mech. 10 (3), 397–404. doi:10.1007/s40571-022-00506-5
Liu, F., Fu, J., Wang, J., Gao, Z., Li, H., and Li, J. (2022). Effect of the particle size ratio on macro- and mesoscopic shear characteristics of the geogrid-reinforced rubber and sand mixture interface. Geotext. geomembranes 50 (4), 779–793. doi:10.1016/j.geotexmem.2022.04.002
Li, Y., Fang, Y., and Yang, Z. (2015). Constitutive modeling for granular materials considering grading effect. Chin. J. Getechnical Eng. 37, 299–305. (in Chinese). doi:10.11779/CJGE201502013
Mollamahmutolu, M., and Avci, E. (2020). Effects of particle gradation, relative density and curing on the strength of silicate grouted sand. Geotechnical Geol. Eng. 38 (6). doi:10.1007/s10706-020-01463-7
Omar, T., and Sadrekarimi, A. (2014). Specimen size effects on behavior of loose sand in triaxial compression tests. Can. Geotechnical J. 52 (6), 1–15. doi:10.1139/cgj-2014-0234
Park, S. S., and Jeong, S. W. (2015). Effect of specimen size on undrained and drained shear strength of sand. Mar. Georesources Geotechnol. 28 (3), 353–358. doi:10.7843/kgs.2012.28.3.15
Tai, P., Wu, F., Chen, R., Zhu, J., Wang, X., and Zhang, M. (2023). Effect of herbaceous plants on the response of loose silty sand slope under rainfall. Bull. Eng. Geol. Environ. 82 (1), 42.1–42.10. doi:10.1007/s10064-023-03066
Sato, T., Saito, H., Tagashira, H., Hayashida, Y., Masutani, M., and Kohgo, Y. (2022). On seismic behavior of unsaturated fill dam models. Paddy Water Environ. 20 (3), 355–368. doi:10.1007/s10333-022-00897-4
Sezer, A. (2013). Simple models for the estimation of shearing resistance angle of uniform sands. Neural Comput. Appl. 22 (1), 111–123. doi:10.1007/s00521-011-0668-5
Vangla, P., and Latha, G. M. (2015). Influence of particle size on the friction and interfacial shear strength of sands of similar morphology. Int. J. Geosynth. Ground Eng. 1 (1), 1–12. doi:10.1007/s40891-014-0008-9
Wang, Z., Wang, P., Yin, Z., and Wang, R. (2022). Micromechanical investigation of the particle size effect on the shear strength of uncrushable granular materials. Acta Geotech. 17 (10), 4277–4296. doi:10.1007/s11440-022-01501-z
Xie, X., Ye, B., Zhao, T., Feng, X., and Zhang, F. (2023). DEM investigation into the effects of liquefaction history-induced anisotropy on sand behaviors. Int. J. geomechanics 23 (3), 1.1–1.18. doi:10.1061/IJGNAI.GMENG-7492
Keywords: sand, particle size distribution, shear properties, discrete element method, internal friction angle
Citation: Guo H, Wang S, Guo C, Yang K, Guo R, Fu J, Nan Y and Tao M (2023) Effect of grain size distribution on the shear properties of sand. Front. Mater. 10:1219765. doi: 10.3389/fmats.2023.1219765
Received: 09 May 2023; Accepted: 19 June 2023;
Published: 29 June 2023.
Edited by:
Bing Bai, Beijing Jiaotong University, ChinaReviewed by:
Wenyuan Ren, Northwest A&F University, ChinaYu Wang, University of Science and Technology Beijing, China
Copyright © 2023 Guo, Wang, Guo, Yang, Guo, Fu, Nan and Tao. This is an open-access article distributed under the terms of the Creative Commons Attribution License (CC BY). The use, distribution or reproduction in other forums is permitted, provided the original author(s) and the copyright owner(s) are credited and that the original publication in this journal is cited, in accordance with accepted academic practice. No use, distribution or reproduction is permitted which does not comply with these terms.
*Correspondence: Yalin Nan, bmFuLnlhbGluQGRreTUzLmNvbQ==; Mingjiang Tao, dGFvbWpAd3BpLmVkdQ==