 Sun Hongbin1†
 Yuan Jieyi
- 1Jiangsu Yangtze River Expressway Management Co., Ltd., Nanjing, China
- 2CCCC Highway Bridges National Engineering Research Centre Co., Ltd., Beijing, China
- 3Jiangsu Expressway Engineering Maintenance Technology Co., Ltd., Nanjing, China
The long-span suspension bridge has suffered from multiple failures of restraints such as supports, dampers, and expansion joints due to excessive accumulated displacement at the girder end. To investigate the main girders’ characteristics in the longitudinal motion of these bridges and the influence of the restraint device on the longitudinal displacement, the motion characteristics were first analyzed based on the measured displacement data of a certain bridge’s main girder; a dynamic finite element model of the bridge’s random traffic flow was then established based on the measured WIM data; combined with the girder end displacement monitoring data, the Euclidean distance was used to verify the correctness and rationality of the proposed model; finally, the model is used to discuss the influence of restraint devices (i.e., viscous dampers and supports) on the main girder in the longitudinal direction. The results show that dynamic loads (such as vehicles and wind) are the principal reasons for huge accumulated travel at the girder end; The viscous damper can effectively control the longitudinal movement; in a certain range, the larger the damping index, the better the control effect of the damper; meanwhile, the friction coefficient of the support also affects the longitudinal motion, but the effect is limited. When the friction coefficient is ≤ 0.03, the girder end’s cumulative displacement gradually decreases with the increasing friction coefficient, and compared to the damping index, the friction coefficient plays a major controlling role in the girder end displacement; when the friction coefficient is >0.03, the damping index plays a major controlling role in the girder end displacement.
1 Introduction
Long-span suspension bridges are usually a full-floating or semi-floating structural system, which has the advantage of greater structural flexibility and is conducive to earthquake resistance. However, the stiffened girders will undergo high-frequency and large-scale longitudinal motions under environmental excitation due to the low overall stiffness. The excessive longitudinal cumulative stroke at the girder end causes the actual service life of the auxiliary structure at the girder end to be far lower than the design service life, reducing the bridge structure’s safety and durability (Chen and Wu, 2010; Guo et al., 2018). Current research shows that, in the bridge operation stage, the traffic load causes constant reciprocal movement of the long-span suspension bridge’s main girder end, and the massive cumulative displacement will cause fatigue damage, insufficient durability, and other problems of the restraint devices such as expansion joints, dampers, and supports. In addition, the girder end displacement is also an important parameter for the design and selection of the key restraint device for the suspension bridge (Zribi et al., 2006; Huang et al., 2021). Therefore, it is of great necessity to study the longitudinal motion characteristics, influencing factors, and control methods of long-span suspension bridges’ stiffened girders under traffic loads to ensure their safe operation.
A certain highway bridge is a representative kilometer-scale long-span suspension bridge in China. In the actual operation process, the diseases like expansion joints damage, excessive wear of support slides, oil leakage from dampers, etc. have occurred many times, and the average daily cumulative displacement of the girder end is up to 100 m (before installing the longitudinal damper) (Qu et al., 2023). In order to analyze the longitudinal motion characteristics of the large-span suspension bridge’s main girder and the influence of the restraint device on the displacement, relying on the aforementioned highway bridge, this paper established and validated the dynamic finite element model of the suspension bridge based on the measured girder end longitudinal displacement data and WIM data. Based on this model, the influence of restraint device parameters on the girder end in the longitudinal motion is analyzed, which provides theoretical support for research on longitudinal motion control of stiffening girder and performance improvement of restraint device of a large-span suspension bridge. It also guides restraint device disease monitoring based on girder end displacement.
2 Characteristic analysis of the main girder's longitudinal measured displacement
In the bridge’s monitoring system, the girder end displacement in the longitudinal motion was continuously monitored using a pull-rope displacement sensor. In order to master the frequency spectrum characteristics of the main girder in the longitudinal motion, according to the Wiener-Khinchin theorem, this paper estimated the PSD (power spectrum density) for the longitudinal monitoring displacement. For displacement signals
Where:
The Welch, periodogram, BT, MTM, and Burg methods are widely used for power spectral density. Among these methods, the maximum entropy spectrum estimation based on the Burg algorithm is representative of modern spectrum estimation methods. It has high-frequency resolution and strong spectrum recognition ability. Therefore, this paper used the Burg algorithm to perform the spectrum analysis on the measured longitudinal displacement data of the bridge’s downstream girder end on 12 October 2020. The corresponding girder end displacement time history curve and power spectrum are shown in Figure 1.
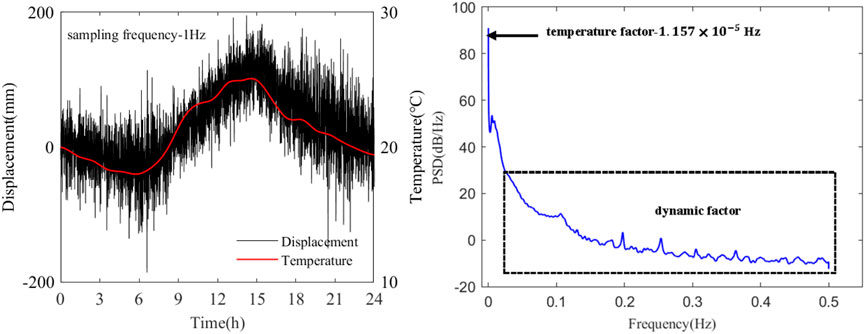
FIGURE 1. Longitudinal displacement time history curve and power spectrum of the girder end.
As shown in Figure 1, the bridge’s stiffening girder in the longitudinal motion contains many high-frequency and low-amplitude components, which can be mainly divided into two parts from the perspective of spectrum characteristics, and the corresponding frequency ranges are respectively
Therefore, in order to further discuss the longitudinal displacement characteristics of the bridge’s girder end, Empirical Wavelet Transform (EWT) is adopted to resolve the displacement time history based on spectral characteristics, and the longitudinal displacement of the stiffened girder is decomposed into two displacement components in different frequency ranges, as shown in Figure 2, and the signal decomposition truncation frequency is 0.02 Hz (Yang and Cai, 2016).
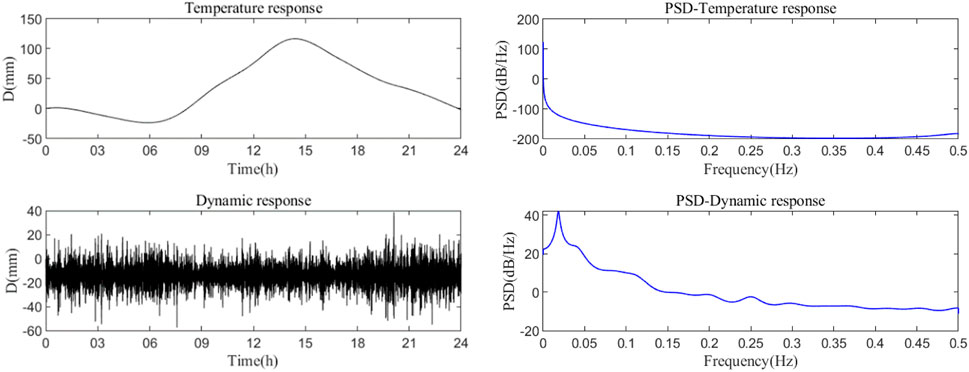
FIGURE 2. Displacement signal’s decomposition component and power spectrum.
Table 1 presents the statistical parameters of different longitudinal motion components in Figure 2, which can be seen that the statistical parameters of different longitudinal motion components at the girder end differ greatly, and the longitudinal motion amplitude and standard deviation caused by temperature are significantly greater than the longitudinal vibration response caused by dynamic factors. In addition, according to the displacement component time-history curve, the cumulative displacement caused by temperature and dynamic factors is respectively 0.4 m and 118 m, indicating that dynamic factors such as wind and vehicle load are the main factors affecting the cumulative travel of the stiffened girder end. Although the amplitude of the temperature displacement component is large, its frequency is low, resulting in a small cumulative displacement of the girder end, and it has little effect on the performance degradation of the key restraint device directly connected to the girder end. In addition, existing research has found that wind load in the wind-vehicle-bridge coupling system has little influence on the girder end displacement when the long-span suspension bridge is under normal wind, and the high-frequency and low-amplitude vibration of the girder end is mainly caused by vehicle load (Guo et al., 2015). Therefore, to further discuss the influence of the restraint device on the main girder in the longitudinal motion, the longitudinal displacement caused by thermal expansion and cold contraction of the material can be eliminated, and the simulated displacement of the girder under traffic load is taken as the analysis object.
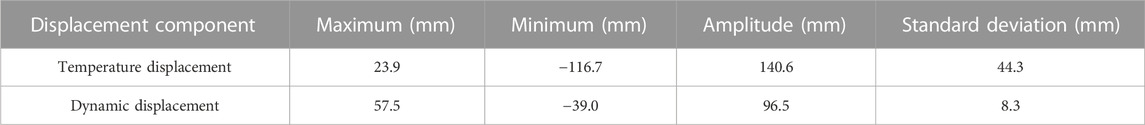
TABLE 1. The statistical parameters of longitudinal motion components.
3 The finite element simulation of the main girder’s longitudinal motion
3.1 Simulation of traffic load
The vehicle load under bridge operation is complicated and random (Liu et al., 2021), in order to reflect the vehicle load on the bridge, the random traffic flow is perceived as the traffic load in the finite element model analysis to ensure that the vehicle load can include the probable various most adverse load combination so that the analysis results are more suitable for bridge operation.
The simulation of random vehicle load should be carried out based on the measured traffic flow data of the bridge, and the probability distribution model and the statistical law of the vehicle characteristic parameters are obtained using probability theory and numerical methods to establish a random traffic flow model (Chen et al., 2018). The mass of a certain identified vehicle is unchanged when it is driving on the bridge, but the speed and location are changing with time, and its location is closely related to the vehicle type, so the construction of the random traffic flow model requires three main parameters, which are the vehicle type, vehicle speed, and vehicle weigh. The random traffic flow simulation method is as follows:
(1) Bridge vehicle types division: Based on the bridge’s WIM data in the past year, vehicles are divided according to different axle group types, and six basic vehicle types are distinguished. On this basis, wheelbases of different vehicle types are determined according to the measured wheelbase data and common wheelbase parameters, as shown in Table 2. Statistics show that the six basic vehicle types can cover all vehicles passing through the bridge.
(2) Determination of statistical models for the weight and initial velocity of different vehicle types: Analysis of the bridge’s weight data reveals that the weight of each vehicle type exhibits a multimodal distribution, and common distribution functions such as normal and lognormal distributions are unable to fit the data well. Therefore, this paper uses the Expectation-Maximization algorithm to establish a probability statistical model for the weight of vehicles based on a mixture of Gaussian distributions, as shown in Figure 3. In addition, the initial velocity is the basis for simulating the vehicle’s performance on the bridge and plays a decisive role in the travel time of vehicles on the bridge. Based on the distribution characteristics of velocity data, this paper uses the t-distribution to establish a probability statistical model for the initial velocity, as shown in Figure 4.
(3) Random vehicle load simulation: Traffic load simulation mainly simulates the generation of random vehicles and the following situation of vehicles on the bridge deck. Among them, the simulation of random vehicle generation aims to determine the size of the traffic load; the simulation of vehicle following conditions considers the mutual influence between vehicles, and the vehicle following model can be used to calculate the acceleration of vehicles at any time. By leading into the vehicle’s initial speed and arrival time, the position of the vehicle in the direction of travel on the bridge deck can be determined. Relevant studies have shown that the vehicle arrival process follows the Poisson point process of arrival rate λ, the formula for calculating the arrival rate is shown in Eq. 2; The position of vehicles in the transverse direction of the bridge is mainly selected based on the lane distribution characteristics of the vehicles. This article determines the lane selection characteristics of the bridge based on the bridge WIM data, as shown in Table 3.
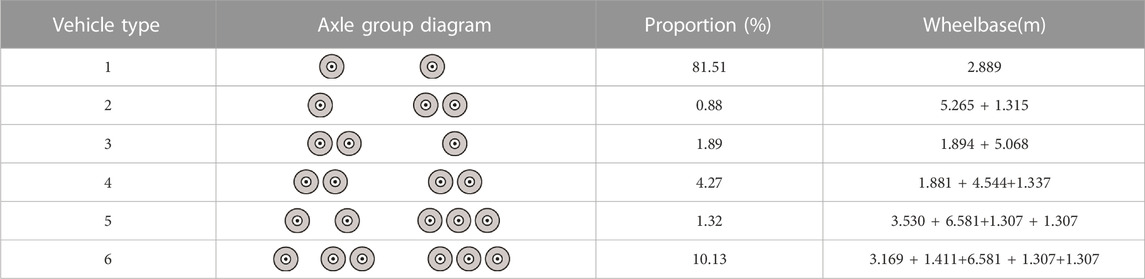
TABLE 2. Vehicle type classification.

FIGURE 3. Probability distribution model of vehicle weight.
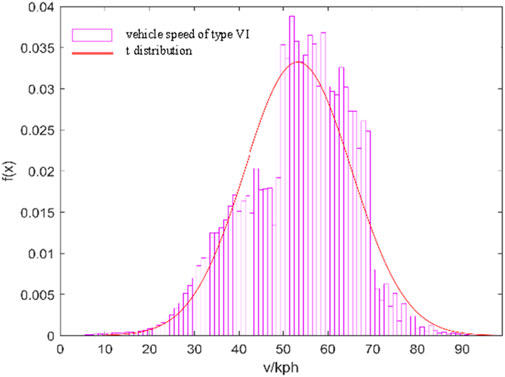
FIGURE 4. Probability distribution model of vehicle speed.
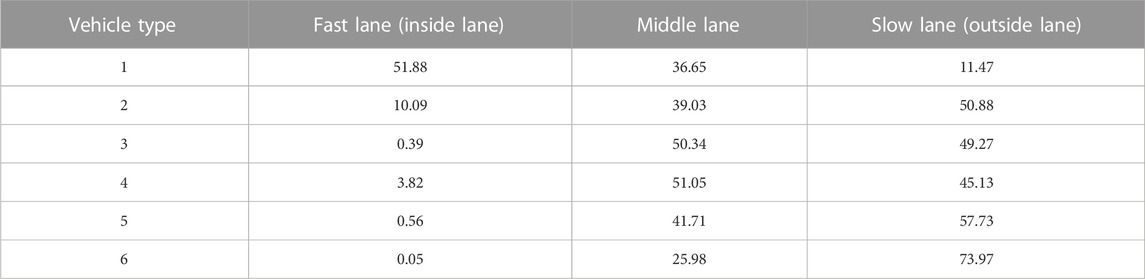
TABLE 3. Lane distribution (%).
Where:
In a word, the main process for establishing a stochastic vehicle flow dynamic model is as follows:
①Determine bridge traffic volume based on statistical data of bridge traffic flow during simulation periods; ②Based on the traffic volume and simulation duration, the number and arrival time of vehicles are generated according to the Poisson point process theory; ③Determine a statistical model for vehicle parameters based on WIM data, and use the Monte Carlo method to generate a vehicle model library containing vehicle information parameters; ④Based on the vehicle model library containing vehicle information parameters, vehicle arrival time, and initial speed, the vehicle operation program based on the vehicle following theory can calculate and obtain the load data (i.e., vehicle flow data) of each bridge node under each load step; ⑤Load the traffic flow data into the finite element model and perform transient dynamic analysis, extract the longitudinal displacement time history of the beam end for subsequent research.
3.2 Dynamic model updating and inspection
Figure 5 shows the suspension bridge’s three-dimensional finite element model established using ANSYS. The main girder was simulated using Beam188 elements, while the main cables and suspender cables were simulated using Link10 elements. The end of the main cables and the bottom of the bridge tower were all solidified, the main tower and the main cables obeyed the master-slave constraint relationship at the top position of the tower, and the main cables and suspender cables shared the same node at the cable clamp, suspender cables shared the same node with the main girder at the lifting point, the support was simulated by elastic support, and the girder end dampers were simulated by the Combin37 unit based on the kelvin model (Hu et al., 2020). The girder end displacement simulation under traffic load is carried out by loading the dynamic random traffic flow data obtained based on the above traffic load simulation method into the finite element model for transient dynamic analysis.
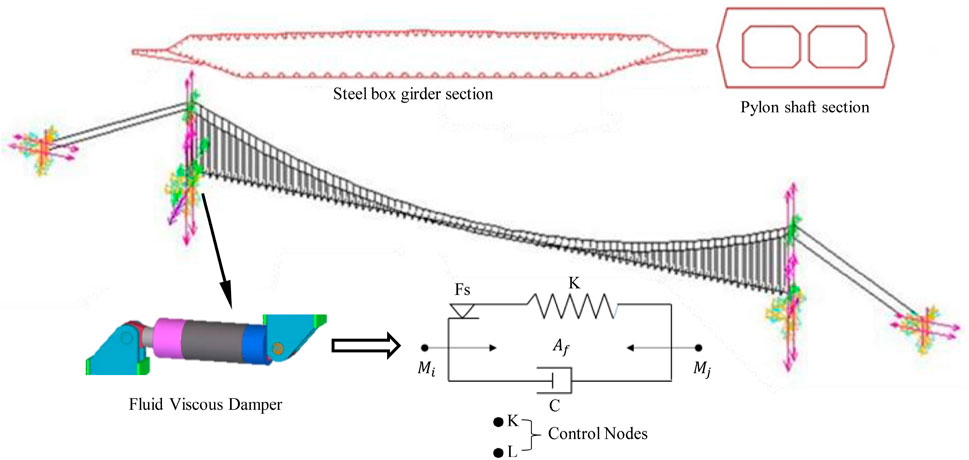
FIGURE 5. The bridge’s finite Element Model.
In addition, in order to ensure that the longitudinal simulated motion of the main girder under random traffic flow accords with the actual operating condition of the bridge, the model was updated by adjusting the girder end restraint parameters based on the mechanical performance test results of the bridge’s the restraint device.
Based on the bridge’s service support, the mechanical properties of the support are tested by changing the state of the wear plate, and the corresponding hysteresis curve is obtained as shown in Figure 6, which shows that the wear plate’s friction coefficient of the support is 0.011 under the condition of new silicone grease coverage, which satisfies the specification limit of 0.03. While the friction coefficient of support with a service life of 3.5 years is 0.057, which is much larger than the specification value, and significantly larger than that under the condition of no silicone grease or severe wear (0.028/0.047), indicating that the bridge support with a service life of 3.5 years is not in the service condition of no silicone grease or severe wear, and the significant increase of its friction coefficient mainly lies in the hydrolysis of silicone grease and foreign matter inclusions. The changing trend of the friction coefficient during the support service process is shown in Figure 7. Since the support’s service life is about 2.5 years when the dampers are installed, the friction coefficient of the model support is taken to be 0.03 as a result of the above test.
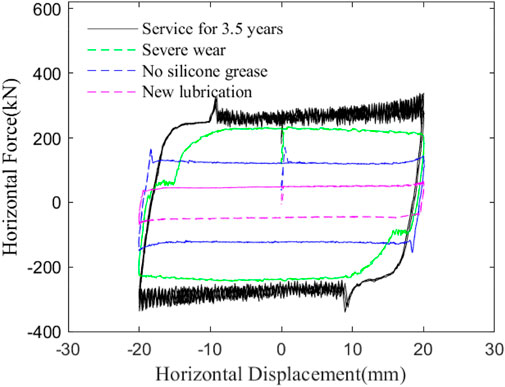
FIGURE 6. Hysteresis curve of the bridge’s service support.
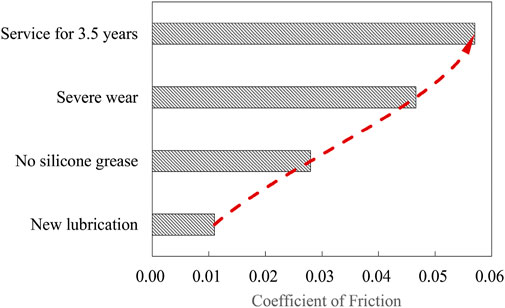
FIGURE 7. Variation of friction coefficient during the support’s service.
The bridge’s health monitoring results showed that its main girder movement velocity is less than 10 mm/s, as shown in Figure 8. The mechanical performance experiment of the bridge’s viscous damper shows that the mechanical relationship of the damper before and after service under low-speed conditions (<10 mm/s) do not satisfy its design constitutive relationship, and the damping force under low-speed conditions is smaller than the design value, as shown in Figure 9. Therefore, the damping index of the damper in the model is adjusted to 1,000

FIGURE 8. Measured girder end motion speed.
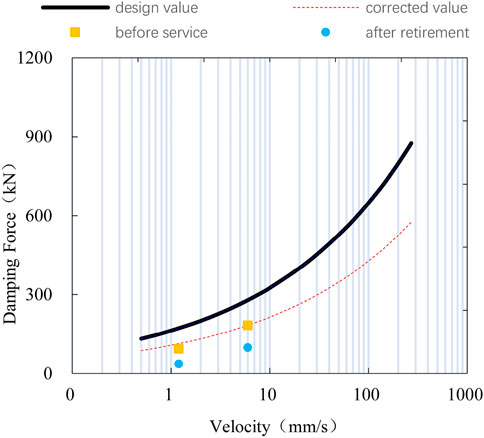
FIGURE 9. Damping force versus velocity.
To validate the accuracy of the dynamic analysis model, Figure 10 compares the time-domain curves of the girder end’s simulated longitudinal displacement and the measured high-frequency longitudinal displacement (obtained based on the EWT method). It can be seen that the two time-domain curves are relatively similar in fluctuation.
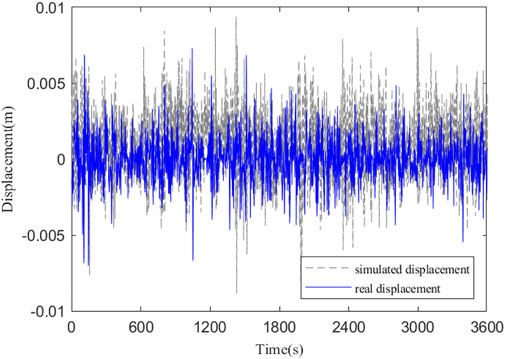
FIGURE 10. Comparison of longitudinal simulated displacement and measured displacement at girder end.
To quantitatively evaluate the similarity between the simulated displacement and the measured displacement, this paper uses the Euclidean distance as the corresponding index. The expression for calculating the Euclidean distance is as follows:
Where
4 Influence of constraint device on girder end displacement
4.1 Effect analysis of viscous damper
The significant longitudinal displacement of a long-span suspension bridge’s stiffening girder under dynamic load is characteristic of its structure itself. To control the stiffening girder end displacement response and prolong the service life of expansion joints, bearings, and other components, viscous dampers are usually installed longitudinally at the joint of the tower and girder (Zhao et al., 2020). For analyzing the influence of viscous dampers on the main girder’s longitudinal motion, based on the above finite element model under random traffic flow and the measured data of the bridge, this paper compares and analyzes the displacement of the girder end before and after installing dampers to verify the control effect of viscous dampers on the girder end’s longitudinal motion.
Figure 11 shows the finite element simulated longitudinal dynamic response of the girder end with random traffic flow before and after installing dampers. As can be seen, the amplitude of the longitudinal displacement response is reduced to a certain extent after the damper is installed, and the cumulative stroke of the girder ends in 10min before and after the damper is installed is also reduced from 0.96 m to 0.83 m, with a reduced range of 14%, indicating that the installing of the viscous damper can effectively suppress the high-frequency displacement of the girder end caused by vehicle load.
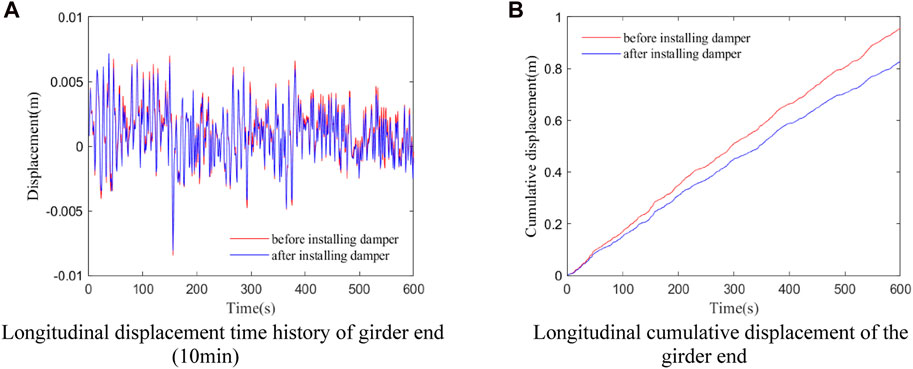
FIGURE 11. Simulated displacement of the girder end before and after damper installation. (A) Longitudinal displacement time history of girder end (10 min). (B) Longitudinal cumulative displacement of the girder end.
Comparing the longitudinal monitoring displacement power spectrum of the girder end before and after installing the damper in the bridge, it can be seen that the amplitude of the high-frequency band in the displacement power spectrum and the details amplitude of longitudinal vibration at the girder end are reduced after installing dampers, as shown in Figure 12. The change tendency is consistent with the above simulation results, further verifying the accuracy and rationality of the above dynamic model.
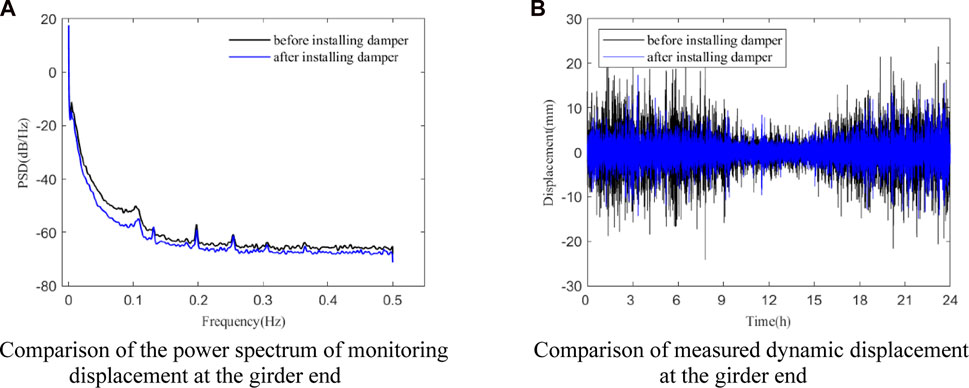
FIGURE 12. Measured displacement of the girder end before and after installing the damper. (A) Comparison of the power spectrum of monitoring displacement at the girder end. (B) Comparison of measured dynamic displacement at the girder end.
4.2 Sensitivity analysis of damper parameters
The energy dissipation principle of viscous damper mainly lies in that hydraulic oil passes through the damping hole under the action of pressure difference to generate damping force, and its expression of damping force is:
Where
At present, viscous dampers have been widely used in long-span bridges at home and abroad, but the selection of damper parameters is often determined according to subjective experience, and there is no clear unified standard. Therefore, the influence of damping indexes on the dynamic response of the girder end is further discussed based on the finite element model of random traffic flow, that is, the velocity index is 0.3, and the damping indexes were separately set to
The variation curves of the girder end’s longitudinal cumulative displacement at different damping indexes are compared, as shown in Figure 13. It is shown that the damping index is positively correlated with the control effect when the speed index is constant, that is, the greater the damping index, the better the dampers suppress the girder end in the longitudinal motion, and the cumulative longitudinal displacement of the girder end is reduced by 21% when the damping index is increased from 1,000 to 8,000
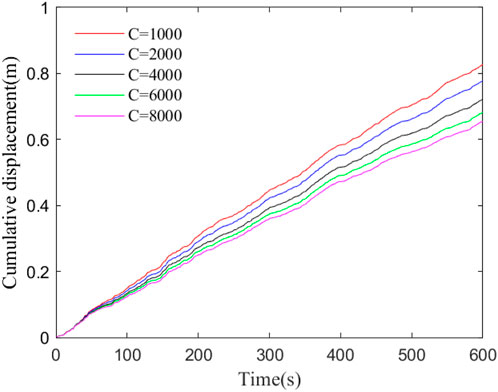
FIGURE 13. Effect of damper parameters on cumulative displacement at the girder end.
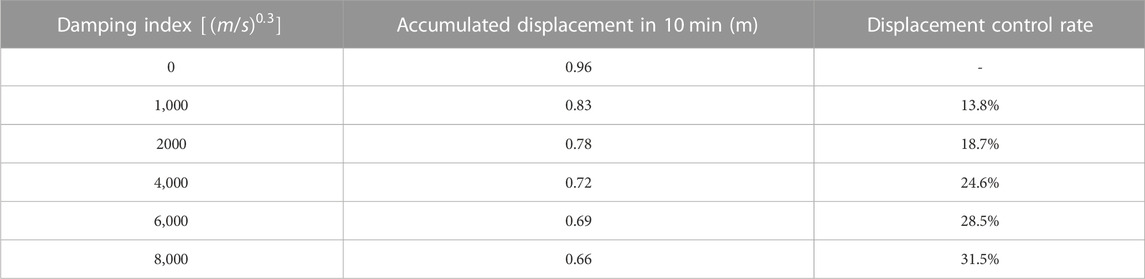
TABLE 4. Cumulative displacement of girder end under different damping indexes.
4.3 Sensitivity analysis of support parameters
The existing studies have shown that support friction also has a certain inhibitory effect on girder end displacement, and its effect cannot be ignored (Huang et al., 2021). In order to further obtain the influence of support friction resistance on the displacement of the girder end, this paper quantifies the degree of sensitivity of support parameters by comparing the cumulative displacement of the girder end under different support friction coefficients. Referring to the support test results in Figure 7, the friction coefficients of the support in the dynamic model are selected as 0.01∼0.07, and the trend of the cumulative displacement of the girder end under different friction coefficients is shown in Figure 14. It can be seen that the cumulative displacement of the girder end decreases obviously with the increase of the friction coefficient and then tends to a stable value, which indicates that the control effect of the support friction on the girder end’s longitudinal motion is limited. That is, when the friction coefficient is within the range of 0∼0.03, the increase of the friction coefficient has an obvious control effect on the main girder in the longitudinal displacement; While after the friction coefficient is greater than 0.03, the increase of the friction coefficient has little effect on the main girder in the longitudinal displacement, and the cumulative displacement of the girder end only fluctuates slightly, as shown in Table 5 In addition, it is observed that after the friction coefficient of the support is greater than 0.03, the displacement of the girder increased. The reason is that the limited friction resistance of the support is relatively large, which may cause the main girder to be in a temporary equilibrium state during longitudinal motion. However, due to the friction resistance of the support is still not enough to completely suppress the main girder in the longitudinal motion, the sudden imbalance state of the main girder will generate a shock effect to excite longitudinal vibration, causing an increase in the displacement of the girder end, The calculation results indicate that the increase is very small and its impact can be ignored. Therefore, in bridge operation, whenever the service time of the bearing increases, the friction coefficient of the support firstly increases and then decreases, which causes the cumulative displacement of the main girder to decrease significantly and then stabilize, and the actual monitoring data also prove the correctness of this conclusion, as shown in Figure 15.
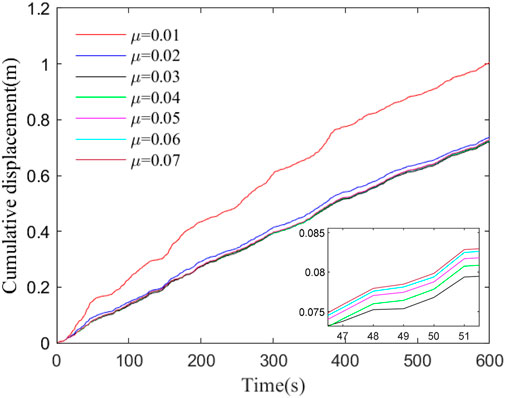
FIGURE 14. Effect of friction coefficient of support on the girder end’s cumulative displacement.
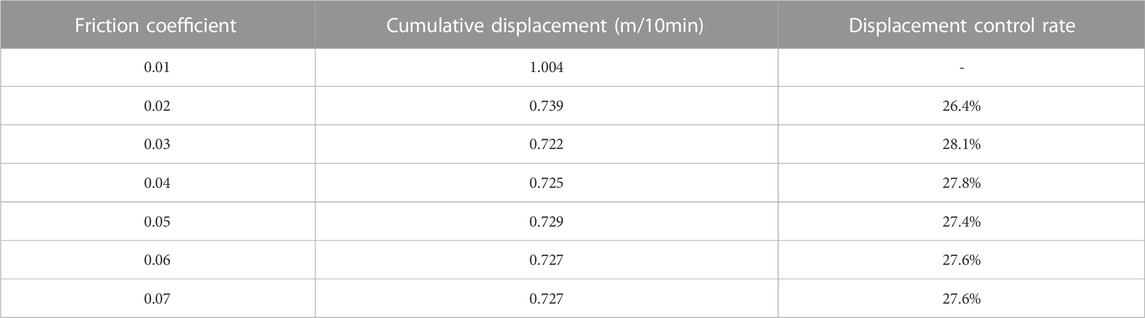
TABLE 5. Cumulative displacement of girder end under different friction coefficients.

FIGURE 15. Cumulative displacement change of girder end monitoring.
From the analysis of the control effect of the constraint device parameters, in the early stage of service of the support (friction coefficient<0.03), compared with the damping index, the increase in friction coefficient of the support has a relatively better effect on the displacement of the girder end, that is, the friction coefficient increases by four times (0.01–0.04), and the displacement control rate is 28%, while the damping coefficient increases by four times (1,000
5 Conclusion
Taking a certain highway bridge as an example, this paper establishes and tests a bridge random traffic dynamic analysis model based on the monitoring data and WIM data, and the constraint device parameters’ sensitivity analysis is also conducted based on the model. The analysis results show that:
(1) The longitudinal movement at a long-span suspension bridge’s girder end is mainly caused by temperature changes, vehicles, wind loads, etc. The frequency range of longitudinal displacement can be divided into two parts:
(2) Based on the measured WIM data of the bridge, a random traffic flow model can correctly and reasonably simulate the long-span suspension bridge’s girder end in the longitudinal motion under the action of vehicle load, and its motion characteristics are highly similar to the measured data.
(3) The viscous damper of the long-span suspension bridge can effectively control the girder end’s longitudinal movement, and the damping index is non-linearly and positively correlated with the control effect, that is, the control effect gradually stabilizes as the value of the damping index increases. Therefore, the optimal value of damping indexes should be selected according to the code and the results of dynamic response analysis when refining the design of suspension bridge girder end dampers. In this article, the optimal value of bridge damping index is recommended to be 4,000
(4) The increase of the friction coefficient of the vertical support of the suspension bridge can inhibit the girder end in the longitudinal motion to a certain extent, but with limited effect, when the friction coefficient is greater than 0.3, its change has little effect on the displacement of girder end.
(5) In terms of the friction coefficient and the damping index, in the early stage of service support (friction coefficient<0.03), the friction coefficient plays a main control role on the displacement of the girder end, while after about 2 years of service support (friction coefficient>0.03), the damping index plays a main control role on the displacement of the girder end.
Data availability statement
The raw data supporting the conclusion of this article will be made available by the authors, without undue reservation.
Author contributions
All authors listed have made a substantial, direct, and intellectual contribution to the work and approved it for publication.
Conflict of interest
Author SH is employed by Jiangsu Yangtze River Expressway Management Co., Ltd. Author YJ is employed by CCCC Highway Bridges National Engineering Research Centre Co., Ltd. Author LY is employed by Jiangsu Expressway Engineering Maintenance Technology Co., Ltd.
Publisher’s note
All claims expressed in this article are solely those of the authors and do not necessarily represent those of their affiliated organizations, or those of the publisher, the editors and the reviewers. Any product that may be evaluated in this article, or claim that may be made by its manufacturer, is not guaranteed or endorsed by the publisher.
References
Chen, B., Ye, Z., Chen, Z., and Xie, X. (2018). Bridge vehicle load model on different grades of roads in China based on weigh-in-motion (WIM) data. Measurement 122, 670–678. doi:10.1016/j.measurement.2018.03.005
Chen, S., and Wu, J. (2010). Dynamic performance simulation of long-span bridge under combined loads of stochastic traffic and wind. J. Bridge Eng. 15, 219–230. doi:10.1061/(ASCE)BE.1943-5592.0000078
Guo, T., Huang, L., Liu, J., and Zhou, Y. (2018). Damage mechanism of control springs in modular expansion joints of long-span bridges. J. Bridge Eng. 23 (7). Article ID 04018038. doi:10.1061/(ASCE)BE.1943-5592.0001255
Guo, T., Liu, J., Zhang, Y., and Pen, S. (2015). Displacement monitoring and analysis of expansion joints of long-span steel bridges with viscous dampers. J. Bridge Eng. 20 (9). Article ID 04014099. doi:10.1061/(ASCE)BE.1943-5592.0000701
Hu, J., Wang, L., Song, X., Sun, Z., Cui, J., and Huang, G. (2020). Field monitoring and response characteristics of longitudinal movements of expansion joints in long-span suspension bridges. Measurement 162, 107933. ArticleID107933. doi:10.1016/j.measurement.2020.107933
Huang, G., Hu, J., Liu, H., and Sun, X. (2021). Girder longitudinal movement and its factors of suspension bridge under vehicle load. Adv. Civ. Eng. 2021, 1–14. Article ID 1443996. doi:10.1155/2021/1443996
Liu, Y., Wang, Q., and Lu, N. (2021). Probabilistic evaluation of maximum dynamic traffic load effects on cable-supported bridges under actual heavy traffic loads. Proc. Institution Mech. Eng. Part O J. Risk Reliab. 235 (1), 108–119. doi:10.1177/1748006X20938491
Qu, F., Deng, X., Dong, J., Shan, D., and Song, Z. (2023). Field monitoring and analysis for cumulative longitudinal movements of girder ends for the medium-span suspension bridges. J. Civ. Struct. Health Monit. 13, 505–522. doi:10.1007/s13349-022-00656-3
Yang, M.-G., and Cai, C. S. (2016). Longitudinal vibration control for a suspension bridge subjected to vehicle braking forces and earthquake excitations based on magnetorheological dampers. J. Vib. Control 22 (17), 3659–3678. doi:10.1177/1077546314564781
Zhao, Y., Huang, P., Long, G., Yuan, Y., and Sun, Y. (2020). Influence of fluid viscous damper on the dynamic response of suspension bridge under random traffic load. Adv. Civ. Eng. 2020, 1–19. Article ID 1857378. doi:10.1155/2020/1857378
Keywords: long-span suspension bridge, longitudinal movement of girder end, traffic load, damper, support
Citation: Hongbin S, Jieyi Y and Yujing L (2023) Research on the longitudinal movement and influence of restraint parameters of the long-span suspension bridge’s main girder. Front. Mater. 10:1230097. doi: 10.3389/fmats.2023.1230097
Received: 28 May 2023; Accepted: 17 July 2023;
Published: 27 July 2023.
Edited by:
Chun-Xu Qu, Dalian University of Technology, ChinaReviewed by:
Yabin Liang, China Earthquake Adminstration, ChinaTao Lai, Nanjing Tech University, China
Jiaxiang Li, Northeastern University, China
Copyright © 2023 Hongbin, Jieyi and Yujing. This is an open-access article distributed under the terms of the Creative Commons Attribution License (CC BY). The use, distribution or reproduction in other forums is permitted, provided the original author(s) and the copyright owner(s) are credited and that the original publication in this journal is cited, in accordance with accepted academic practice. No use, distribution or reproduction is permitted which does not comply with these terms.
*Correspondence: Yuan Jieyi, MTgyMjQ0NTUyMzRAMTYzLmNvbQ==
†These authors have contributed equally to this work