 Chao Li
 Denghong Chen1,2
- 1School of Mining Engineering, Anhui University of Science and Technology, Huainan, China
- 2Energy Research Institute of Hefei Comprehensive National Science Center (Anhui Energy Laboratory), Hefei, China
In this paper, the authors address the issue of large solid waste output and surface subsidence in the western coal base. They focus on the 110904 filling working face of Renjiazhuang Mine and employ a combination of theoretical analysis, numerical simulation, and field practice to analyze the limit caving step and cycle pressure step of the working face. The authors propose a mining-filling coordination scheme called “three mining and one charging”. Through numerical simulation, they demonstrate that this scheme ensures the time-space continuity of the mining-filling cycle and is theoretically feasible. Additionally, the authors conduct nine groups of orthogonal simulation tests to identify the main factors affecting the filling effect. They conclude that the filling rate is the primary controlling factor, and there is a positive correlation between the filling rate and 1-day strength. The authors implement hanging pipe filling in the return air roadway of the 110904 working face, achieving a filling material 1-day strength of 2 MPa and a filling ratio of 80%. The mining-filling synergy scheme proves effective and feasible. However, the issue of pipe plugging during the filling process requires further optimization of the particle gradation in the subsequent filling material ratio scheme. Overall, the proposed mining-filling collaborative process serves as a theoretical reference for similar filling faces.
1 Introduction
In recent years, the rapid growth of the coal–electricity–chemical industry has resulted in significant economic progress. However, this growth has also led to the accumulation of large quantities of coal-based solid waste, such as gasification slag, gangue, fly ash, and slag, which pose challenges for major coal production areas. The disposal of these waste materials has caused land degradation and environmental deterioration, hindering the balanced development of coal resource extraction and environmental protection in mining areas (Zhang et al., 2021; Li et al., 2022). This situation contradicts the principles of ecological civilization, which emphasizes the harmonious coexistence between humans and nature, as well as sustainable development. Filling mining technology offers significant technical advantages in preventing and controlling rock instability, reducing solid waste emissions, and improving coal recovery rates. As a result, filling mining plays a crucial role in achieving green mining practices.
At present, many deep mines are actively exploring new paths that can not only protect the surface environment and buildings but also achieve safe and efficient mining. The “mining filling” integrated technology is an effective method to solve the aforementioned problems (Tu et al., 2021). The coordinated layout of underground coal mining and filling space in deep mining and filling integrated mines can fully leverage the technical advantages of the two types of mining processes and simultaneously meet the engineering needs of rock migration control, rock burst prevention and control, roadway surrounding rock control, water resource protection, and coal seam pressure relief and permeability enhancement (Zhang et al., 2019). At present, many domestic experts and scholars have conducted extensive research on the optimization layout of underground coal mining and filling space. For example, Zhang Qiang et al. studied the solid intelligent filling mining method in coal mines, providing the concept, characteristics, and difficulties of the solid intelligent filling mining method. Combining mining geological conditions, static size parameters of filling equipment mechanisms, and dynamic trajectory parameters during operation, a typical interference state judgment and coordination equation for the mechanism during the filling process was constructed, forming a mechanism for regulating the interference state of the filling equipment mechanism (Zhang et al., 2022); Wu Yabin et al. used numerical simulation methods to analyze the impact of overlying rock movement and surface deformation under three different mining and filling sequences in mines. The results showed that as the mining depth increased, the difference in surface deformation caused by the mining and filling sequence decreased (Wu et al., 2020). Based on theoretical analysis and practical experience, Sun Kai et al. derived formulas for calculating the key parameters of mining and filling process coordination, such as the number of separated tunnels between two alleys, the number of simultaneously filled tunnels in one group, and the number of circulating mining and filling tunnel groups. From this, they proposed a design method for coordinating and optimizing the mining and filling process of longwall tunnels by tunnel cementation filling (Sun et al., 2019); Ma Liqiang et al. proposed the “parallel mining and filling” and “continuous mining and filling” filling and water conservation coal mining methods (Ma et al., 2017). During the mining process, all the mining branches within the entire mining block are first divided into multiple mining stages. Once all the mining branches within one stage are mined and filled, the next stage of mining and filling of the mining branches is carried out until all the mining branches are mined and filled, ultimately achieving complete replacement of the filling body and coal; Lu Bin et al. proposed the short-wall gangue cementation filling technology and studied the material ratio, support tunnel parameters, evolution of surrounding rock stress field, and surface deformation laws (Lu et al., 2017); Ma Liqiang and Li Yongliang proposed the wall-type continuous mining and water filling coal mining method. First, the entire mining block was designed with a longwall system for coal transportation, material transportation, and ventilation systems. Afterward, the mining roadway (wide roadway) within the block was divided into several mining stages, during which skip mining was carried out on the mining roadway. A filling slurry underground mixing and ground mixing conveying system suitable for different coal seam dip angles was proposed, as well as corresponding working face compaction filling methods, forming a complete set of continuous mining and filling cementitious filling coal mining technology (Ma Li et al., 2019; Li et al., 2022); Wang Feifei and Ji Yu established an AHP-Fuzzy evaluation model for the safety status of mining areas and a safety analysis model of “mining area → overlying rock and surface.” They used the elastic foundation beam theory to establish a differential equation for the deflection of the roof, clarifying the relationship between the elastic foundation coefficient of the filling body and the direct elastic modulus of the top and the subsidence of the roof (Jiang et al., 2018; Ji et al., 2023). Tang Weijun, Chang Qingliang, and Sun Xiaoguang used theoretical analysis, numerical simulation, and on-site measurement methods to study the “activation” mechanism of the overlying rock, the law of roof movement, and the factors affecting the stability of the overlying rock when filling and recovering coal pillars. They also predicted the range of damage and water inrush of the bottom plate during paste filling mining, revealing the mechanical mechanism of controlling the bottom plate damage during paste filling mining. The numerical simulation software FLAC was used. We studied the surface subsidence and distribution of elastic–plastic zones on the roof and floor after mining the lower layer of coal with different filling body strengths and analyzed the rock pressure and roof stability of the working face during filling mining (Sun et al., 2007; Chang et al., 2016; Tang et al., 2017). Zhou et al. analyzed the effects of raw material mix ratio, pore size, porosity, and surface structure on the performance of the filling body by a single-factor test. The influence of the mine water environment was simulated, the immersion and dry–wet cycle tests were carried out on the field filling materials, and corrosion was carried out with different durations. Then, the influence of mine water corrosion on the mechanical properties of filling materials was studied by the uniaxial compression test. In order to improve the shear and tensile properties of the filling material, three different lengths of glass fiber were added to the filling material. It is concluded that the average peak strength of the cement-based backfill material increases with the increase in the length of the glass fiber. (Zhou et al., 2021a; Zhou et al., 2021b; Zhou et al., 2022). A green thixotropic cement filling material containing molybdenum tailings was prepared by Gao et al. A thixotropic coefficient method based on the correlation between shear stress and time was proposed to evaluate the thixotropy of the paste. The rheological properties, hydrophilicity, segregation rate, and compressive strength of the oxyphilic paste filling material were studied by the orthogonal test. (Gao et al., 2023). Chen et al. designed experiments based on the response surface method to explore the effects of gasification slag, cement, and water on the performance of paste filling materials (Chen et al., 2022). Based on the response surface method test design and data analysis, Sun Guoqing et al. simulated the roof subsidence law of the paste filling face under different filling body stiffnesses, top coal stiffnesses, support stiffnesses, and filling body strengths by using the finite difference software UDEC and analyzed the influence of single-factor and multi-factor interactions on the roof stability of the paste filling face and its reasons (Sun et al., 2016). Li et al. explored the impact of backfill mining on rock burst prevention and control and used a comprehensive research method of theoretical analysis, numerical simulation, and on-site monitoring to study the influence of controlling backfill rate on the stress of backfill working faces and the evolution of overlying rock spatial structure (Li et al., 2023). In order to reasonably and accurately determine the strength required for filling materials to fill the goaf, Han et al. proposed on-site measurement based on sensors and conducted on-site measurements in Jinchuan Mine. Formulas based on the thick plate theory were derived to verify the measurement results (Han et al., 2022). Ma et al. studied the mechanical properties of coal gangue gypsum filling materials through indoor experiments and analyzed the critical conditions for bending and fracture of the coal seam roof. The discrete element numerical simulation software was used to study the process of roof fracturing, and a reasonable filling ratio of 95% was determined to ensure the stability of the roof. At the same time, the movement of overlying strata and the law of rock pressure reduction were studied through numerical simulation and on-site measurements (Ma et al., 2022).
The abovementioned scholars have conducted a detailed analysis on the migration law, fracture characteristics, and deformation mechanism of the goaf roof in the filling working face. However, there is relatively little research on the spatiotemporal continuity of mining and filling replacement in the “mining filling coordination” operation of the working face. This article takes the 110904 working face of Renjiazhuang Mine as the background. Combined with theoretical analysis, the research methods of numerical simulation and on-site experiments have deeply analyzed the reasonable filling step distance that meets the mining and filling needs of the working face, as well as the main control factors that affect the filling effect. Good experimental results have been achieved on site, and the research results are helpful for promoting the efficient coordination and cooperation of underground coal mining and filling systems, guiding the planning and layout of underground mining and filling space, and dynamic adjustment. Realizing the integrated, safe, efficient, and green mining of “mining selection filling” in deep mines is of positive significance and can provide theoretical and technical support for the formulation of mining filling coordination plans for the same type of working face.
2 110904 working face project overview
Renjiazhuang Coal Mine employs a mixed development mode, utilizing inclined shafts and vertical shafts. The initial design of the mine divides it into five mining areas: 11, 12, 13, 21, and 23. The mining process starts with the central 11 and 21 mining areas, followed by the connection of the northern 12 mining area and the southern 13 and 23 mining areas. Finally, the mining areas in the west wing of the anticline are extracted. The mine commenced operations in 2008, with the current focus on the 11 mining area, while the 12 mining area remains the continuous mining area. As depicted in Figure 1, mining operations of the 110904 working face in the 9th coal seam of the 11 mining area are being conducted at Renjiazhuang Coal Mine. The 110904 working face is situated adjacent to the already completed 110902 working face on the left and the 110906 working face, which is scheduled for mining by the end of 2023, on the right.

FIGURE 1. 110904 working face position diagram.
The 9th coal seam of Renjiazhuang Mine is 4 m thick, mainly comprising dark coal. It is semi-dark, powdery, and occasionally lumpy and has a uniform structure and weak asphalt luster. The thickness of the coal seam is generally stable. There is a phenomenon of local thinning and thickening. The coal seam contains gangue, and the coal seam structure is more complicated. The uniaxial compressive strength of the coal seam is 1.83 MPa. After more than 0.05 m of the 9th coal seam is removed from the gangue, the average coal thickness is 3.59 m, and the overall thickness of the coal seam is stable. The 110904 working face is located in the east gate of Renjiazhuang Coal Mine Industrial Square, which is approximately 580.9 m eastward along the 120.5° direction, approximately 264.5 m east–west width, and approximately 1,452 m southward along the 207.5° direction. The ground elevation is + 1,324 m to + 1,328 m. The strike length of the working face is 1,435 m, the dip length is 265 m, and the average dip angle of the coal seam is 14°. The average thickness of the coal seam is 4.2 m, the bulk density is 1.46 t/m3, and the mining method is longwall mining. With reference to the 208 boreholes in the 110901 working face of the adjacent working face of the 110904 working face with the 11th mining area and the 9th coal seam, combined with the on-site technical data of the 110904 working face in Renjiazhuang, the comprehensive histogram of the 110904 working face rock stratum, rock stratum characteristics, and roof and floor conditions are shown in Figure 2.

FIGURE 2. Coal seam borehole histogram and lithology characteristics.
3 Mining filling step calculation analysis
Based on the theory of beam structure in the mechanics of materials, combined with the comprehensive histogram of the 110904 working face and the characteristic table of rock strata, the theoretical analysis and calculation of the limit caving step distance are carried out. The stress state of the main roof of the working face is assumed to be the fixed beam breaking model, and the stress analysis diagram of the model is shown in Figure 3.
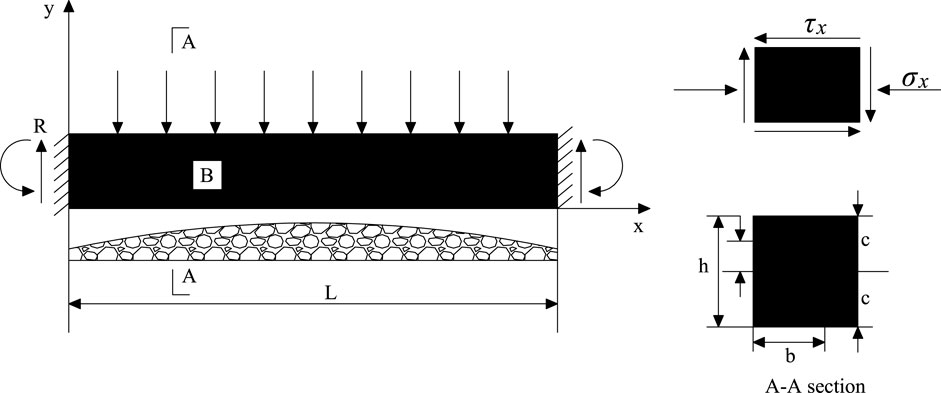
FIGURE 3. Mechanical analysis diagram of the beam model.
The normal stress of any point in the clamped beam is as follows:
In Formula 1, M represents the section bending moment in kN∙m, y represents the distance to the central axis in meters, and Jz represents the central axis section distance. The section distance of the beam is denoted as follows:
The stress at each position in the structure is as follows:
In Formula 3 and Formula 4, σ is the normal stress, MPa; h is the thickness, m; τxy is the shear stress, MPa; and Qz is the shear force, kN.
According to the mechanical characteristics of the fixed beam model, the maximum bending moment and tensile stress are as follows:
According to the model structure, when the external force reaches the tensile strength of the rock mass, the rock layer begins to break and collapse. Based on this, the following conclusions are drawn:
In Formula 7 and Formula 8, h is the layer thickness, m; RT is the tensile strength, MPa; and q is the uniform load.
It can be seen from Eq. 8 that the initial fracture step of the main roof is related to the tensile strength of the rock stratum, the thickness of the rock stratum, and the load above it. The determination of the load above the main roof is an important part of the initial breaking step. It is generally believed that the load above the overlying rock of the working face is evenly distributed in the original state (Li et al., 2022; Wang et al., 2022; Song et al., 2023). In addition, combined with the “key layer theory” proposed by academician Qian Minggao, it is believed that two discriminant conditions of the key layer are obtained from the characteristics of the key layer.
The first condition is that if the control range of the first stratum reaches the second stratum, the second stratum is the key stratum of the next stratum, which must satisfy the principle of Formula 8.
In Formula 9, (qn+1)1 is the load of the No. 1 layer of rock, kN, when the No. n + 1 layer acts on the 1 layer; (qn)1 is the load of the No. 1 layer of rock, kN, when the No. n layer acts on the 1 layer.
The second condition, according to Formula 9, to determine the hard rock layer is that the lower fracture distance must be less than the upper fracture distance.
In Formula 10, lj is the breaking distance of layer j.
According to the theory of key strata, it is assumed that n and m are two strata (n > m). If Ln > Lm > Ll, the n layer is the main key layer, and the m and l layers are the sub-key layers. If the j layer does not satisfy Formula 10, the discrimination is continued after recalculation.
According to the current classical surrounding rock control theory, the load on the rock stratum is calculated. According to the principle of composite beam, the load of overlying strata can be calculated by the following formulas:
In Formula 12, qn is the load of the nth layer. qmn is the load on the nth layer when the mth layer acts on the nth layer, where m > n. γ is the volume force, h is the thickness, and E is the elastic modulus.
Through the analysis of the characteristic parameters of the rock strata in Figure 2, the key strata of each rock stratum are distinguished. According to the detection data of the coal mine technology department and the fully mechanized mining team, the basic roof of the target working face in this paper is mudstone. The following calculation can be obtained.
The load of the first layer itself is q1 = 31.68 kPa, and the effect of the second layer of rock on the first layer is (q2)1 = 1.88 kPa, (q2)1 < q1, indicating that the second layer of rock has no effect on the first layer of rock; then, the second layer of mudstone is the first key layer. The load of the second layer (mudstone) is q2 = 205.02 kPa, the effect of the third and fourth layers on the second layer is (q3)2 = 243.4 kPa and (q4)2 = 238.0 kPa, (q4)2 < (q3)2, indicating that the fourth layer has no effect on the second layer, and the fourth layer is the second key layer. Based on the aforestated calculation, the influence of the third layer on the load of the second rock layer should be considered. The load on the main roof is 0.25 MPa. Combining it with Formula 8, the initial ultimate fracture step of the main roof of the 110904 face is calculated to be 26.32 m.
The periodic weighting step of the basic roof is often determined by the cantilever fracture of the basic roof, according to the mechanics of materials,
If the mining and filling step distance is greater than the periodic caving step distance, the filling space will have difficulty in meeting the requirements of the established filling ratio, thus affecting the space–time continuity of the mining and filling cycle. It is difficult to describe the law of roof migration after filling by theoretical calculation, and it cannot be simply considered that the periodic caving step obtained by theoretical calculation is the maximum filling step. Therefore, on the basis of theoretical calculation, it is very important to further study the law of roof migration in filling the working face and optimize the mining–filling synergistic process parameters through numerical simulation.
4 Numerical simulation mining–filling collaborative scheme
Based on the previous calculation, the reasonable mining–filling synergy step is analyzed using 3DEC numerical simulation (Cao et al., 2023). The 3DEC software includes a range of constitutive models, with the Mohr–Coulomb failure model being the most suitable for analyzing the linear failure surface of shear failure in rock mechanics. The transformation formula is as follows:
In Formula 13, σ1 is the maximum principal stress, MPa; σ3 is the minimum principal stress, MPa; φ is the angle of internal friction, °; and c is the force of cohesion, MPa.
If fs < 0, shear yielding occurs.
In order to prevent the Mohr–Coulomb model from losing its meaning, this is simplified by assuming that the yield surface is extended to the σ3 = σt region. The minimum principal stress is not greater than the tensile strength. If σ3 > σt, tensile yielding begins to occur. σt cannot exceed σ3, and the maximum value σt max is determined by the following formula:
In the Mohr–Coulomb model, the post-peak characteristics of the material must be considered, that is, the response of the material after the initial damage. This chapter uses the Mohr–Coulomb model to simulate the dilatancy effect. In addition, the elastic material in this simulation is assumed to be isotropic. Its K and G can best describe the basic characteristics of the material, so regarding these material properties, the transformation formula is as follows:
where G is the shear modulus, GPa; E is the elastic modulus, GPa; and ν is the Poisson ratio.
The 3DEC built-in joint constitutive model mainly includes two types, as detailed in Table 1. The contact Coulomb slip model is the most frequently used engineering model.
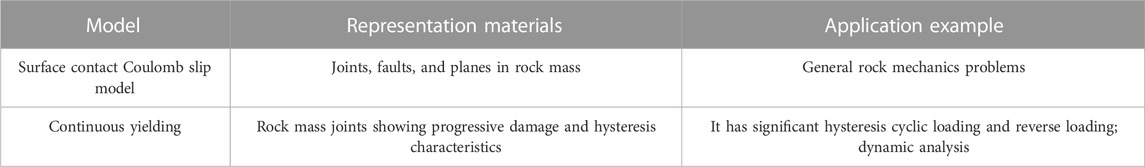
TABLE 1. 3DEC software joint constitutive model.
In summary, this paper selects the Mohr–Coulomb failure criterion as the constitutive of the numerical model, and the joint constitutive selects the surface contact Coulomb slip model.
4.1 Numerical simulation scheme and result analysis
For the simulation of the 110904 working face all caving mining, from the model along the working face to 30 m excavation, in order to explore the goaf roof caving step distance, the excavation distance was set to 10 m, 12 m, 14 m, and 16 m, and the roof subsidence was set as shown in Figure 4. It can be seen from the diagram that when the excavation is 10 m, the roof only sinks in the middle, the maximum subsidence is not more than 25 cm, and the overall structure is stable. When the excavation is 12 m, the roof subsidence exceeds 3 m, which is in a complete failure state. When the excavation is 16 m, the roof collapses completely, indicating that the final roof failure range is stable at about 10 m, which is in line with the calculation result of the periodic weighting step. Therefore, taking “three-mining and one-filling” as the filling step is in line with the actual on-site working conditions.
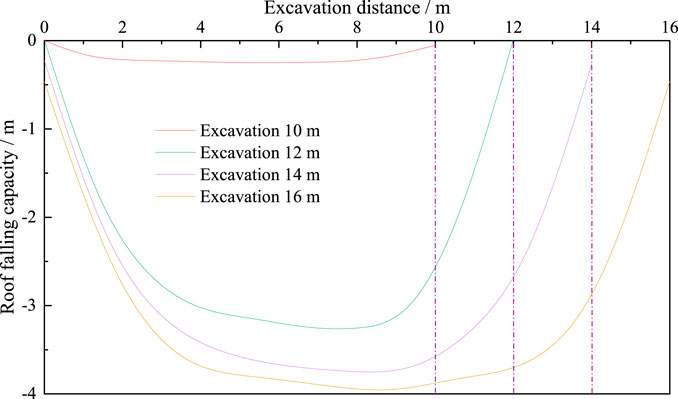
FIGURE 4. Roof subsidence at different excavation distances.
The buried depth of the coal seam, the filling ratio, and the strength of the filling body are the three important factors affecting roof subsidence in the filling mining process. The buried depth of the coal seam cannot be changed, but in engineering practice, the filling effect can be better by changing the filling ratio and the strength of the filling body. According to the operation procedure of ”three-mining and one-filling,” in order to make the filling body effectively support the roof, the filling body must be consolidated to a certain strength during the three coal mining shifts. Therefore, the age of the strength of the filling body studied is 1 day, that is, 1-day strength. It is proposed to analyze the results of roof displacement change in goaf under different filling ratios and 1d strength by numerical simulation and obtain the 1d strength and filling ratio parameters that can effectively control roof subsidence, thus obtaining the parallel optimization scheme of paste filling mining–filling in the 110904 working face. It is beneficial to the collaborative control of coal-based solid waste paste filling. The roof caving morphology and migration deformation law are simulated when the 1d strength of the filling body is in the range of 1.5 MPa, 2 MPa, and 2.5 MPa and the filling ratio is 60%, 70%, and 80%, respectively. The three levels of the two aforementioned factors are orthogonal to each other to simulate nine sets of working conditions. As shown in Figure 5, the maximum roof subsidence on the filling side (D1), the maximum roof subsidence on the unfilled side (D2), the maximum lateral deformation of the filling body (D3), and the maximum contact stress between the roof and the filling body (S1) were collected to comprehensively characterize the filling effect of the goaf. During the analysis, the slice position is located at 5 m along the coal seam.
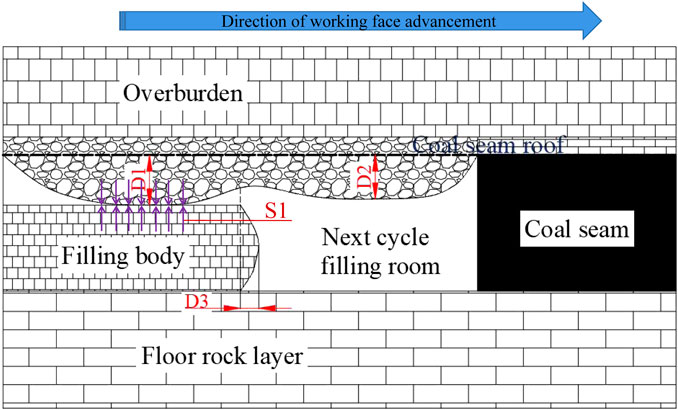
FIGURE 5. Working face mining–filling collaborative layout diagram.
As depicted in Figure 6A, both D1 and D2 decrease as the strength and filling ratio increase. The average values of D1 at a filling ratio of 60% and 80% are 2.41 m and 1.2 m, respectively, representing a decrease of 46.9%. Similarly, the average values of D2 at a filling ratio of 60% and 80% are 1.42 m and 0.66 m, respectively, with a decrease of 53.5%. It is worth noting that the decrease in D1 is slightly smaller than that of D2, suggesting that the filling body has a better control effect on the unfilled side roof compared to the filling side roof. The roof control effects of filling materials with different 1d strengths vary when the filling ratio is 60%, 70%, and 80%. However, the maximum value of D2 does not exceed 1.6 m, 1.2 m, and 0.8 m, respectively. This ensures that there is enough space for the next mining and filling cycle. Once the filling body is placed underground, it gets squeezed by the roof of the goaf. If the pressure exerted on the filling body exceeds its peak strength, the filling body will yield and deform to the side in order to release the stress. Figure 6B the average values of D3 at a filling ratio of 60% and 80% are 0.36 m and 0.15 m, respectively, representing a decrease of 58.3%. When the filling body is in contact with the roof strata, the vertical stress on the filling body increases due to the self-weight load and impact. The average values of S1 at a filling ratio of 60% and 80% are 2.82 MPa and 1.83 MPa, respectively, indicating a decrease of 35.1%.
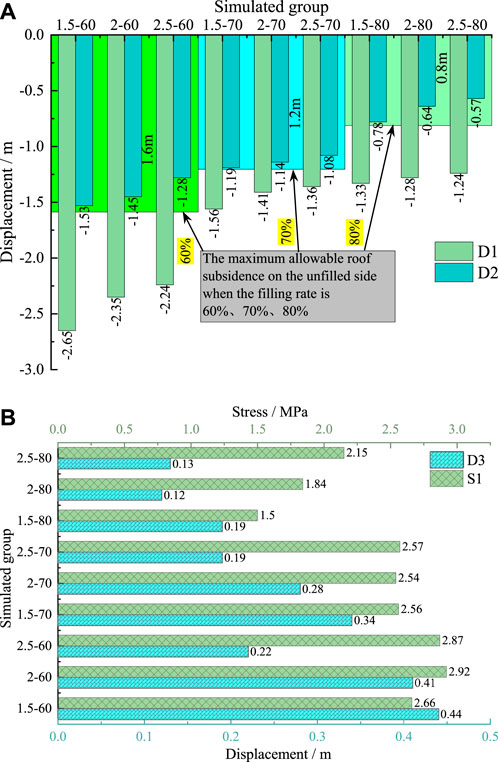
FIGURE 6. (A) Statistical results for D1 and D2. (B) Statistical results for D3 and S1.
The nonlinear surface fitting of the extracted data is shown in Figure 7. As shown in Figure 7A D1 decreases with the increase in filling ratio and filling body strength; that is, it decreases sharply and then decreases. In this process, the influence of filling ratio change on D1 is significantly stronger than that of strength change. As shown in Figure 7B D2 decreases with the increase in filling ratio and filling strength, and the change process tends to be linear. D2 is more sensitive to the change in filling ratio than the change in strength. As shown in Figure 7C D3 decreases with the increase in filling ratio and filling strength. In this process, the influence of the two factors on D3 tends to be consistent. As shown in Figure 7D S1 decreases with the increase in filling ratio and filling strength. In this process, the strength change has a weak influence on S1 when the filling ratio is at a high level. When the filling ratio is at a low level, the change of S1 is dominated by the filling ratio. In summary, the four indexes of the filling effect decrease with the decrease in filling ratio and filling strength, but the filling ratio is the main controlling factor affecting the overall filling effect.
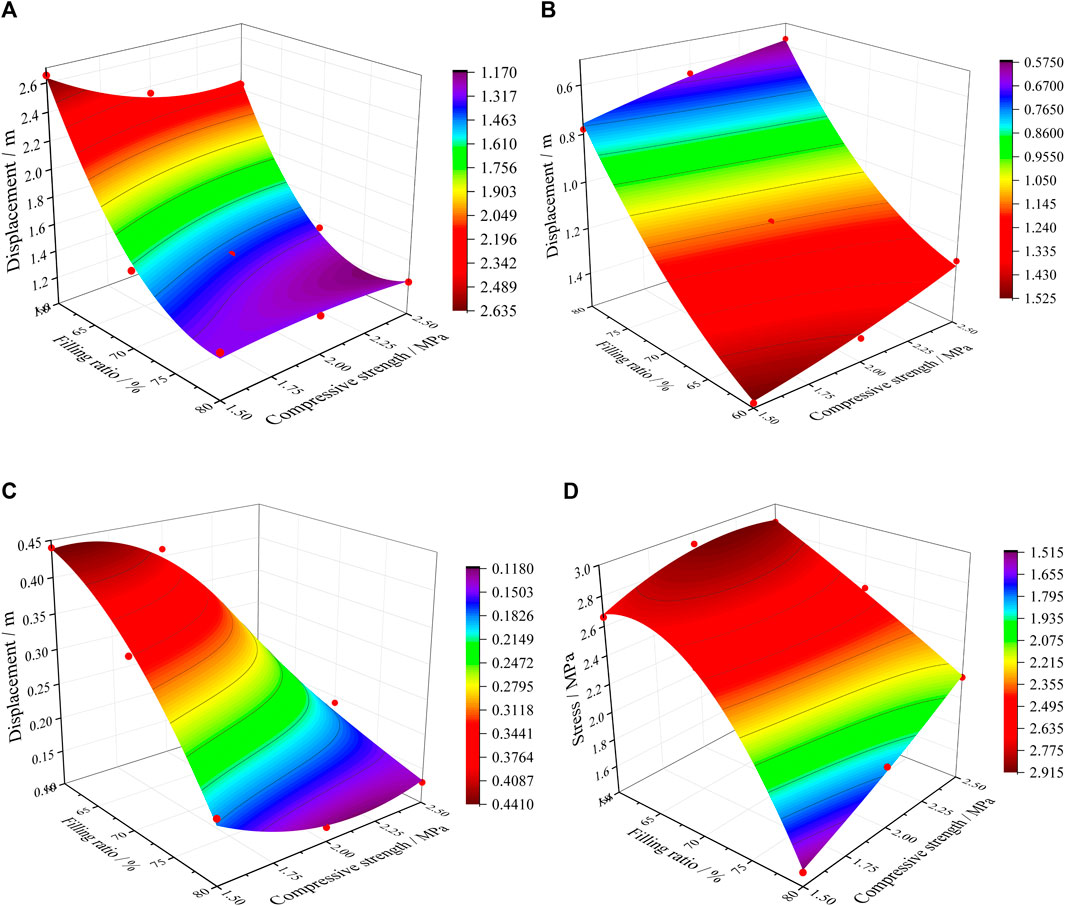
FIGURE 7. (A) The interaction of filling ratio and 1-day strength on D1. (B) The interaction of filling ratio and 1-day strength on D2. (C) The interaction of filling ratio and 1-day strength on D3. (D) The interaction of filling ratio and 1-day strength on S1.
The extremum difference analysis of the test results (Li et al., 2021; Xia et al., 2022; Cao et al., 2023) is carried out. The mean values of the four indicators at the three strength levels change with the filling ratio, as shown in Figure 8. From the kinetic energy formula
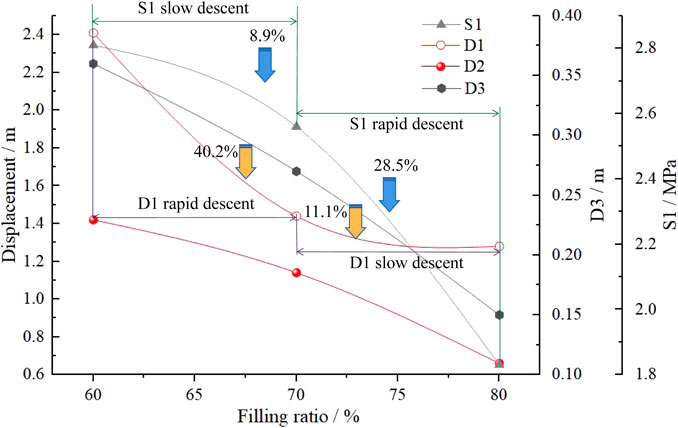
FIGURE 8. Sensitivity analysis of simulation results to filling rate change.
The mean values of the four indexes at the three filling ratio levels change with the 1d strength, as shown in Figure 9. As the strength increases, both D1 and D2 show a downward trend, D1 shows a concave curve downward trend, and D2 shows a linear downward trend. When the 1d strength of the filling body increases from 1.5 MPa to 2 MPa, D1 decreases by 9.2%, and when the 1d strength of the filling body increases from 2 MPa to 2.5 MPa, D1 decreases by 4.2%. Because the roof of the goaf is an integral rock system, the high-strength filling material not only resists the deformation of the roof on the filling side but also controls the subsidence of the roof on the unfilled side so that the subsidence is within a reasonable range and does not affect the normal operation of the next mining and filling cycle. D3 changes most significantly with the increase in 1d strength. The higher the strength of the filling body, the less prone it is to yield deformation, so the two are negatively correlated. The 1d strength increased from 1.5 MPa to 2.5 MPa, and D3 decreased by 43.8%. S1 changes little with the increase of strength. This is because the size of S1 depends on the distance between the roof and the filling body, that is, the filling ratio, so the change of the strength of the filling body will not have a great impact on S1. Based on the abovestated analysis, in order to achieve a good filling effect, it is required that the roof subsidence, the deformation of the filling body, and the contact stress between the filling body and the roof tend to the minimum value on the filling side and the unfilled side. Through the influence of different filling ratios and different filling body strengths on the filling effect, it can be seen that improving the strength and filling ratio of the filling body can achieve a better filling effect.

FIGURE 9. Sensitivity analysis of simulation results to 1-day strength change.
In this study, a comparative analysis was conducted on the numerical simulation results of the filling body strength of 2.5 MPa and filling ratio of 80% (group A) and the strength of 1.5 MPa and filling ratio of 60% (group B). Figures 10C, D illustrates the results. The model slice reveals that the maximum roof subsidence on the filling side is 2.47 m for group A and 1.41 m for group B. On the unfilled side, the maximum roof subsidence is 1.53 m for group A and 0.57 m for group B. Additionally, the lateral deformation of the filling body is 0.44 m for group A and 0.13 m for group B. As shown in Figures 10A, B, the bending and caving morphology of the roof in the goaf of group B is more pronounced compared to group A. As shown in Figures 10E, F, when comparing the horizontal and vertical displacement nephograms, it is evident that the displacement influence area caused by roof caving in group B is significantly larger than that in group A. As shown in Figures 10G, H, when comparing the longitudinal stress cloud diagram, it can be observed that the maximum contact stress between the roof and the filling body is 2.66 MPa in group A and 2.15 MPa in group B. Furthermore, the stress concentration area resulting from roof subsidence is much larger in group B compared to group A. In conclusion, group A demonstrates better control over goaf roof subsidence, which is crucial in preventing surface subsidence and creating a larger filling space to accommodate more coal-based solid waste. This finding holds practical significance.
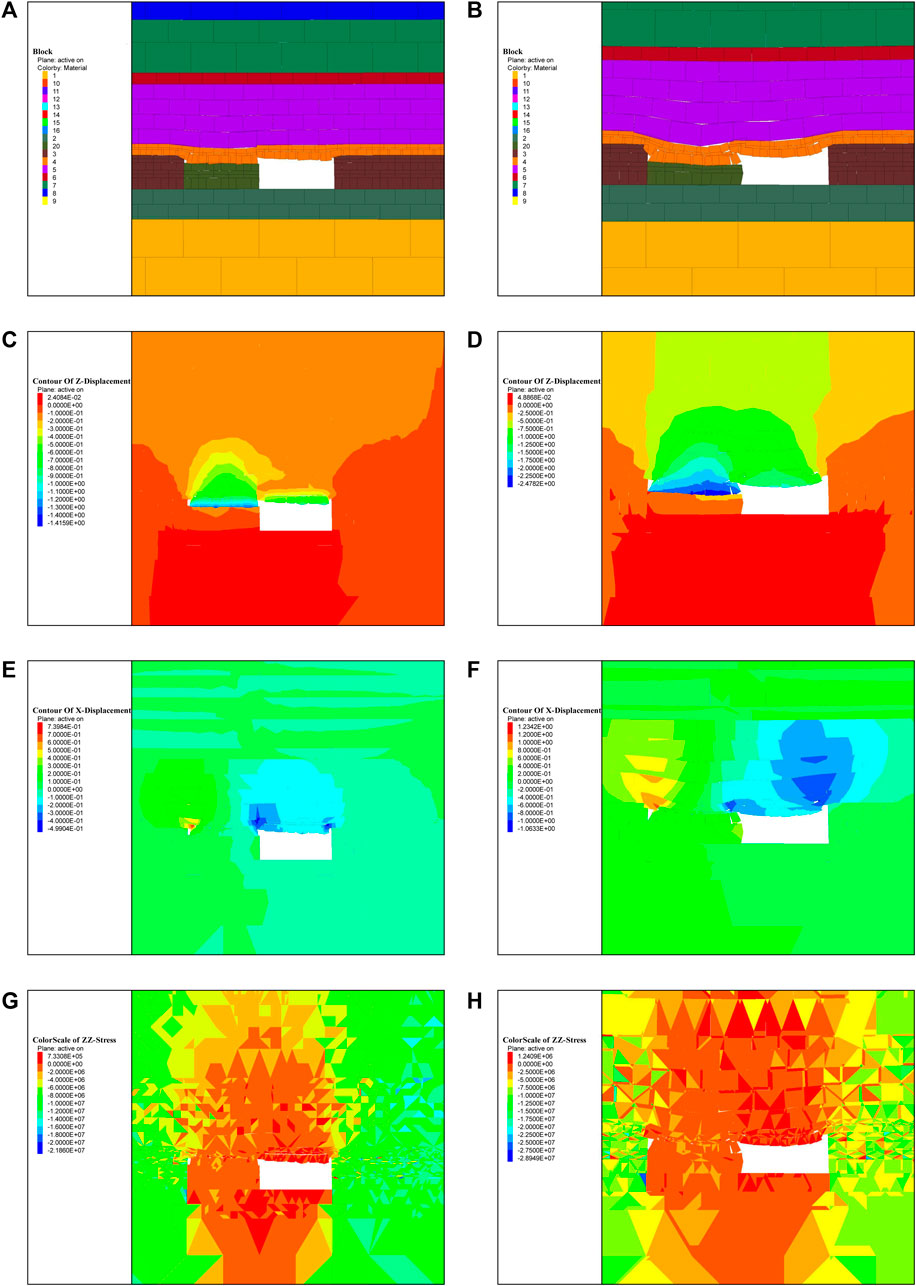
FIGURE 10. Comparative analysis of the filling effect.
5 Field engineering practice
5.1 Goaf filling scheme
Based on theoretical calculations and numerical simulation results, it has been observed that the immediate roof of the working face initially breaks on the side of the goaf and then breaks again above the solid coal. The periodic weighting step distance of 10.74 m provides ample space for the disposal of solid waste. The 110904 working face of Renjiazhuang Coal Mine is characterized by a nearly horizontal coal seam with a small dip angle. Considering the actual working conditions of Renjiazhuang Coal Mine, a mining–filling coordination scheme is proposed, which involves a filling body strength of 2.5 MPa and a filling ratio of 80%, combined with three-mining and one-filling. To prevent the filling slurry from returning to the working face and affecting the normal mining operation, a grouting wall is set up after every three mining and filling cycles in the working face. Above the grouting wall, there are installation holes for grouting pipes. The angle between the grouting pipeline and the roadway direction behind the grouting wall is designed to be 15°, taking into account the grouting pump capacity and the resistance loss along the pipeline. Figure 11 and Figure 12 show the plane and profile of the grouting wall.

FIGURE 11. Pipe grouting filling roadway layout profile.

FIGURE 12. Pipe grouting filling roadway layout plan.
According to the ratio scheme of filling material with 1d strength of 2.5 MPa, the dry material loading is prepared, which is put down to the + 1,000 m yard through the auxiliary inclined shaft, transported to the 110904 air roadway mouth by electric locomotive, and transported to the underground temporary storage bin by the 110904 tractor. The volume of the storage bin is not less than 30 m3, and the filling raw materials are transported to the filling working face. The filling material transportation system is shown in Figure 13.
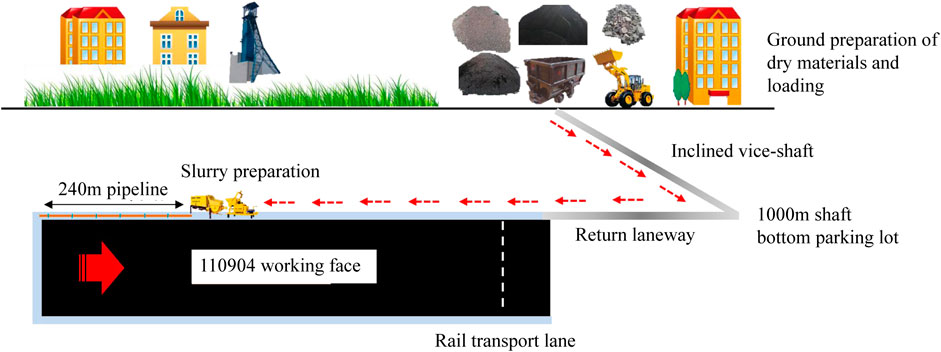
FIGURE 13. Underground transportation of filling materials.
The arrangement of the underground filling system is shown in Figure 14. In the experiment, the HBMG30/21-110 s mine filling pump of Feiyi Company was used, with a power of 110 kW, a maximum conveying pressure of 21 MPa, and a maximum conveying capacity of 30 m3/h. The mixer is HBMG3021.11, the maximum aggregate size is 40 mm, and the volume is 0.7 m3. The filling raw materials are manually loaded onto the screw feeder, and the screw feeder is transported to the mixer. The filling materials are added with water in the mixer to prepare the slurry and finally filled to the goaf through the mine concrete pump.
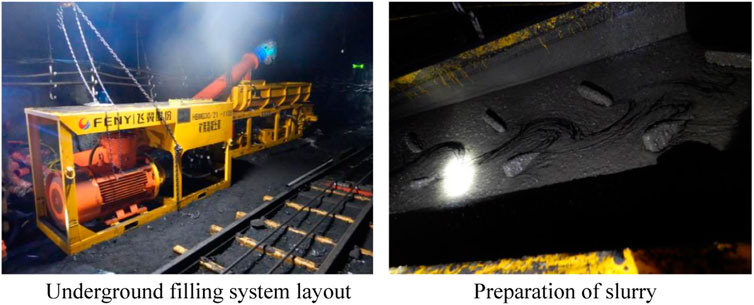
FIGURE 14. Underground filling system layout.
The layout of the underground filling pipeline system is illustrated in Figures 15A, B. The outlet of the mine concrete pump is connected to the φ125 filling special seamless elbow pipe, while the remaining sections are connected to the φ125 filling special seamless straight pipe. The total length of the underground φ125 filling pipeline is 174 m, and the total length of the φ108 seamless steel pipe is 54 m. The two filling pipelines are connected using a self-made variable diameter. To ensure complete filling of the slurry, the outlet of the filling pipeline is positioned 3 m behind the goaf.
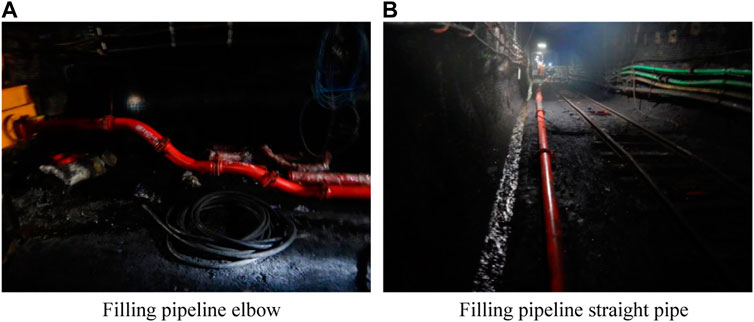
FIGURE 15. Underground filling pipeline system.
Before grouting filling, the grouting pressure is first adjusted to 6 MPa, and after the pressure is stabilized, the water is pumped for 15 min to moisten the pipe. Then, the cement slurry is pumped for 10 min to seal, and finally, the grouting material is stirred and pumped.
5.2 Experimental effect of goaf filling
In the return airway of the 110904 working face of Renjiazhuang Coal Mine, a two-cycle roadway hanging pipe filling test was carried out, and a good filling effect was achieved in combination with the three-mining and one-filling mining and filling coordination scheme. With the advancement of the working face, the roof subsidence of the roadway behind the goaf was controlled, and the filling space required for the next mining and filling cycle of 80% filling ratio was also guaranteed, absorbing the expected target solid waste. The three-mining and one-filling scheme combined with the hanging pipe filling method can be widely used in the working face.
As depicted in Figures 16A, B, hanging pipe filling is a filling method where the filling pipeline is suspended on the side guard plate of the support, and the pipeline outlet extends into the goaf. The total amount of solid waste disposed by the two-cycle hanging pipe filling method is 67 m3, with each cycle taking approximately 1.5 h. The shorter filling time helps minimize the disruption caused by the filling work on the normal mining of the working face, while also allowing for sufficient consolidation time for the filling material. In the initial stage of the first cycle of pumping slurry, the underground pumping time-varying diameter pipeline gets blocked due to the mixing of block coal gangue with dry material. However, during the second circulation grouting, the slurry is transported smoothly in the pipeline, gradually filling the space behind the support. Just before the filling process is completed, it is observed that the hose at the end of the pipeline is blocked, and upon cleaning the blocked pipeline, a significant amount of gangue is found.
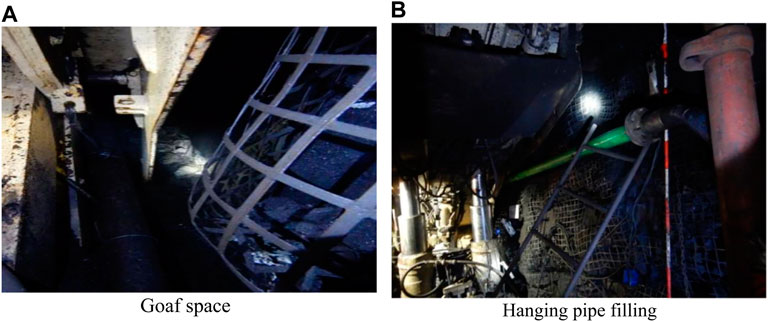
FIGURE 16. Managed filling of the underground roadway.
The ratio of slurry is a crucial factor that determines the filling effect. The change in the stress state of the filling body under load is closely linked to the rearrangement of particles in coal-based solid waste and the transformation between different material phases. The deposition coefficient of the filling slurry increases as the temperature rises during transportation in the pipeline, especially at high flow velocities, and eventually stabilizes (Bai et al., 2017; Bai et al., 2021). To ensure the strength of the filling material, it is important to adjust the ratio scheme during the later stage of preparing the filling material. Additionally, it is necessary to consider the impact of particle gradation on fluidity and the chemical reaction between raw materials on the performance of the filling material. By focusing on these factors, it is possible to prepare a filling material that has both high strength and good fluidity. This will effectively address the issue of filling and plugging on site and enhance the overall quality of the filling operation.
6 Conclusion
Based on the field engineering background of the 110904 working face in Renjiazhuang Mine, this paper aims to determine the limit caving step distance and periodic caving step distance of the goaf roof in the working face through theoretical analysis and calculation. Additionally, the influence of the filling ratio and 1d strength of the filling body on the filling effect is analyzed using numerical simulation. Furthermore, a hanging pipe filling test was conducted in the 110904 working face, leading to the following conclusions:
1) The key strata in the goaf roof are the second and fourth layers. The main roof has a limit caving step distance of 26.32 m and a periodic caving step distance of 10.74 m. The mining–filling coordination scheme is initially defined as “three-mining and one-filling,” which satisfies the engineering technical requirements. The increase in filling ratio and 1d strength of the filling body can result in roof subsidence on the filling side, roof subsidence on the unfilled side, lateral deformation of the filling body, and contact stress between the roof and filling body, all showing a downward trend. The filling ratio is positively correlated with the 1d strength of the filling body and the overall filling effect. The impact of changing the filling ratio on the filling effect is greater than that of changing the 1d strength of the filling body. The best filling effect is achieved when the filling ratio is 80% and the early compressive strength of the filling body is 2.5 MPa.
2) The mining and filling distance of three-mining and one-filling can ensure that each mining and filling cycle has enough space to meet the filling ratio.
3) The roadway’s hanging pipe filling effect is excellent, and the roof subsidence of the goaf is effectively controlled after filling. The filling space in the goaf can meet the expected consumption of solid waste. It is important to ensure that there are no large blocks in the filling slurry, as this can easily cause pipe plugging. Furthermore, when determining the later filling material ratio, it is crucial to fully consider the influence of particle size distribution on fluidity.
Data availability statement
The datasets presented in this study can be found in online repositories. The names of the repository/repositories and accession number(s) can be found in the article/Supplementary material.
Author contributions
CL contributed to the conception of the study. DC and KY helped perform the analysis with constructive discussions. CL performed the data analyses and wrote the article. DC and KY performed the analysis with constructive discussions. All authors contributed to the articleand approved the submitted version.
Funding
This work was supported by the National Key Research and Development Program of China (2019YFC1904300), the Institute of Energy, Hefei Comprehensive National Science Center, under Grant No. 21kzs217, and the National Natural Science Foundation of China (Grant No. 51974008).
Conflict of interest
The authors declare that the research was conducted in the absence of any commercial or financial relationships that could be construed as a potential conflict of interest.
Publisher’s note
All claims expressed in this article are solely those of the authors and do not necessarily represent those of their affiliated organizations, or those of the publisher, the editors, and the reviewers. Any product that may be evaluated in this article, or claim that may be made by its manufacturer, is not guaranteed or endorsed by the publisher.
References
Bai, B., Long, F., Rao, D., and Xu, T. (2017). The effect of temperature on the seepage transport of suspended particles in a porous medium. Hydrol. Process. 31 (2), 382–393. doi:10.1002/hyp.11034
Bai, B., Zhou, R., Cai, G., Hu, W., and Yang, G. (2021). Coupled thermo-hydro-mechanical mechanism in view of the soil particle rearrangement of granular thermodynamics. Comput. Geotechnics 137 (8), 104272. doi:10.1016/j.compgeo.2021.104272
Cao, J., Zhu, J., and Gao, Z. (2023). Mix design and performance study of EPS lightweight concrete based on orthogonal test. Silic. Bull. 42 (04), 1270–1281. doi:10.16552/j.cnki.issn1001-1625.20230228.00
Chang, Q., Tang, W., and Li, X. (2016). Study on failure law and field measurement of paste filling fully mechanized mining floor. J. Min. Saf. Eng. 33 (01), 96–101. doi:10.13545/j.cnki.jmse.2016.01.015
Chen, D., Li, C., and Zhang, Z. (2022). Study on performance optimization of gasification slag-based paste filling material in Ningdong mining area. Coalf. Geol. Explor. 50 (12), 41–50. doi:10.12363/issn.1001-1986.22.05.0385
Cui, D., Zhu, C., Li, Q., and Wu, H. (2021). Analysis of main key strata fracture and fracture span difference based on microseismic and electromagnetic radiation coupling. J. Min. Saf. Eng. 8 (06), 1152–1157. doi:10.13545/j.cnki.jmse.2020.0275
Gao, S., Li, W., Yuan, K. J., and Rong, C. (2023). Properties and application of thixotropic cement paste b-ackfill with molybdenum tailings. J. Clean. Prod. 391, 136169. doi:10.1016/j.jclepro.2023.136169
Han, B., Ji, K., Wang, J., Wang, S., Zhang, P., and Hu, Y. (2022). Determination of the required strength of artificial roof for the underhand cut-and-fill mine using field measurements and theoretical analysis. Sustainability 15, 189. doi:10.3390/su15010189
Ji, Y., Li, H., and Song, G. (2023). Stability analysis of surrounding rock and optimization of mining and filling process in partial filling mining face. J. Henan Polytech. Univ. doi:10.16186/j.cnki.1673-9787.2022010024
Jiang, F., Zhou, H., Sheng, J., Shuai, J., Sun, D., Hu, Y., et al. (2018). Analysis and evaluation of surface deformation characteristics under full filling mining. J. Rock Mech. Eng. 37 (10), 2344–2358. doi:10.13722/j.cnki.jrme.2018.0396
Jin, F., Xu, J., Liu, Y., Ma, X., Wang, X., Wang, Y., et al. (2022). Monitoring of key strata movement and 5-stage law of rock movement-Taking Hongqinghe Coal Mine as an example. Coal J. 47 (02), 611–622. doi:10.13225/j.cnki.jccs.xr21.1888
Li, H., Ji, Y., and Song, G. (2022c). Stability analysis of end face roof based on elastic foundation beam theory. Sci. Technol. Eng. 22 (30), 13234–13241.
Li, J., Li, S., Ren, W., Liu, H., Liu, S., and Yan, K. (2023). Seismic reduction mechanism and engineering application of paste backfilling mining in deep rock burst mines. Sustainability 15, 4336. doi:10.3390/su15054336
Li, M., Zhang, J., Huang, P., Wang, J., and Wang, Y. (2022a). Study on the control factors and influencing laws of roof subsidence in deep gangue filling stope. J. Min. Saf. Eng. 39 (02), 227–238. doi:10.13545/j.cnki.jmse.2021.0066
Li, Y., Lu, B., Yang, R., Lin, H., and Xu, B. (2022b). Wang Shushuai, Liu Chenhui. Continuous mining and filling cemented filling mining technology and typical engineering cases. Coal J. 47 (03), 1055–1071. doi:10.13225/j.cnki.jccs.2021.1612
Li, Y., Ren, Y., Wang, N., Jin, X., Ou, X., Luo, J., et al. (2021). Identification of genes involved in Fe-S cluster biosynthesis of nitrogenase in Paenibacillus polymyxa WLY78. J. Coal 46 (12), 3771–3780. doi:10.3390/ijms22073771
Lu, B., Zhang, X., Li, F., Zhang, B., and Pang, Z. (2017). Short-wall gangue cemented filling mining technology and application. Coal J. 42 (S1), 7–15. doi:10.13225/j.cnki.jccs.2016.1416
Ma Li, Q., Xu, Y., Zhang, D., Lai, X., Huang, K., and Du, H. (2019). Characteristics of aquiclude and surface deformation under the condition of wall continuous mining and water-preserved coal mining. J. Min. Saf. Eng. 36 (01), 30–36. doi:10.13545/j.cnki.jmse.2019.01.005
Ma, L., Zhang, D., Wang, S., Xie, Y., and Yu, Y. (2017). Mining and filling parallel type water-preserved coal mining method. Coal J. 43 (01), 62–69. doi:10.13225/j.cnki.jccs.2017.0809
Ma, Q., Zhang, Y., Zheng, Y., Li, Z., Song, G., and Hu, L. (2022). Overlying strata movement and mine-pressure weakening law of high-efficiency longwall paste backfilling of thick coal. Sustainability 14, 15356. doi:10.3390/su142215356
Song, G., Wei, Z., Yang, S., Wang, Z., and Kong, D. (2023). An Dong. Roof fall mechanism and similar simulation test based on Timoshenko beam theory. J. Min. Saf. Eng. 40 (02), 304–312. doi:10.13545/j.cnki.jmse.2021.0680
Sun, G., N, J., Du, M., Yan, R., and Zhang, Z. (2016). Multi-factor analysis of roof subsidence of paste filling surface based on response surface method. J. Shandong Univ. Sci. a-nd Technol. Nat. Sci. Ed. 41 (05), 51–59. doi:10.16452/j.cnki.sdkjzk.2022.05.006
Sun, K., Cao, X., Wu, Z., and Song, W. (2019). Longwall roadway-by-lane cemented filling mining and filling process coordination optimization design metho. Min. Res. Dev. 39 (06), 11–16. doi:10.13827/j.cnki.kyyk.2019.06.003
Sun, X., Zhou, H., and Wang, G. (2007). Numerical simulation study on strata control of solid waste paste filling. J. Min. Saf. Eng. 2007 (01), 117–121.
Tang, W., Sun, X., Wang, H., Shi, X., Li, X., and Li, Y. (2017). Study on the stability effect of strip coal pillar overburden in paste filling mining. Coal Sci. Technol. 45 (09), 109–115. doi:10.13199/j.cnki.cst.2017.09.018
Tu, S., Hao, D., Miao, K., Liu, X., and Li, W. (2021). Collaborative mining of complex system in deep mining-dressing-filling integrated mine. J. China Univ. Min. Technol. 50 (03), 431–441. doi:10.13247/j.cnki.jcumt.001276
Wang, G., Zhu, S., Jiang, F., Zhang, X., Liu, J., Wang, X., et al. (2021). Mechanism of coal pillar-key stratum structure instability type mine earthquake in fully mechanized caving face of inclined thick coal seam. Coal J. 47 (06), 2289–2299. doi:10.13225/j.cnki.jccs.2021.1316
Wang, T., Kang, Z., Fu, Q., Shi, Z., Chen, X., Wang, Y., et al. (2022). Ferroptosis plays an important role in promoting ionizing radiation-induced intestinal injuries. Min. Saf. Environ. Prot. 49 (06), 7–13. doi:10.1016/j.bbrc.2022.01.068
Wu, Y., Zhang, Z., and Li, Z. (2020). Porous-coated metaphyseal sleeves and MBT implant for severe bone loss in revision total knee arthroplasty: A mean 2.4-year follow-up. Mine Res. Dev. 40 (07), 12–17. doi:10.1186/s42836-020-00031-x
Xia, D., Li, X., and Hu, J. (2022). Experimental study on performance optimization of pervious recycled concrete based on orthogonal test. Silic. Notif. 41 (08), 2748–2758. doi:10.16552/j.cnki.issn1001-1625.2022.08.018
Xu, L., Zhang, K., Liu, X., Chen, B., Fan, T., and Gui, S. (2023). Deformation characteristics of key strata and control effect of surface subsidence in separation grouting mining. J. Coal 48 (02), 931–942. doi:10.13225/j.cnki.jccs.XH22.169
Zhang, J., Ju, Y., Zhang, Q., Ju, F., Xiao, X., Zhang, W., et al. (2019). Low damage mining system and method for mine ecological environment. J. Min. Strata Control Eng. 1 (02), 56–68. doi:10.13532/j.jmsce.cn10-1638/td.2019.02.005
Zhang, J., Tu, S., Cao, Y., Tan, Y., Xin, H., and Pang, J. (2021). Event-triggered model predictive control of positive systems with random actuator saturation. J. China Univ. Min. Technol. 50 (03), 417–437. doi:10.1007/s11071-021-06636-4
Zhang, Q., Wang, Y., Zhang, J., Zuo, X., Yang, J., Zhang, H., et al. (2022) Research on solid intelligent filling mining method in coal mine. Coal J. 47 (07), 2546–2556. doi:10.13225/j.cnki.jccs.2021.0982
Zhang, Q., Zou, J., Wu, K., Jiao, Y., Wang, C., and Yan, X. (2023). Study on the characteristics of mine earthquake induced by the fracture of overlying key strata in deep coal mining. Rock Mech. Eng. 42 (05), 1150–1161. doi:10.13722/j.cnki.jrme.2022.0612
Zhou, N., Dong, C., Zhang, J., Meng, G., and Cheng, Q. (2021a). Influences of mine water on the properties of construction and demolition waste-based cemented paste backfill. Constr. Build. Mater. 313, 125492. doi:10.1016/j.conbuildmat.2021.125492
Zhou, N., Du, E., Zhang, J., Zhu, C., and Zhou, H. (2021b). Mechanical properties improvement of Sand-Based cemented backfill body by adding glass fibers of different lengths and ratios. Constr. Build. Mater. 280, 122408. doi:10.1016/j.conbuildmat.2021.122408
Keywords: mining–filling synergy, numerical simulation, orthogonal test, caving step distance, theoretical calculation
Citation: Li C, Chen D and Yang K (2023) Filling parameters and process optimization of mining–filling synergistic coal-based solid waste paste in Renjiazhuang mine. Front. Mater. 10:1234145. doi: 10.3389/fmats.2023.1234145
Received: 27 June 2023; Accepted: 14 July 2023;
Published: 31 July 2023.
Edited by:
Bing Bai, Beijing Jiaotong University, ChinaReviewed by:
Nan Zhou, China University of Mining and Technology, ChinaShan Gao, Harbin Institute of Technology, China
Copyright © 2023 Li, Chen and Yang. This is an open-access article distributed under the terms of the Creative Commons Attribution License (CC BY). The use, distribution or reproduction in other forums is permitted, provided the original author(s) and the copyright owner(s) are credited and that the original publication in this journal is cited, in accordance with accepted academic practice. No use, distribution or reproduction is permitted which does not comply with these terms.
*Correspondence: Ke Yang, eWtzcDIwMDNAMTYzLmNvbQ==