 Xiangwen Deng
 Zhengyu Zhu
- School of Civil and Transportation Engineering, Guangdong University of Technology, Guangzhou, China
Introduction: The soil in geogrid-reinforced structures is typically unsaturated, with the shear strength provided by both the matrix suction and the reinforced body. Traditional structural designs for saturated soils only consider the shear strength provided by the reinforced body, neglecting the part provided by matrix suction. As a result, the design for reinforced structures is biased toward conservatism.
Method: The study examined the matrix suction-provided shear strength in reinforced soils through strain-controlled triaxial and soil-water characteristic curve (SWCC) pressure plate instrumentation. The feasibility of the Schrefler and Khalili unsaturated soil shear strength formulas for predicting shear strength based on matrix suction forces was verified.
Results: The study revealed that the cohesion of saturated reinforced soil exhibits a significant decrease in contrast with unsaturated reinforced soil, with matrix suction serving as a crucial consideration for reinforced structure design.
Discussion: The experimental results confirm the suitability of applying the quasi-cohesion increment theory to reinforced clays. The Khalili formula can be utilized to predict the quasi cohesion of unsaturated reinforced soils with greater accuracy under diverse dry density conditions. The results obtained using post-shear moisture content were closer to the measured values than those using initial moisture content.
1 Introduction
Granite residual soil is widely distributed in the southeast coastal area of China and is a common filling material in this area for engineering construction, and geogrid reinforced soil technology is often used to improve the overall stability of granite residual soil slopes and embankments. Based on the theory of apparent cohesion, it is well known that the reinforced geogrid mainly improves the shear strength of the soil by increasing the cohesion of the soil (Wang et al., 2021); however, the superficial layer of the filled slope is usually in the unsaturated state, and the literature (Gao et al., 2018) points out that the apparent cohesion of unsaturated granite residual soil mainly includes two parts, matrix suction and soil cohesion itself, so ignoring the influence of matrix suction on the shear strength of reinforced granite residual soil will lead to excessively cautious designs (Chehade et al., 2020).
Researchers around the world have investigated the effects of factors such as the size and shape of the reinforcing material, particle size, and loading rate on the frictional characteristics of the interface between soil and reinforcement. They conducted these investigations using standard direct shear and pullout tests (Infante et al., 2016; Mohammadehsan and Mohammadreza, 2017; Abdi et al., 2019; Kouchaksaraei and Khalkhali, 2020; Wei-xiang et al., 2023). To investigate the stress state of reinforced soil in actual conditions, scholars both domestically and internationally have employed triaxial tests to analyze the strength and deformative properties of reinforced soil. The shear strength characteristics of reinforced soils were investigated through triaxial tests by Vidal et al. (Vidal, 1969; Lei, 2000; Zhang et al., 2023); the results of the tests revealed that the reinforcement primarily improves soil shear strength by increasing the cohesive force. Furthermore, the shear strength also varies non-linearly with an increase in the number of reinforced layers. The study by Chen et al. (Chen et al., 2014; He et al., 2019; He et al., 2021) investigated the impact of perimeter pressure, the number of reinforcement layers, and the method of reinforcement placement on the shear strength of reinforced soils using triaxial tests.
In practice, matrix suction also significantly influences the shear strength of unsaturated soils. Zhong et al. (Zhong et al., 2015) and Luo et al. (Luo and Fu, 2019) conducted triaxial testing analyses of unsaturated soil to examine the impact of matrix suction on the shear strength of unsaturated soil. The experimental results revealed that the cohesion is significantly affected by matrix suction, exhibiting a linear growth relationship. However, the effective internal friction angle is minimally influenced by matrix suction. Zhao et al. (Zhao et al., 2021) investigated the connection between soil samples’ strength properties, water retention capacities, and pore sizes during cyclic direct shear testing under both wet and dry conditions. The results indicated that the decline in water retention capacities and variation in strength parameters of soil samples were primarily due to changes in pore properties. Huang et al. (Huang et al., 2022) obtained soil-water characteristic curves (SWCCs)for typical granite residual soils in Huangpu, Guangzhou, using the filter paper test method. The results indicate that the matrix suction in strongly weathered granite residual soil zones in a higher saturation state experiences smaller changes as the saturation is increased further, and maintains higher residual matrix suction than that in fully weathered granite residual soil zones. At the same time, it is suggested by much of the literature that alterations in matrix suction also impact the strength of reinforced soils. Ghazavi et al. (Bergado et al., 1993; Mahmoud and Omid, 2021) conducted a study on the impact of moisture content on peak pullout force through pullout tests. The findings indicate that there was a substantial reduction in the peak pullout force as the moisture content escalated. Zhou (Zhou and Xu, 2013) carried out consolidated undrained triaxial tests to investigate the differences in the strength characteristics of reinforced expansive soils in their saturated and unsaturated states. The results indicate that, for the same type of reinforcement, the cohesive force of the unsaturated specimen was significantly greater than that of the saturated specimen. Zhao (Zhao and Lin, 2019) derived the analytical solution for the reinforcement length needed to sustain slope stability under a linear suction distribution using the horizontal split method. The results showed that an increase in matrix suction leads to a significant decrease in the reinforcement length. At present, scholars worldwide have proposed unsaturated soil shear strength equations based on Bishop’s unsaturated shear strength equation. For instance, Cai (Guoqing et al., 2022) investigated the impact of pore ratio on the SWCC; they also introduced a novel formula to estimate the shear strength of unsaturated soils with different pore ratios and a wide range of variations in matrix suction. (Pham, 2022) proposed a shear strength equation reflecting the non-linear effects of saturation and matrix suction on the shear strength of unsaturated soils, through considering the micromechanical equilibrium conditions of the interaction among the solid, liquid, and air phases in soil. Bai (Bai et al., 2021) established a generalized principle for effective stress that can be applied to coupled processes involving heat, water, and force in both saturated and unsaturated soils, in which the approach is rooted in particle thermodynamics.
This paper is based on the municipal engineering project of the Flavor and Fragrance Industrial Park in Youxi County, Fujian Province, China, and the shear strengths and SWCC of the typical granite residual soil from Youxi were tested by using a strain-controlled triaxial instrument and SWC-150 SWCC pressure plate meter, respectively, to study the effect of matrix suctions and reinforcements on the shear strength of granite residual soil in saturated and unsaturated states, which provided certain theoretical basis and reasonable strength parameter references for actual reinforced soil structure design and construction.
2 Experiment
2.1 Reinforced geogrid and reinforced soil samples
The soil samples for testing were taken from the municipal project in Youxi County. The granite residual soil is a sandy silt with a mixture of light red and grayish-white color, slightly wet, and in a plastic to hard plastic state. The basic physical parameters of the soil measured by the indoor geotechnical tests are shown in Table 1, the particle gradation curve is shown in Figure 1A, and the static compaction curve is shown in Figure 1B.

TABLE 1. Basic physical parameters of granite residual soil in Youxi, Fujian.
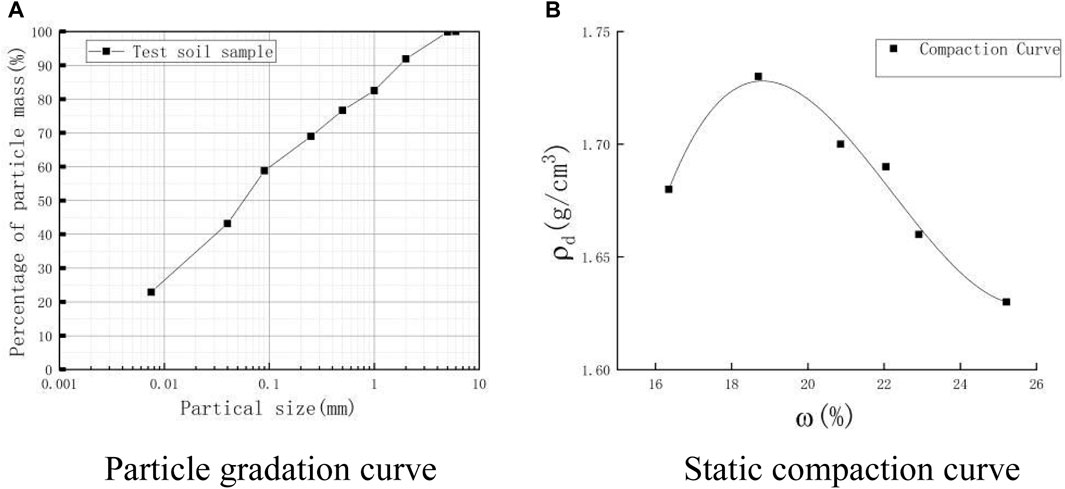
FIGURE 1. Particle gradation curve and compaction curve of soil. (A) Particle gradation curve (B) Static compaction curve.
The optimum moisture content and maximum dry density of the soil samples were measured by static compaction tests. As shown in Figure 1B, the optimum moisture content of the soil was 18.7%, and the corresponding maximum dry density was 1.73 g/cm3.
The dimensions and strength parameters of the bidirectional glass fiber geogrid used in the test are shown in Table 2, the schematic picture of the geogrid is shown in Figure 2A, and the one-layer reinforced geogrid placed in the soil sample is shown in Figure 2B.
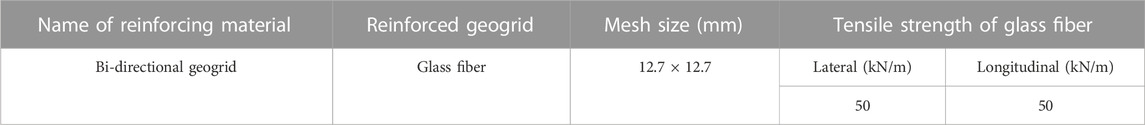
TABLE 2. Physical parameters of the geogrid.
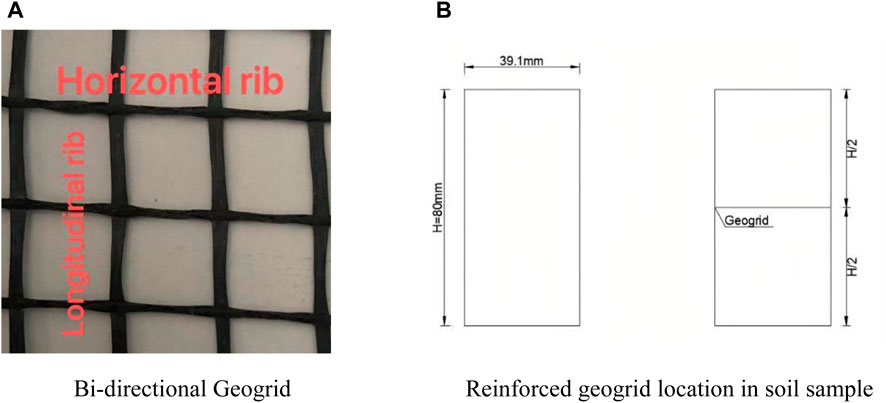
FIGURE 2. Diagrams of the geogrid and reinforced geogrid location. (A) Bi-directional geogrid (B) Reinforced geogrid location in soil sample.
2.2 Test apparatus
The conventional triaxial strain-controlled apparatus TSZ30-2.0 and volumetric pressure controller SVPC-200–3, which maintains the accuracy and stability of the pressure during the loading process, were both used together during the sample consolidation and drainage shearing process. The other accessory parts, including rubber molds, film-covering cylinders, scales, and so on, support the triaxial testing. The SWCC were measured using a SWC-150 SWCC pressure plate meter. The main instruments used in this paper are shown in Figure 3; the triaxial instrument is shown in Figure 3A and the SWCC pressure plate meter is shown in Figure 3B.
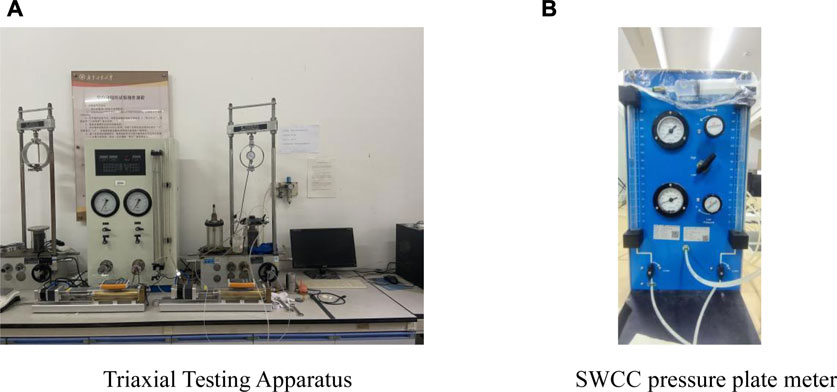
FIGURE 3. Testing instruments. (A) Triaxial testing apparatus (B) SWCC pressure plate meter.
2.3 Laboratory testing procedure
2.3.1 Triaxial consolidation and drainage shear tests
Approximately 2 kg of the residual soil was taken and then dried, crushed, and sieved through a 2 mm aperture step by step to remove the coarse particles. Finally, water was added to the remolded soil powder to reach an 18.7% moisture content and then the soil was sealed in a container for 24 h to make the moisture distribution in the soil uniform.The soil specimens with fixed dry densities and moisture content were made using the two layers static compacting soil method. After the first soil layer was compacted, the top surface of the soil layer was shaved using a scraper, and then the second layer of soil mass of the same weight was added to ensure the upper and lower layers were compacted to same compaction as far as possible. For saturated reinforced soil specimens and saturated soil specimens, the two types of specimens were saturated using the pumping saturation method; unsaturated reinforced soil specimens were kept at a moisture content of 18.7%.
The specimen dimensions for this test were d = 39.1 mm in diameter and h = 80 mm in height. The triaxial consolidation and drainage shear test methodology is outlined in Table 3, wherein the unsaturated specimen displayed a water content of 18.7%.
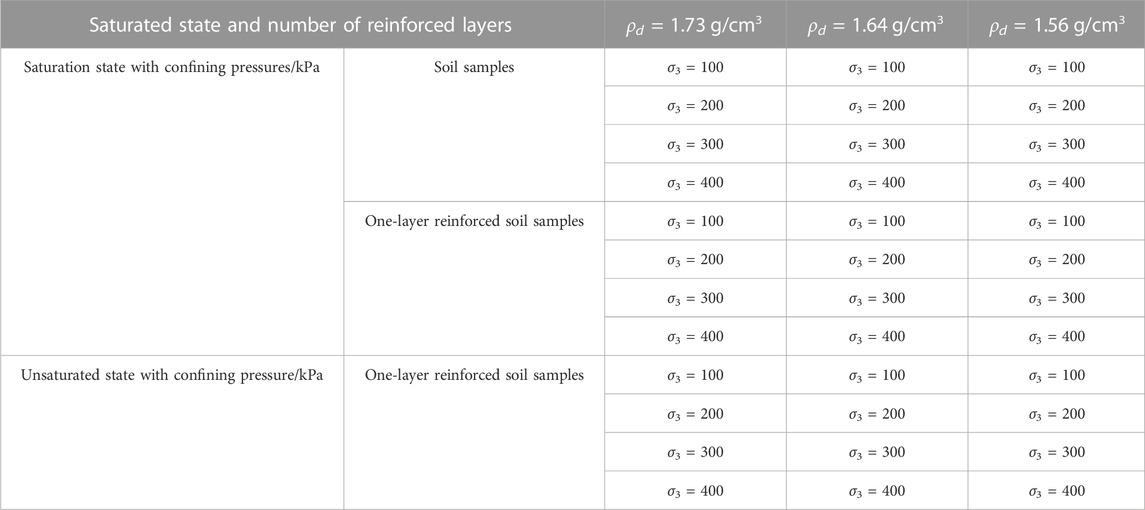
TABLE 3. Triaxial consolidation and drainage shearing test scheme.
2.3.2 SWCC pressure plate meter test
In this paper, the SWC-150 SWCC pressure plate meter was used to determine the volumetric moisture contents of the residual soil under different matrix suction levels to obtain the SWCC. The soil dry density of the test was set at 1.64 g/cm3, and the test apparatus measures matrix suction within a range of 0 to 500 kPa. The soil specimen size was d = 60 mm in diameter and h = 20 mm in thickness. The testing was divided into two stages; the saturated soil specimen was put into the device for the dehydration process firstly, and after the dehydration stage, then, water was added and absorbed until water was continued until the soil specimen became saturated again. According to the volume moisture contents and corresponding matrix suction levels obtained from the testing, SWCC could be plotted for the granite residual soil.
3 Test results
3.1 Triaxial consolidation and drainage shearing tests
3.1.1 Saturated granite residual soil tests
By rearranging the triaxial consolidation and drainage shearing test data, the stress–strain relationship curves of the saturated soil samples under different dry densities and confining pressure levels are shown in Figure 4. It can be seen that the soil stress–strain relationship curves basically show a strain hardening tendency during the shearing process in saturated states for samples with a dry density of 1.56 g/cm3, whereas there was a slight strain softening tendencyfor samples with dry densities of 1.73 g/cm3 and 1.64 g/cm3.
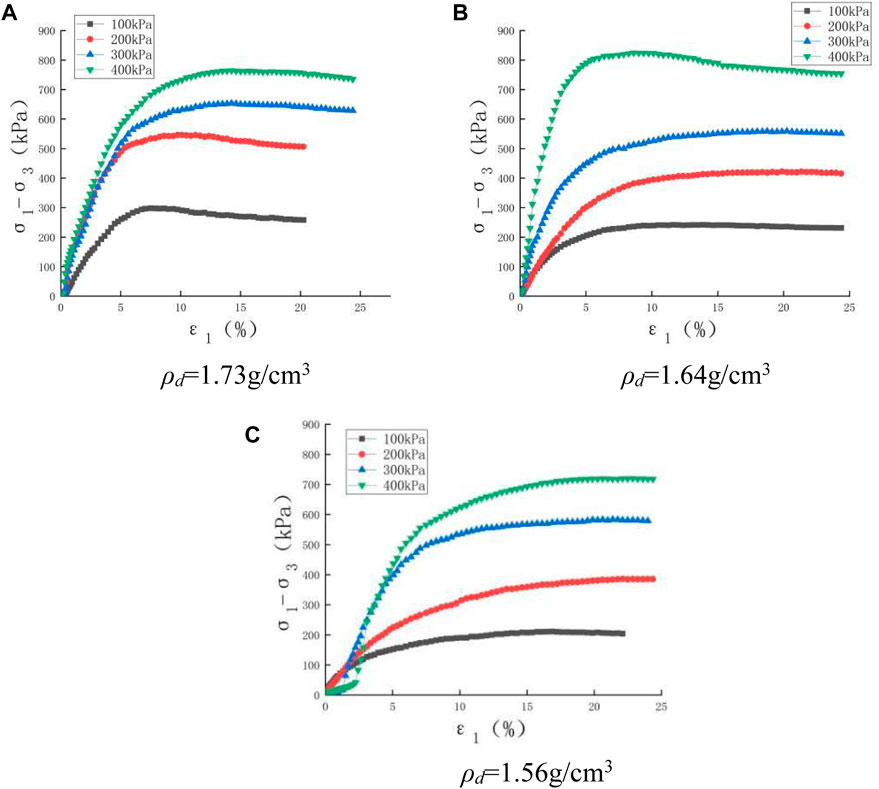
FIGURE 4. Stress–strain relationship curves of saturated soil samples with different dry densities. (A) ρd = 1.73 g/cm3 (B) ρd = 1.64 g/cm3 (C) ρd = 1.56 g/cm3.
Figure 4 shows that the peak deviatoric stresses of soil specimens decrease as the dry density decreases, in which interlock friction between soil particles is lowered for the lower dry densities when shearing.
3.1.2 Geogrid reinforced granite residual soil tests in saturated states
The stress–strain relationship curves of the one-layer geogrid reinforced soil samples in the consolidation shearing drainage tests are shown in Figure 5. These basically show the trend of strain hardening, besides seldom slight strain softening curves for soil samples with a dry density of 1.73 g/cm3 under lower confining pressure levels. The peak deviatoric stresses become larger as the confining pressure and dry density were increased individually, which indicates that the peak deviatoric stresses of the reinforced specimen gradually became larger by comparing with the testing peak deviatoric stresses of unreinforced saturated soil samples as shown in Figure 4.
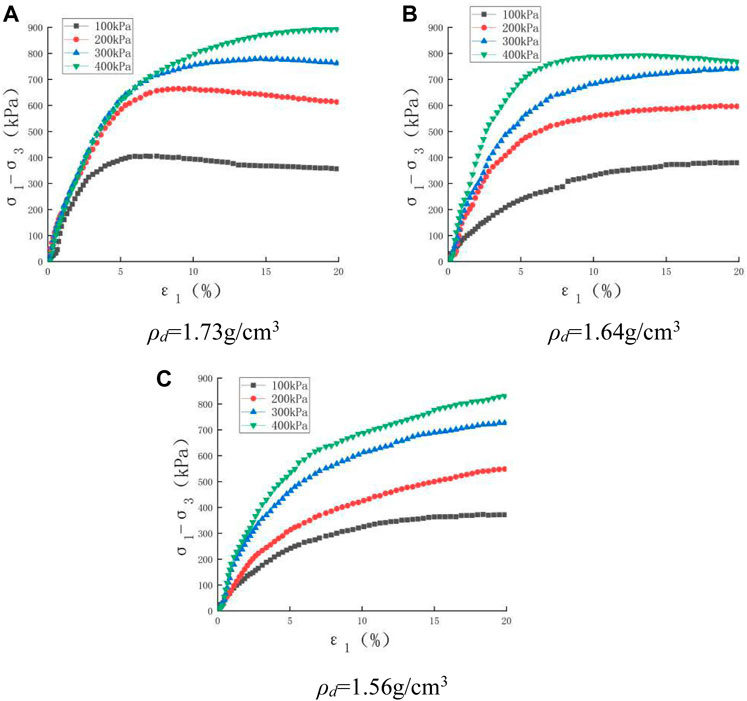
FIGURE 5. Stress–strain relationship curves of one-layer reinforced saturated samples under consolidation drainage shear tests. (A) ρd = 1.73 g/cm3 (B) ρd = 1.64 g/cm3 (C) ρd = 1.56 g/cm3.
For one-layer geogrid reinforced soil samples in saturated states and under lower confining pressure levels such as σ3 = 100 kPa, relative horizontal displacement between the geogrid and the soil was produced obviously because of the relatively smaller frictional coefficient on the geogrid–soil interface and bigger geogrid tensile strength; this induced bulking deformation at the geogrid–soil interface location, and further soil lateral deformations along soil sample height were uneven, as shown in Figure 6A. Under higher confining pressure levels such as σ3 = 400 kPa, the relative horizontal displacement between the geogrid and the soil was still bigger, but soil lateral deformations along soil sample height were relatively even because of the higher confining pressure preventing them, as shown in Figure 6C. For the intermediate confining pressure levels such as σ3 = 200 kPa, the deformation shape of the geogrid reinforced soil samples were similar to the transition between that of Figures 6A,C.
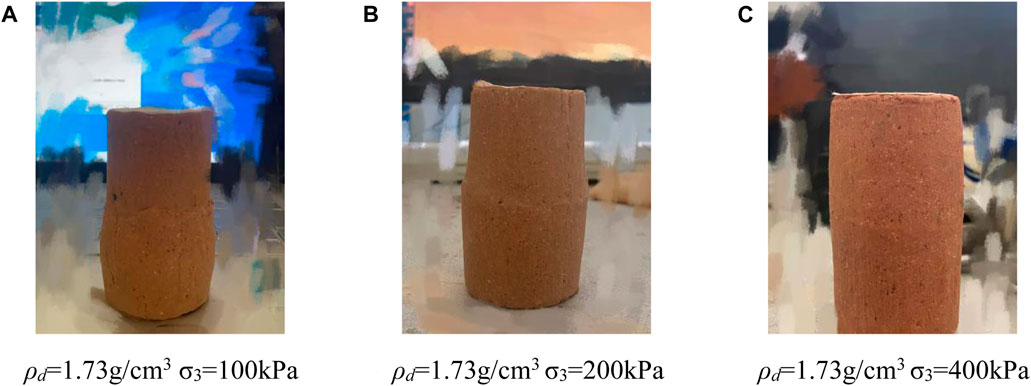
FIGURE 6. One-layer geogrid reinforced saturated sample failure status after testing. (A) ρd = 1.73 g/cm3 σ3 = 100 kPa (B) ρd = 1.73 g/cm3 σ3 = 200 kPa (C) ρd = 1.73 g/cm3 σ3 = 400 kPa.
3.1.3 Geogrid reinforced granite residual soil tests in unsaturated states
The one-layer geogrid reinforced specimens with three dry densities and the same moisture content of 18.7% in unsaturated states were tested in consolidation and drainage shear test, and the corresponding stress–strain curves obtained from these tests are shown in Figure 7.
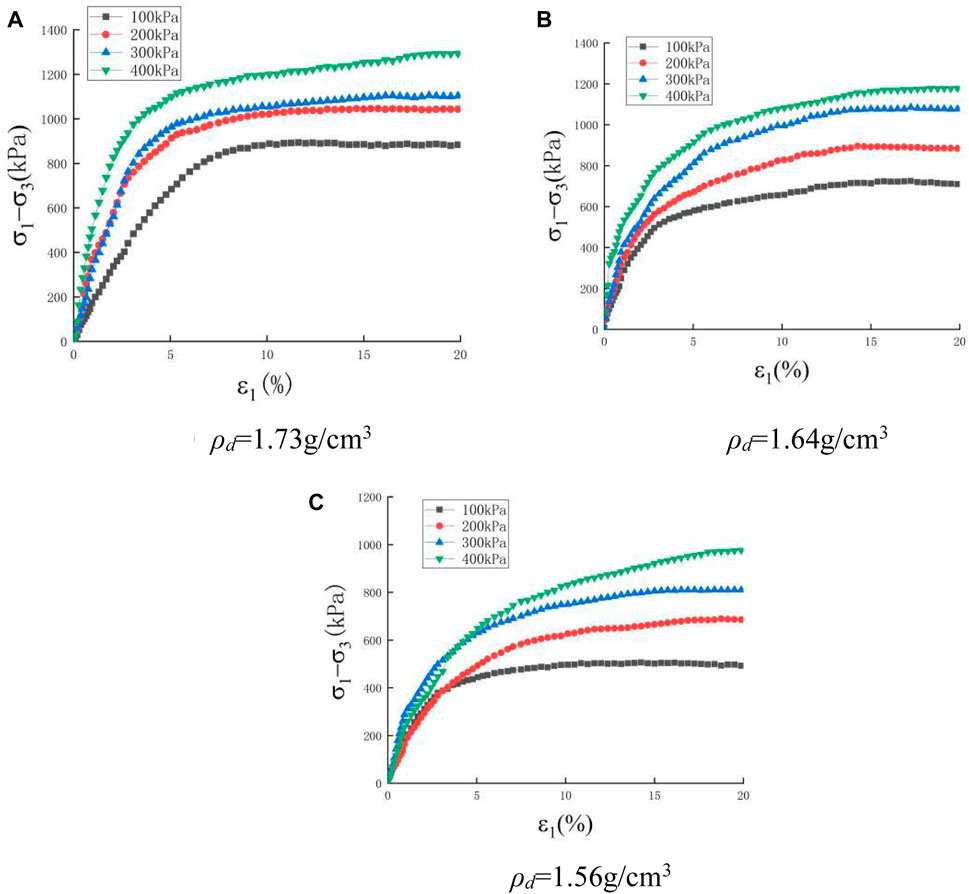
FIGURE 7. Stress–strain curves of one-layer geogrid reinforced unsaturated samples under consolidation drainage shearing tests. (A) ρd = 1.73 g/cm3 (B) ρd = 1.64 g/cm3 (C) ρd = 1.56 g/cm3.
From Figure 7, it can be seen that the soil particle pore space in the soil samples decreases when there is an increase in dry density, the peak deviatoric stresses of the geogrid reinforced soil increases; compared with the deviatoric stresses obtained from triaxial consolidation and the drainage shearing tests of saturated geogrid reinforced soil, the peak deviatoric stresses of unsaturated reinforced soil increased significantly due to the contribution of matrix suction.
3.1.4 Shear strength parameters
Based on the data from triaxial consolidation and drainage shearing tests, Table 4 summarizes the corresponding shear strength parameters.
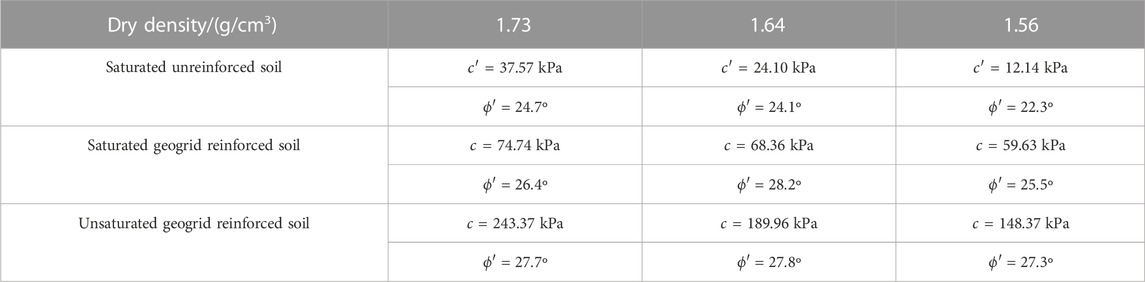
TABLE 4. Shearing strength parameters under triaxial consolidation drainage.
From Table 4, it can be seen that the cohesion of the geogrid reinforced soil has a significant increase compared with that of unreinforced soil in the saturated shearing state, whereas variation in the internal friction angle was small relatively. The test results verify the correctness of the quasi-cohesion theory stated below, which is not only applicable to reinforced sandy soil but also applicable to reinforced clay. The unsaturated geogrid reinforced soil has a significant increase in cohesion compared with that of saturated geogrid reinforced soil, which indicates that the cohesion provided by matrix suction is an important contribution that cannot be neglected totally in the design, construction, and maintenance of reinforced soil structures, and consideration of the cohesion contributed by soil matrix suctionis beneficial for reinforced soil structures in reducing the construction and maintenance expense.
3.2 SWCC test
For the remodeled soil samples with a dry density of 1.64 g/cm3, the SWCC between soil volume moisture contents and matrix suctions are plotted in Figure 8 using the pressure plate meter testing results.
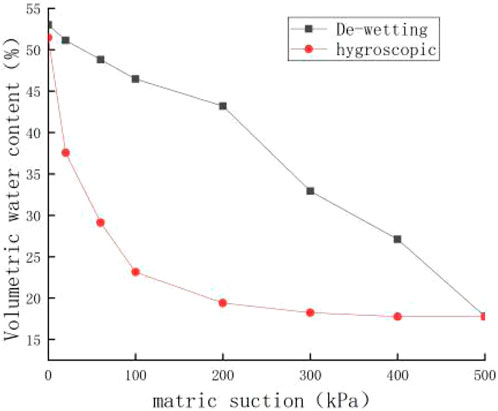
FIGURE 8. SWCC of remodeled granite residual soil.
From Figure 8, it can be seen that the SWCC in the dehydration stage differed greatly from curve in the hygroscopy stage, and there was an obvious hysteresis phenomenon between the two curves. In the process of dehydration, the volumetric moisture content gradually decreases as the matrix suction increases; whereas in the process of hygroscopy, the matrix suction gradually decreases as the volumetric moisture content in the soil increases, and the rate of change in SWCC during the hygroscopic process also transitioned from slow to fast. The appearance of the hysteresis loop reflects the unique pore size distributing pattern in the soil mass, indicating the existence of medium to large pores in dimension and uneven pore size distribution inside the soil body; the more medium to large size pores existing inside the soil body, the more water is retained in the medium to large size pores due to the bottleneck effect in the dehydration stage, which eventually leads to the increase in the hysteresis area between the dehydration curve and hygroscopy curve of the granite residual soil obtained from Youxi county.
On the other hand, the soil skeleton is deformed with the changes in volumetric moisture content in the dehydration and hygroscopy stages. In the first dehydration stage, the soil sample has a slight decrease in pore volume induced by the increase in matrix suction due to the decrease in moisture content in the soil, and resulted in a slight decrease in the saturated volumetric water content of the soil sample was observed following the wetting stage.
4 Strength characteristics of geogrid reinforced soil in unsaturated states
4.1 Unsaturated soil shearing strength formula
Among the many shear strength formulas for unsaturated soils, Bishop’s effective stress strength formula is currently the most famous. Bishop (Bishop and Blight, 1963; Xie, 2015) proposed a shear strength formula for unsaturated soils, combined with experimental studies, as expressed in Equation 1:
where
Equation 1 is further written in the form of Eq. 2:
Equation 3 can be obtained from Eq. 2 as follows:
where c is the apparent cohesion of unsaturated soil. Since the matrix suction is associated with the soil moisture content and △cs is the quasi-cohesion increment induced by the matrix suction, scholars established the parameter
Schrefler (Schrefler, 1984) proposed soil saturation replacing
Khalili et al. (Khalili and Khabbaz, 1998) introduced an air-entry suction value of unsaturated soil through extensive experimental studies and proposed the unsaturated soil shearing strength Eq. 5 as follows:
where
4.2 Quasi-cohesion increment calculation
The current research focuses on the reinforcement strengthening mechanism in reinforced soil as well as the corresponding equivalent quasi-cohesion increment calculating method. The quasi-cohesion increment calculation considers the internal friction angle of reinforced soil being basically equal to that of unreinforced soil, reinforcement simply increases the cohesion of the soil mass.
The quasi-cohesion increment calculation of reinforced soil could be explained further by using Mohr–Coulomb failure criterion as Eq. 6 expressing:
where σ1f represents the major principal stress, kPa, at the shearing failure state of the reinforced soil; σ3 represents the minor principal stress, kPa;
Comparing Eq. 6 with the limit equilibrium condition of unreinforced soil, the quasi-cohesion increment ∆cr contributed by the geogrid reinforced function in the reinforced soil can be calculated.
Through the triaxial compression tests of reinforced soil, the action of the reinforced geogrid in the soil can be regarded as an additional equivalent minor stress increment acting on the soil mass, thus the ∆cr formula (7) is proposed as follows:
where
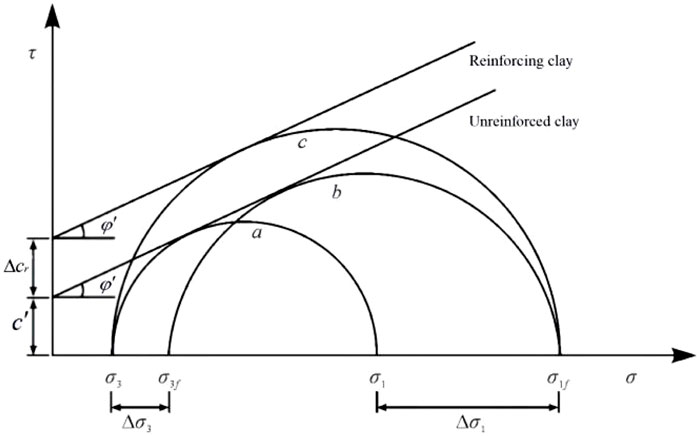
FIGURE 9. Stress analyses of reinforced and unreinforced clay samples.
Subtracting Eq. 8 from Eq. 9, then Eq. 10 is obtained:
Substituting Eq. 10 into Eq. 9, then Eq. 11 is obtained:
Substituting Eq. 11 into Eq. 7, the quasi-cohesion increment of reinforced soil can be deduced as Eq. 12:
The quasi-cohesion increments of reinforced soil are calculated from Eq. 12, and are further compared with the measuring cohesion increments, as shown in Table 5.
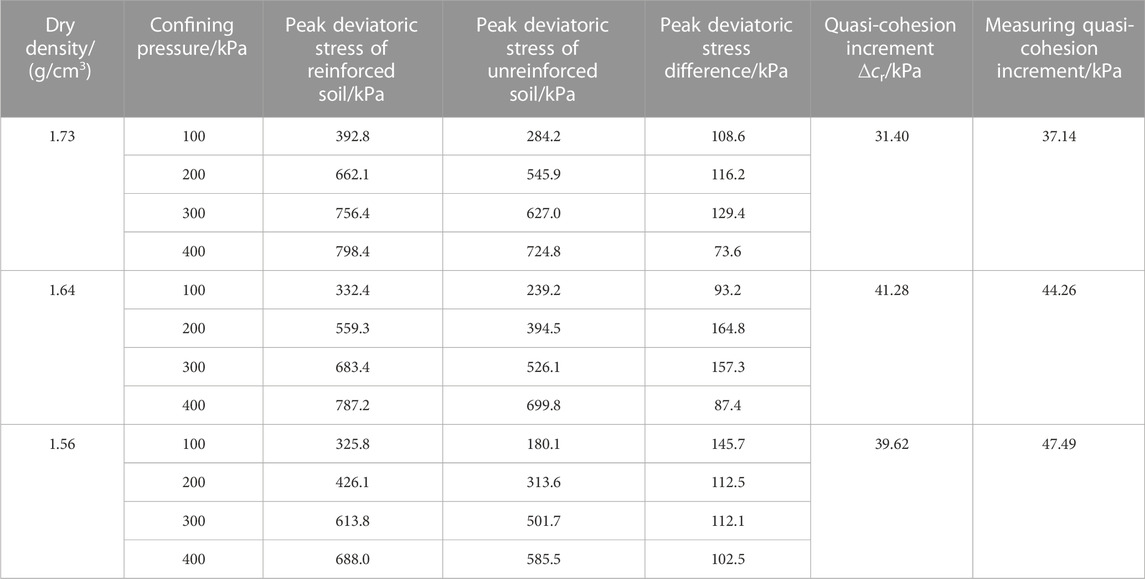
TABLE 5. Calculating and measuring increments of quasi-cohesion of saturated reinforced clay.
As shown in Table 5, the increase in quasi-cohesion increments calculated by Eq. 12 is smaller than the measured value, which is because Eq. 12 calculates the quasi-cohesion increments only by the peak stress difference and the effective cohesion and effective angle of internal friction of the unreinforced soil, and does not sufficiently consider the influence of the reinforcing material, the size of the reinforcing material, and the number of reinforcing layers, which results in the calculated value usually being smaller than the measured value. The quasi-cohesion increments calculated based on the theory of quasi-cohesion for the reinforcing body shows a slight discrepancy from the measured value obtained from testing. However, the difference is relatively small and can be utilized as the safety consideration for reinforced soil structures.
4.3 Calculation of the shearing strength of unsaturated reinforced soil
It is usually difficult to measure the volumetric moisture content of the specimen during the shearing process; thus, this limits the study of shearing strength characteristics of the unsaturated soil to some extent, because the volumetric moisture content of the specimen at shearing failure is easily measured, usually to be used to evaluate shear strength of unsaturated soil, as pointed out in the literature (Zhao, 2022). It can be also assumed approximately that the volume change of the specimen during shear is small, and the volumetric moisture content during shear is close to the initial volumetric moisture content. Based on the moisture absorbing curve in Figure 8, the shearing strengths of unsaturated reinforced soil are calculated in this section using the shearing failure volumetric water content and initial volumetric water content separately, and the calculating shear strengths using the two volumetric water contents are compared and commented upon further.
The volume moisture contents of unsaturated reinforced granite residual soil on shearing failure for the triaxial CD tests were measured, and corresponding matrix suctions are shown in Table 6. As can be seen from Table 6, there is a slight increase in the moisture content of the specimens after shearing compared with the initial moisture content of 18.7%.
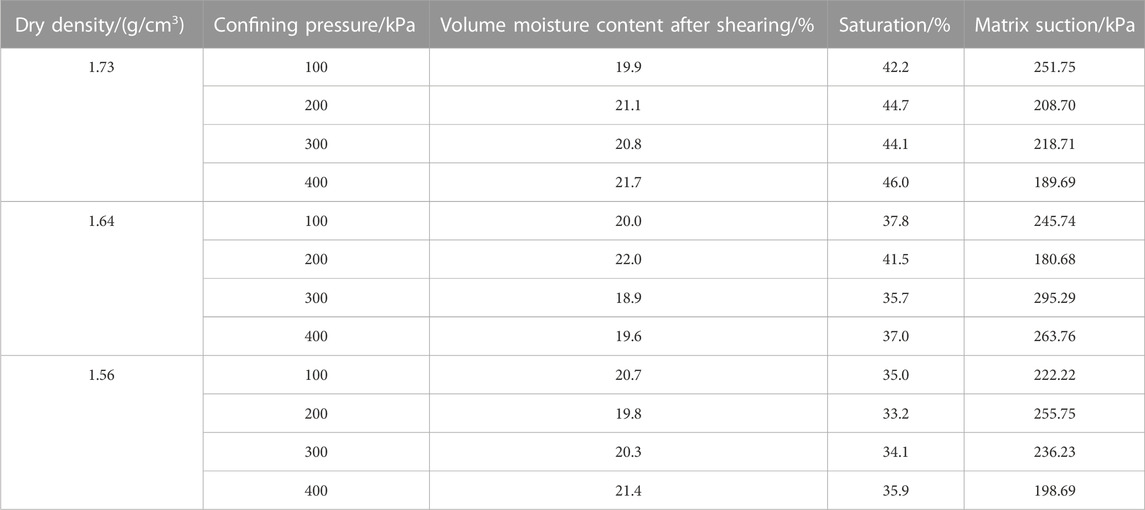
TABLE 6. Water contents of specimens after shearing and the corresponding matrix suctions.
1) Schrefler’s formula for shear strength of unsaturated reinforced soil
The saturation in Table 6 can be substituted into Eq. 3 to calculate the quasi-cohesion increment of unsaturated reinforced granite residual soil, and the calculated results are summarized in Figure 10. The calculated results have obvious differences with the experimental measured values, which are due to the fact that the shear strength formula proposed by Schrefler only considers the linear effect of saturation on shear strength, thus Schrefler’s formula cannot better reflect the effect of matrix suction on the shearing strength of unsaturated soil correctly.
2) Khalili unsaturated soil shear strength formula
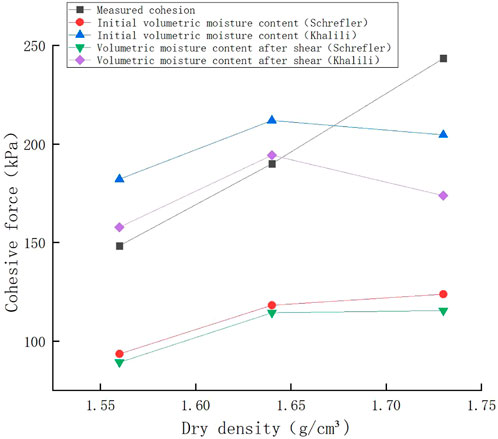
FIGURE 10. Calculated and measured cohesions of unsaturated reinforced granite residual soil.
From the literature (Zhang, 2018) and the testing results in this paper, it is known that the air-entry matrix suction of granite residual soil is about 10 kPa, thus
At the same time, the cohesion of unsaturated reinforced granite residual soil was also calculated using the initial volume moisture content 18.7% of the specimen, and corresponding matrix suction of granite residual soil according to initial volume moisture content 18.7% was read as 279.27 kPa from the moisture absorbing curve in Figure 8, and the apparent cohesion of the unsaturated reinforced granite residual soil was calculated according to Eq. 13. The calculated results were also shown in Figure 10:
where ∆cs is the apparent cohesion increment induced by matrix suction, being different from quasi-cohesion increment ∆cr contributed by the geogrid restriction.
As shown in Figure 10, relatively to the Schrefler unsaturated soil shear strength formula, the Khalili unsaturated soil shear strength formula can predict the cohesion of unsaturated reinforced soil more accurately, in which the cohesion includes three parts, i.e., effective cohesion
When the initial volume moisture content was considered, the errors using the Khalili method were significantly larger for the dry density 1.64 g/cm3 and 1.56 g/cm3 samples than those calculated using the shearing failure volume moisture content, but the error for the dry density 1.73 g/cm3 sample was relatively smaller.
Combining SWCC under a specific dry density condition with the Khalili formula may predict the cohesion of unsaturated reinforced soil approaching the specific dry density for unsaturated soil. Thus, formula (13) provides theoretical and experimental evidence to support the practical design, construction, and maintenance of reinforced soil structures.
It is also important to add in that both unsaturated soil and unsaturated reinforced soil tests always keep the back pressure at zero during testing, as the water content in soil samples do not have enough time to change during the triaxial shear process, and the volume change of unsaturated reinforced soil is caused mainly due to gas seepage; thus, soil volume at the moment of shearing failure is expressed in Eq. 14:
In order to verify the volume change mainly induced by gas seepage, a smaller back pressure of 20 kPa was applied for the soil specimen triaxial consolidation and drainage shear test in unsaturated states. During the shear test, any gas or water discharged from the specimen was measured. To minimize the impact of back pressure on the results, a lower back pressure 20 kPa was used. Using the dry density 1.64 g/cm3 specimens for the tests, Figure 11 displays the volume strain curves acquired through the triaxial consolidation and drainage shear tests.
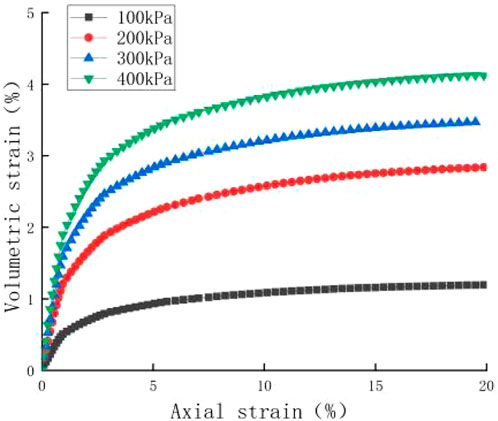
FIGURE 11. Volume strain and axial strain curves for unsaturated reinforced soil with ρd = 1.64 g/cm3.
The volumetric water contents calculated from Eq. 14 at the moment of shearing failure approached the measured values listed in Table 6, which indicates that the volume change was mainly due to dissipated gas.
5 Conclusion
1) Unsaturated reinforced soil has a significantly greater cohesion than saturated reinforced soil due to matrix suction. Experimental and theoretical results indicate that matrix suction contributes more to the total cohesion.
2) The water-added remodeling process of granite residual soil exhibited similarities to the hygroscopic stage. As a result, utilizing the hygroscopic stage’s soil-water characteristic curve allows for more accurate prediction of the apparent cohesion increment of unsaturated soil.
3) Quasi-cohesion increment calculating using formula (12) for the geogrid reinforced saturated soil was verified to be correct compared with the experimental results; Khalili’s modified formula accurately predicts the quasi-cohesive strength of unsaturated reinforced soils based on the effective cohesion, matrix suction, and reinforcement, as demonstrated.
4) By verifying theoretical results to the results of triaxial tests with three dry density specimens in unsaturated states, it is pointed that the Khalili unsaturated soil shear strength formula predicts the shear strength of soil using shearing failure volumetric water content slightly better than that calculated using the initial volumetric water content, by using reasonable SWCC.
Data availability statement
The raw data supporting the conclusion of this article will be made available by the authors, without undue reservation.
Author contributions
XD: Writing–original draft. ZZ: Writing–original draft. XL: Writing–original draft. XY: Writing–review and editing.
Funding
The author(s) declare financial support was received for the research, authorship, and/or publication of this article. National Natural Science Foundation of China (51978177).
Conflict of interest
The authors declare that the research was conducted in the absence of any commercial or financial relationships that could be construed as a potential conflict of interest.
Publisher’s note
All claims expressed in this article are solely those of the authors and do not necessarily represent those of their affiliated organizations, or those of the publisher, the editors and the reviewers. Any product that may be evaluated in this article, or claim that may be made by its manufacturer, is not guaranteed or endorsed by the publisher.
References
Abdi, M. R., Zandieh, A. R., Mirzaeifar, H., and Arjomand, M. A. (2019). Influence of geogrid type and coarse grain size on pull out behaviour of clays reinforced with geogrids embedded in thin granular layers. Eur. J. Environ. Civ. Eng. 25 (12), 2161–2180. doi:10.1080/19648189.2019.1619627
Bai, B., Zhou, R., Cai, G., Hu, W., and Yang, G. (2021). Coupled thermo-hydro-mechanical mechanism in view of the soil particle rearrangement of granular thermodynamics. Comput. Geotechnics 137 (8), 104272. doi:10.1016/j.compgeo.2021.104272
Bergado, T. D., Shivashankar, R., Alfaro, C. M., Chai, J. C., and Balasubramaniam, A. S. (1993). Interaction behaviour of steel grid reinforcements in a clayey sand. Géotechnique 43 (4), 589–603. doi:10.1680/geot.1993.43.4.589
Bishop, A. W., and Blight, G. E. (1963). Some aspects of effective stress in saturated and partly saturated soils. Géotechnique 13 (3), 177–197. doi:10.1680/geot.1963.13.3.177
Chehade, A. H., Dias, D., Sadek, M., Jenck, O., and Hage Chehade, F. (2020). Upper bound seismic limit analysis of geosynthetic-reinforced unsaturated soil walls. Geotext. Geomembranes 48 (4), 419–430. doi:10.1016/j.geotexmem.2020.02.001
Gao, Y., Chang, L. I. U., Tian, W., and Zhao, Y. (2018). Experimental study on the relationship between saturation and shear strength of silty clay. Pearl River 39 (02), 1–4.
Guoqing, C., Yi, L., Jian, L., Yang, R., and Zhao, C. (2022). Water retention curve with different void ratios over a wide suction range and its application to shear strength. Int. J. Geomechanics 22 (8). doi:10.1061/(asce)gm.1943-5622.0002484
He, Y., Liao, H., and Dong, Q. (2021). Experimental study on strength characteristics of geogrid -reinforced loess. Chin. J. Geotechnical Eng. 43 (S1), 181–185. doi:10.11779/CJGE2021S1033
He, Z. J., SiGa, A., and Zou, J. F. (2019). Research for reinforced fine-grained sand based on large-scale triaxial tests. J. Railw. Sci. Eng. 16 (10), 2451–2458. doi:10.19713/j.cnki.43-1423/u.2019.10.010
Huang, J., Fan, P., and Shan, Y. (2022). Study on unsaturated characteristics of granite residual soil and its slope stability. Build. Struct. 52 (24), 138–143. doi:10.19701/j.jzjg.ZJ220082
Infante, U. J. D., Martinez, A. M. G., Arrua, A. P., and Eberhardt, M. (2016). Shear strength behavior of different geosynthetic reinforced soil structure from direct shear test. Int. J. Geosynth. Ground Eng. 2 (2), 17. doi:10.1007/s40891-016-0058-2
Khalili, N., and Khabbaz, M. H. (1998). A unique relationship for χ for the determination of the shear strength of unsaturated soils. Geotechnique 48 (5), 681–687. doi:10.1680/geot.1998.48.5.681
Kouchaksaraei, K. M., and Khalkhali, B. A. (2020). The effect of geocell dimensions and layout on the strength properties of reinforced soil. SN Appl. Sci. 2 (10), 1701. doi:10.1007/s42452-020-03480-w
Lei, S. Y. (2000). Study on reinforced loess by triaxial tests. J. Xi’an Highw. Univ. (02), 1–5. doi:10.3321/j.issn:1671-8879.2000.02.001
Luo, X., and Fu, M. (2019). Experimental study of strength characteristics of unsaturated granite residual soil in collapsing erosion area. Water Power 45 (01), 107–111. doi:10.3969/j.issn.0559-9342.2019.01.027
Mahmoud, G., and Omid, B. (2021). Analytical solution for calculation of pull out force-deformation of geosynthetics reinforcing unsaturated soils. Geotext. Geomembranes. doi:10.1016/j.geotexmem.2021.12.005
Mohammadehsan, Z., and Mohammadreza, Z. (2017). Study on the impact of strain rate and loading speed on geogrid-reinforced soil. J. Sustain. Dev. 10 (2), 238. doi:10.5539/jsd.v10n2p238
Pham, A. T. (2022). Micromechanical-Based Shear strength equation considering the stress-state effect for unsaturated soils. Int. J. Geomechanics 22 (9). doi:10.1061/(ASCE)GM.1943-5622.0002495
Schrefler, B. A. (1984). The finite element method in soil consolidation:with applications to surface sidence. Swansea: University College of Swansea.
Wang, Z., Chang, L. I., and Xiao, L. (2021). Triaxial test study on reinforcement effect of reinforced cohesive soil. J. Chongqing Jiaot. Univ. Nat. Sci. 40 (07), 99–106. doi:10.3969/j.issn.1674-0696.2021.07.15
Wei-xiang, Z., Meng-jie, Y., and Fei-yu, L. (2023). Investigation on the cyclic shear response of stereoscopic geogrid-reinforced coarse-grained soil interface. Transp. Geotech., 38. doi:10.1016/j.trgeo.2022.100905
Chen, X., Zhang, J., and Li, Z. (2014). Shear behaviour of a geogrid-reinforced coarse-grained soil based on large-scale triaxial tests. Geotext. Geomembranes 42 (4), 312–328. doi:10.1016/j.geotexmem.2014.05.004
Zhang, He, and YaLong, L. I. (2023). Study of mechanical properties of reinforced red sandstone. J. Liaoning Tech. Univ. Sci. 42 (02), 143–151. doi:10.11956/j.issn.1008-0562.2023.02.003
Zhang, S. (2018). The safety of the unsaturated soil slope stability analysis under different moisture content. Shijiazhuang, China: Shijiazhuang Tiedao University.
Zhao, B., and Lin, Y. (2019). Stability analysis of the reinforced soil retaining wall against unsaturated soils. Railw. Eng. 59 (10), 100–103. doi:10.3969/j.issn.1003-1995.2019.10.24
Zhao, J., Xu, Z., and Chai, J. (2021). Experimental investigation in strength and water retention behaviors of remolded loess under drying-wetting cycle. Water Resour. Power 39 (09), 169–172+139.
Zhao, L. (2022). Research on physical and mechanical properties of unsaturated soil for Lanzhou-Cooperative high-speed railway line. Xi'an, China: Chang’an University.
Zhong, Z., Liu, Y., Liu, X., Li, X. y., and Wang, S. (2015). Influence of moisture content on shearing strength of unsaturated undisturbed quaternary system middle pleistocene. J. Central South Univ. 22 (7), 2776–2782. doi:10.1007/s11771-015-2808-z
Keywords: reinforced soil, granite residual soil, matrix suction, shear strength, soil-water characteristic curve
Citation: Deng X, Zhu Z, Lin Xy and Yang Xq (2023) Effect of matrix suction on the shear strength characteristics of reinforced granite residual soil. Front. Mater. 10:1284722. doi: 10.3389/fmats.2023.1284722
Received: 29 August 2023; Accepted: 04 October 2023;
Published: 03 November 2023.
Edited by:
Bing Bai, Beijing Jiaotong University, ChinaReviewed by:
Pan Liu, Guangzhou Maritime College, ChinaMing Zhang, Zhengzhou University of Aeronautics, China
Copyright © 2023 Deng, Zhu, Lin and Yang. This is an open-access article distributed under the terms of the Creative Commons Attribution License (CC BY). The use, distribution or reproduction in other forums is permitted, provided the original author(s) and the copyright owner(s) are credited and that the original publication in this journal is cited, in accordance with accepted academic practice. No use, distribution or reproduction is permitted which does not comply with these terms.
*Correspondence: Xue qiang Yang, eHF5ZmxzQDEyNi5jb20=