 Libo Ding
 An Zhang
- Ministerial Key Laboratory of ZNDY, Nanjing University of Science and Technology, Nanjing, Jiangsu, China
To ensure the reliable functioning of hard target-penetration fuze on the battlefield, this study focuses on research related to fuze protective pads. The main factors causing fuze functional failure are summarized, and a simplified model of projectile penetration into target plates is established. The design conditions for the yield stress parameter of the fuze casing material are derived based on stress wave propagation theory. Modal analysis of the projectile is conducted using dynamic simulation software ANSYS to determine its vibration modes and low-pass filtering frequency. Static compression experiments are performed on different rubber materials (nitrile rubber, fluorine rubber, silicone rubber, and natural rubber) to obtain stress–strain curves and constitutive model parameters. Marshall hammer tests were carried out on rubber pads of different materials and thicknesses, confirming the validity of the simulation results and the feasibility of rubber filtering. The study indicates that when using a 2 mm thick rubber pad for protection, natural rubber provides the best protection. When using a 6 mm thick rubber pad, nitrile rubber shows the best protective performance. Under a 13-tooth tooling impact load, the best protection is achieved using a 2 mm thick natural rubber pad. When using a 6 mm thick pad, silicone rubber provides the best protection. Under a 15-tooth tooling impact load, fluorine rubber provides the best protection when using a 2 mm thick pad, while silicone rubber offers the best protection when using a 6 mm thick pad. Under a 17-tooth tooling impact load, natural rubber offers the best protection when using a 2 mm thick pad, and fluorine rubber demonstrates the best protection when using a 6 mm thick pad. The obtained research results provide a reference for protective methods of hard target-penetration fuze.
1 Introduction
With the advancement of modern warfare, the survival capability of military bases in various countries has been continuously enhanced. This is achieved primarily by increasing the strength of buildings or applying coverings to military targets. Conventional ammunition is ineffective against robust and complex defensive structures. To achieve optimal destructive effectiveness, hard target-penetrating ammunition with features such as programmable layers, cavity recognition, and medium identification has become a focal point of research in various countries (Dang and Li, 2014; Zhang, 2018; Liu et al., 2023). The process of penetrating hard targets involves highly non-linear behavior under strong impact loads. During the high-speed penetration process, the overload signal experienced by the fuze is more complex than that experienced by the projectile. In this process, the overload peak of the fuze surpasses that of the projectile, and the overload pulse width of the fuze is shorter. Under high-intensity, low-duration pulses, the fuze casing is prone to deformation, leading to issues like circuit board fractures and chip pin detachment, rendering the fuze incapable of accurate detection and detonation. Protective measures are necessary to prevent fuze incapacitation.
To address the failure of internal electronic components of fuze under high-impact overloads, scholars have both domestically and internationally conducted various theoretical and experimental studies on protective techniques for hard target-penetration fuze (Manjesh and Manas, 2022). Replaced traditional isolation systems with magnetorheological impact isolation systems, finding that this approach effectively reduces the overload (Taherishargh et al., 2014). Developed a novel expanded perlite–aluminum composite foam and observed that this material exhibited high energy absorption efficiency (Xu and Huang, 2012). Addressed the inadequacies of the buffering mechanism of current projectile plastic materials, proposing a stress wave attenuation mechanism. They confirmed that the filtering mechanism of the pads is more rational than buffering through theoretical calculations and simulations. Furthermore, simulation results indicated that materials with a lower impedance have better filtering effects (Chen and Niu, 2021). Identified issues in the theory of multi-layer pad protection within fuze protective structures. They established a model of projectile penetration through a multi-layer pad structure, and simulation tests showed that widely used multi-layer pad protection structures are effective in penetrating concrete but are prone to functional failure when penetrating metals (Li et al., 2016). Designed three different buffering structures, experimentally determining that the buffering performance of a double-layer structure with impedance order combination is superior to that of an impedance reverse order combination. The fluctuating impedance combination is superior to the order combination for a three-layer buffering structure. References indicate that foam metal material, as a buffering pad, is suitable for energy absorption due to its significant deformation (Stamenković and Krstić, 2017; Ashu et al., 2020; Su et al., 2020; Fan et al., 2022; Wang et al., 2023). However, metal materials are only suitable for single-impact events, and their buffering effects may not meet the protection requirements during multiple impacts, possibly leading to fuze misfires (Ashu et al., 2020; Luo et al., 2021; Adam et al., 2022; Jiang et al., 2022; Wei et al., 2022). Rubber is the most common protective method, involving attenuation of stress transmission waves onto the fuze (Rose et al., 2023). Currently, the selection of rubber types and thicknesses for engineering protection lacks theoretical and data support and is based solely on engineering experience.
This study aims to address the gap in rubber protection research. It analyzes the theory of elastic wave reflection and transmission at different medium interfaces. By combining the analysis of elastic waves in the projectile–rubber–fuze structure with varying cross-sectional areas, different rubber layers are added on both sides of the fuze casing for protection. Based on dynamic simulations of projectiles penetrating reinforced concrete target plates, the impact of different rubber pads, thicknesses, and target conditions on fuze overload is investigated. Modal analysis of the projectile is conducted to determine its first-order axial vibration frequency, which is then used to filter the fuze overload curve. Combining numerical simulation results with experimental designs, impact loads are applied to accelerometers using a Marshall hammer to experimentally verify the protective performance of different rubbers, thicknesses, and impact loads.
2 Hard target penetration theory and fuze failure analysis
2.1 Fuze failure caused by stress wave effects
During the impact of high-speed hard target-penetrating projectiles on a target, the fuze experiences stress transmitted from the projectile, propagating through the fuze in the form of stress waves. When these stress waves reach the fuze circuit board, the oscillations can lead to detachment of solder joints, breakage of connecting lines, battery discharge, and ultimately the loss of fuze functionality, as shown in Figure 1.
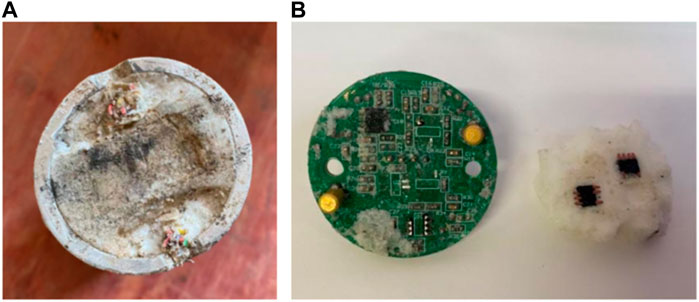
FIGURE 1. Analysis of fuze failure during penetration. (A) Deformation of the recovery system casing. (B) Detachment of the chip.
2.2 Reflection and transmission theory of elastic waves at varying cross-section interfaces
During high-speed impact, the projectile and the fuze will be subjected to strong dynamic loads, and the stress generated will be transmitted to different parts in different forms of waves. When the stress does not exceed the yield stress of the material, the stress waves generated are mainly elastic waves, and when the stress does not exceed the yield stress of the material, the stress waves generated are mainly plastic waves. This article mainly discusses the case where the applied overload stress does not exceed the yield limit of the material, that is, the transmission of elastic waves at different media interfaces. The propagation of elastic stress waves at interfaces with varying cross-sections follows Newton’s third law, which states that the stress on both sides of the interface is equal. Therefore, it can be determined as follows:
In the equation, ΔvI is the velocity of the particle incident wave, ΔvR is the velocity of the particle reflected wave, ΔvT is the velocity of the particle transmitted wave, ΔσI is the incident wave, ΔσR is the reflected wave, ΔσT is the transmitted wave, A1 is the area of the first cross-section, A2 is the area of the second cross-section, and the parameters in the formula are all vectors. Using the principle of conservation of momentum for wave fronts, it can be obtained as follows:
In the equation ρ Is the target density, Eq. 2 can be simplified as follows:
By solving Eqs 1, 4 simultaneously, the following expression can be obtained:
where ρ0C0A is referred to as the generalized wave impedance, n is the wave impedance ratio of two different media, R is the reflection coefficient, and T is the transmission coefficient. Both coefficients are completely determined by the wave impedance ratio n.
For simplicity, let us consider the case of equal wave impedance ρ0C0 on both sides of the interface, making the wave impedance ratio n = A1/A2. From Eq. 5, it can be observed that the transmitted wave always has the same sign as the incident wave. The sign of the reflected wave depends on the positive or negative value of F, which is related to the relative sizes of A1 and A2. When stress waves pass from the smaller contact area to the larger one (A1 < A2, meaning n < 1), T·A1/A2 = 2n/1 + n < 1, resulting in the same sign for the reflected and incident waves, and the transmitted wave is smaller than the incident wave. Conversely, when stress waves pass from the larger contact area to the smaller one (A1 > A2, meaning n > 1), T·A1/A2 = 2n/1 + n > 1, resulting in opposite signs for the reflected and incident waves, and the transmitted wave is larger than the incident wave. Therefore, when wave impedances are the same, passing the shock wave from the smaller end to the larger cross-section end can still achieve damping and buffering effects.
2.3 Analysis of stress wave impact in fuze models
The fuze system consists of the projectile, main propellant charge, fuze, base plug, and other structures. The fuze structure primarily includes potting material, circuit board, and mechanical safety components. The signal measured from the circuit board of the fuze represents the overload applied to the fuze within this fuze system during penetration. The strong dynamic load experienced by the projectile upon impact is transmitted through various structures such as projectile–main propellant charge–padding–fuze–padding–base plug. The signal transmission process is highly complex, and the overload signal is subject to various influences during transmission. The analysis of projectile impact on a target plate is analogous to the problem of a finite rod impacting a rigid wall (Zhu et al., 2022). The moment of the projectile impacting the target plate can be simplified as shown in Figure 2. This study neglects the plastic compression wave caused by deformation of the target plate and the projectile head, focusing solely on the transmission of elastic waves onto the fuze after the projectile impacts the target plate. In the elastic region, the stress experienced by an object is the yield stress as follows:
where VY is the yield velocity of the particle, ρ0 is the density of the particle, and C0 is the speed of propagation of the stress wave within the object.
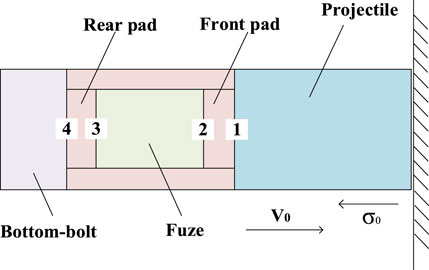
FIGURE 2. Simplified illustration of impact on the target plate.
Based on the theory of reflection and transmission of elastic waves at interfaces with varying cross-sections, when elastic stress waves reflect and transmit at the interface between the front cushion pad and the projectile, interface 1 can be determined as follows:
where T1 and R1 are the transmission and reflection coefficients at this interface, respectively, and so on for subsequent interfaces.
When stress waves penetrate interface 1, the incident wave at interface 2 is the transmitted wave at interface 1, namely, (σI)2 = (σT)1. In this case, the size of the reflected wave generated at interface 2 in relation to the incident wave is calculated as follows:
Similarly, the size of the reflected wave generated at interface 3 in relation to the incident wave is expressed as follows:
The size of the reflected wave generated at interface 4 in relation to the incident wave is computed as follows:
The size of the transmitted wave generated at interface 3 by the reflection of the stress wave at interface 4 is obtained as follows:
To avoid plastic failure of the fuze casing, the stress on the fuze casing must be smaller than the yield stress σY, which gives rise to the following conditions:
① For:
② For:
③ For:
Combining conditions ①, ②, and ③ enables us to determine the parameters for setting the fuze casing protection material.
3 Determination of material parameters for rubber pads of penetration Fuze
3.1 Fuze failure caused by stress wave effects
To simulate realistic projectile penetration overload conditions, Solidworks, a three-dimensional modeling software was used to create solid element models of various components of the projectile. The model is illustrated in Figure 4. The projectile has a length of 720 mm, a diameter of 110 mm, and a length-to-diameter ratio of 6.5. The simulation model includes a simulated propellant, the entire fuze body, and the front and rear cushion pads within the projectile. The base plug at the tail of the projectile is connected in a fixed manner. ANSYS/Workbench software was used to perform modal analysis on the projectile. Since modal analysis is only concerned with the inherent frequencies and modes of the entire projectile, and not the failure between contact materials, the contact between the materials within the projectile was set as bonded. The elastic model of rubber materials takes silicone rubber as an example. The material parameters used in the simulation model for the various components of the projectile are presented in Table 1. The projectile body and reinforced concrete target plate are both axisymmetric models, and the missile guidance system penetrates perpendicular to the direction of the reinforced concrete target plate. In order to reduce calculation time and cost, this article uses a 1/4 three-dimensional geometric model to model the missile guidance model and the reinforced concrete target plate, and divides the mesh in Hypermesh software. Except for the warhead grid, the standard size of the other grids is about 5 mm, and the minimum size of the missile structure grid is a regular hexahedron of 2 mm. The grid division results of the missile guidance structure are shown in Figure 3.
TABLE 1. Parameters of various components in the projectile.

FIGURE 3. Mesh division of missile guided structure.
Due to the irregular three-dimensional structure of the warhead head, a special mesh division was performed on the warhead, and the division results are shown in Figure 4 below.
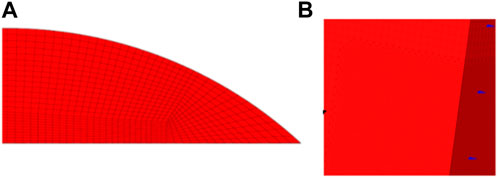
FIGURE 4. (A)Mesh division details of projectile head.(B)Division of single-layer target plate mesh and steel mesh.
3.2 Modal analysis results
Modal analysis using the ANSYS/Workbench software provided the inherent frequencies and corresponding modes of the projectile. As the projectile is not constrained and is in a free vibrational state, the first six modes are rigid body oscillations with zero inherent frequency. Starting from the seventh mode, the modes include compression, tension, torsion, and bending. Table 2 contains the inherent frequencies and modes of the projectile for modes 7 to 12, while Figure 5 displays the mode shapes for these modes.
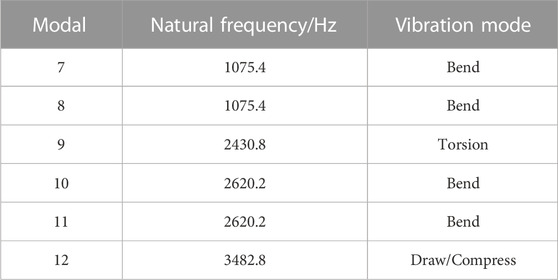
TABLE 2. Modal analysis and mode shapes of the projectile model.
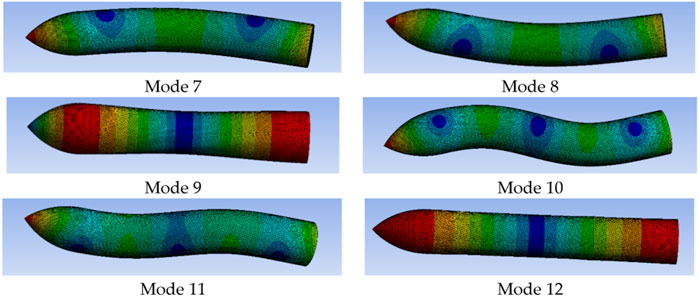
FIGURE 5. Mode shapes of the projectile at various modes.
During the penetration process, a significant portion of the overload signal experienced by the projectile is due to axial overloads. As the modes involving bending and torsion do not significantly affect the axial overload measurement during projectile penetration, the lowest mode of compression–tension should be used as the cutoff frequency for signal filtering. Based on Figure 5; Table 2, it can be inferred that a frequency around 3482.8 kHz should be used to filter the collected overload signal, eliminating the influence of high-frequency oscillations on the collected overload signal.
3.3 Stress–strain curve testing of rubber materials
The universal material testing machine AGX-V series by Shimadzu, Japan, was used to conduct compression tests on four types of rubber materials (nitrile rubber, fluorine rubber, silicone rubber, and natural rubber). Use 1 sample for each type of rubber, compression testing standards follow ISO 13314:2011, metallic materials-Ductility testing-Compression test for porous and cellular metals.To obtain reliable stress–strain curves, the rubber materials were uniformly cut into 10 mm × 10 mm × 10 mm cubes and placed on the testing platform, as shown in Figure 6. The loading speed applied to the materials was 2 mm/min, and a strain value of 0.9 was set.
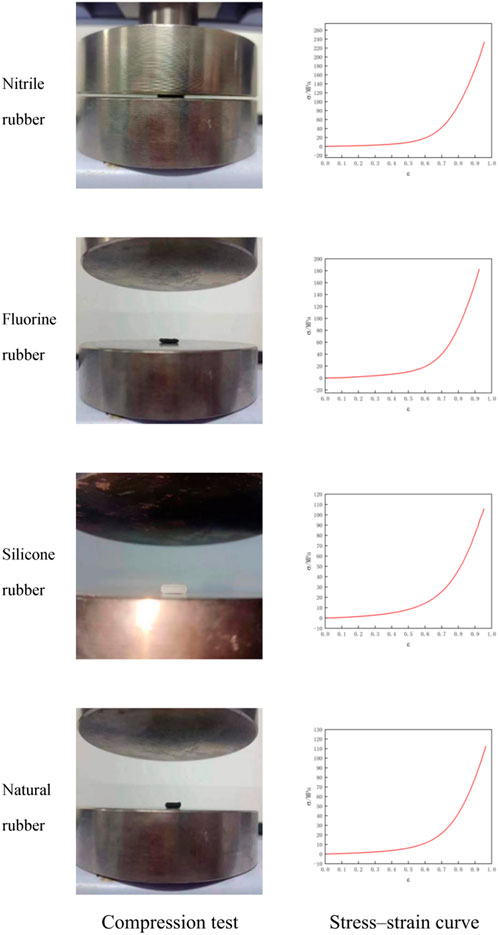
FIGURE 6. Compression test on four types of rubber materials.
3.4 Curve fitting and parameter setting
The static structural analysis feature of the Workbench software was utilized, and the engineering data option was selected. Use the engineering date option and import the stress-strain test data of four materials into the hyperelastic test data, after selecting the Mooney-Rivlin 5 Parameter constitutive model in hyperelastic materials and fitting the curve, parameters such as C10, C01, C11, C02, C20 of each rubber can be obtained. These parameters were input into the *MAT_H-HYPERELASTIC_RUBBER constitutive model in the k file. The specific parameters are provided in Tables 3. In the table, RO is the density, PR is the Poisson’s ratio, and C is the constant of rubber material.
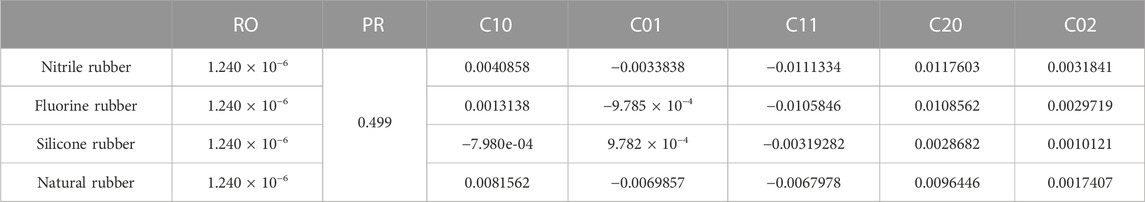
TABLE 3. Four rubber material parameters (kg/mm/ms).
4 Simulation analysis of impact on rubber pad parameters on buffering protection performance
4.1 Analysis of 2 mm pad protection performance
The projectile’s penetration process can be divided into three phases: the pit formation phase, the tunneling phase, and the target back-collapse phase (exit phase). During the pit formation phase, the initiator’s overload increases from zero to the appearance of the first peak. In the tunneling phase, the initiator’s overload remains within a certain range and undergoes continuous oscillations. In the target back-collapse phase, the initiator’s overload continuously decreases until it reaches zero. To investigate the overload experienced by the initiator’s internal circuit board during the projectile’s penetration process under different protective pads, this study examined the overload experienced by the initiator under the protection of 2 mm thick nitrile rubber, fluororubber, silicone rubber, and natural rubber. LS-Prepost software was employed to extract data, resulting in overload curves of the initiator’s internal circuit board as the projectile penetrated the C60 target plate at an initial velocity of 900 m/s. Additionally, Fourier transformation was applied to the obtained curves to derive their frequency domain curves, as illustrated in Figure 7.
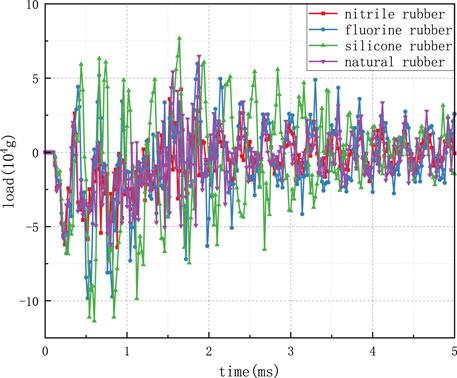
FIGURE 7. Time-domain overload curve of the circuit board.
From the figures, it can be observed that the initiator protected with natural rubber experiences the lowest overload during the impact moment, with a minimum of 47,600 g. Following this, nitrile rubber exhibited an overload of 62,100 g, fluororubber with 68,000 g, and the least effective was silicone rubber, with an overload of 68,400 g on the initiator’s circuit board. After the pit formation phase, the penetration enters the tunneling phase where the overload stabilizes at a certain value. Due to reasons such as grid failure on the target plate, interference with the overload signal occurs, leading to persistent oscillations in the initiator’s overload. These oscillations might exceed the peak overload value experienced during the penetration moment. Initiators protected with natural rubber and nitrile rubber exhibited smaller oscillations, while those protected with fluororubber experienced larger oscillations. Initiators protected with silicone rubber experienced the most significant oscillations. During the target back-collapse phase from 1.08 m to 1.48 m, the overload on the initiator gradually reduced, and thereafter the overload oscillated around zero. After the projectile exits the target, due to residual elastic potential energy within the rubber material, silicone rubber possesses higher internal elastic potential energy compared to other rubbers. As depicted in the graph, after the projectile exits the target, there was significant oscillation in overload on the initiator’s circuit board. The oscillation lasted for about 1.5 m, imposing substantial damage to the initiator.
By subjecting the overload signal from Figure 7 to Fourier transformation, the frequency-domain curve of initiator overload was derived, as shown in Figure 8. During the penetration process, the natural frequency of the projectile significantly influenced the initiator’s overload. From the graph, it is evident that around the projectile’s natural frequency of approximately 3.4 kHz, natural rubber exhibits the best filtering effect. Nitrile rubber follows, with fluororubber being less effective, and silicone rubber showing the least favorable effect. In the higher-frequency range, disparities exist among different rubbers. At 14.5 kHz, nitrile rubber performs best, while at 6.95 kHz and 10.3 kHz, fluororubber demonstrates optimal filtering effects.
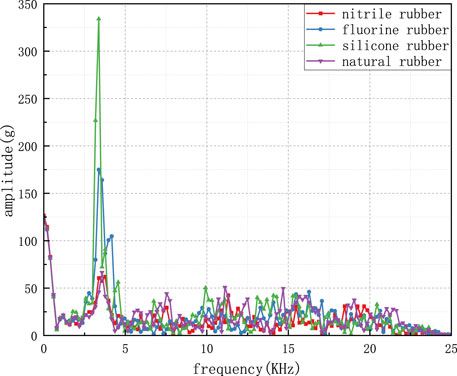
FIGURE 8. Frequency-domain overload curve of the fuze’s internal circuit board.
Figure 9 depicts the processed overload signal from the collected circuit board, which has undergone a third-order wavelet transformation using the db6 base. The analysis of this signal yields results consistent with the unprocessed overload signal. Natural rubber demonstrates the best filtering performance, with an overload peak value of 32,800 g. Subsequently, the overload remains within a specific range, with gradually diminishing oscillation amplitudes. In contrast, silicone rubber exhibits a maximum intrusion overload of 47,200 g, marked by substantial oscillations during the penetration phase, followed by a significant post-penetration oscillation amplitude of 23,000 g that gradually decreases. The velocity–time curve of the projectile is extracted using post-processing software, as shown in Figure 10. It is evident from the graph that the projectile attains a residual velocity of approximately 585 m/s after penetrating the C60-reinforced concrete target at an initial velocity of 900 m/s.
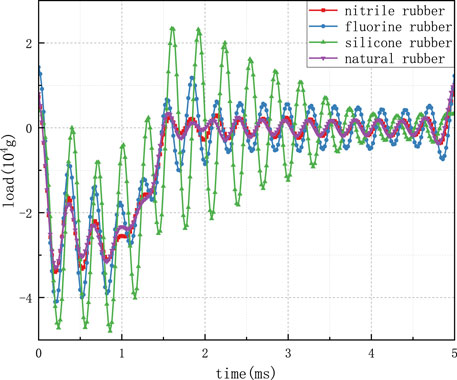
FIGURE 9. Time-domain overload curve after wavelet-based filtering.
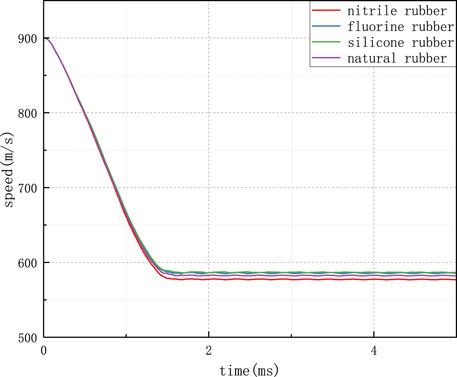
FIGURE 10. Projectile velocity–time curve during penetration.
In summary, under this operating condition, the use of natural rubber with a 2 mm cushioning layer yields the most effective protection, exhibiting negligible oscillations during and after penetration. This is because natural rubber has high mechanical strength, good resistance to bending fatigue, small hysteresis loss, and self reinforcing effect.
4.2 Analysis of 6 mm cushioning pad protection performance
Figure 11 illustrates the overload signal on the internal circuit board of the fuze. It can be observed from the figure that at the instant of impact on the target, the protective effects of the four rubber materials on the fuze are generally similar. The peak overload value during the penetration moment was approximately 52,900 g. After the initial penetration stage, the projectile transitions into the penetration channel phase. During this phase, the overload stabilizes at a certain value. However, due to factors such as target mesh failure, the overload signal experiences interference, leading to sustained oscillations of the fuze overload, with amplitudes potentially surpassing the peak overload value during penetration. Within the penetration channel phase, for the fuze protected with silicone rubber, an oscillation with a maximum peak value is evident. The time period between 1.08 m and 1.48 m corresponds to the stage where the projectile penetrates the target plate and the target collapses. During this period, the overload on the fuze gradually diminishes, eventually resulting in oscillations around zero. After the projectile exited the target, the overload signal of the fuze protected with natural rubber exhibited significant oscillations of around 0.5 m with substantial amplitude.

FIGURE 11. Time-domain curve of the circuit board overload.
By subjecting the overload signal depicted in Figure 11 to Fourier transformation, the frequency-domain curve of the fuze overload was obtained, as shown in Figure 12. During the penetration process, the inherent frequency of the projectile has a significant influence on the fuze overload. It can be discerned from the figure that around the projectile’s inherent frequency of approximately 3.4 kHz, nitrile rubber demonstrated the most effective filtering, followed by silicone rubber, then fluorine rubber, and finally, natural rubber with the least effective filtering at this frequency. In the high-frequency range, differences are apparent among the various rubber materials, particularly with silicone rubber showing the best filtering effects at frequencies around 10.3 kHz and 14.5 kHz.
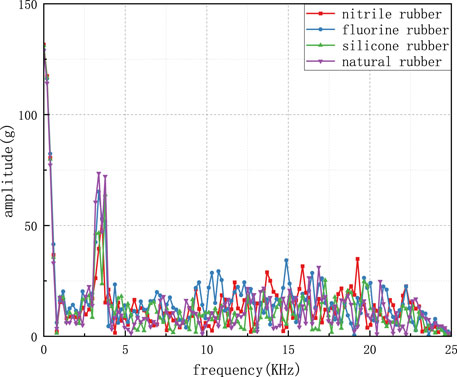
FIGURE 12. Frequency-domain curve of the internal circuit board overload for the fuze.
Figure 13 shows the circuit board overload signal on the collected data processed with third-order Daubechies wavelet transform (db6). The results of the signal analysis are consistent with the unfiltered overload signal. Among them, the maximum overload of the fuze protected by fluororubber was about 30,000 g, and there was no significant oscillation phenomena after impact. However, when the fuze was protected by natural rubber, although the overload during impact was slightly lower than the fuze, there was an oscillation phenomenon after impact. The velocity–time curve of the projectile was extracted using post-processing software, as shown in Figure 14. It can be observed from the figure that after the projectile impacted the C60-reinforced concrete target board at an initial speed of 900 m/s and protected by four different cushioning materials, there were significant differences in the projectile’s exit velocity, with a maximum difference of 16 m/s and an average residual velocity of 573 m/s.
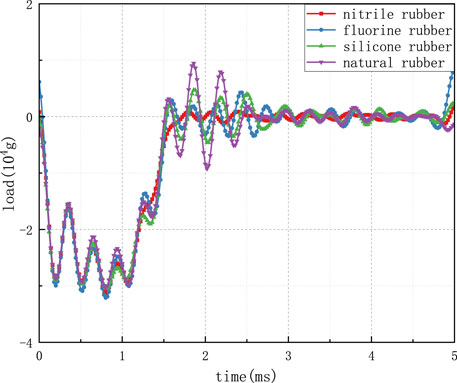
FIGURE 13. Time-domain curves of the filtered circuit board overload signals.
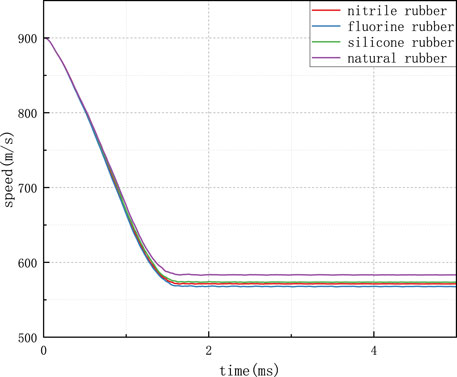
FIGURE 14. Projectile velocity–time curves during penetration.
In summary, under this working condition, the use of 6 mm rubber pads with nitrile rubber protection demonstrates the most effective performance. The original signal shows no significant oscillations during the penetration process and after perforation. This is because nitrile rubber is an amorphous rubber with slightly lower elasticity. Generally, the energy absorption of specialized energy absorption structures refers to the plastic properties dissipated under compressive loads. The impact loads of the four types of rubber are consistent and all undergo plastic deformation. Nitrile rubber has higher strength, so it absorbs more kinetic energy during penetration.
5 Analysis of different protective pad cushioning performance
5.1 Experimental design
This study employs the Marshall hammer impact test method to verify the cushioning protective performance of different buffer materials under varying impact overloads. The Marshall hammer device, as depicted in Figure 15, consists of a handle, hammer head, steel pellets, counterweights, and other components. Given the different mass of counterweights in the Marshall hammer test device for the same tooth count, variations in the applied impact to the experimental specimen arise. The calibration of impact overload for the required Marshall hammer tooth count used in the experiment is conducted. The sensitivity of the sensor used in the experiment is 0.8 μV/g, and its amplification factor is 70 times. The calibration results are presented in Table 4.
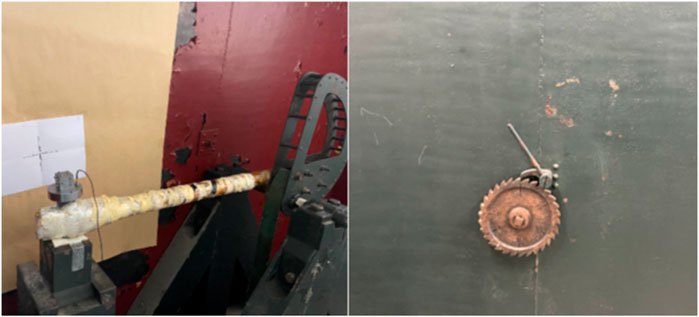
FIGURE 15. Internal configuration and external serrated shaft of the Marshall hammer.
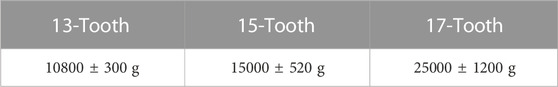
TABLE 4. Marshall hammer experiment platform tooth count acceleration calibration.
In this study, piezoresistive acceleration sensors were employed to collect overload signals. The underlying principle involves changes in electrical resistance during the instant of impact, leading to voltage alterations. These voltage changes are then utilized to calculate the variation in voltage, which, in turn, indicates the overload signal experienced by the sensor. The collection apparatus consists of acceleration sensors, threaded caps, counterweights, test materials, and threaded bases. The physical depiction of the various components of the collection apparatus is shown in Figure 16.
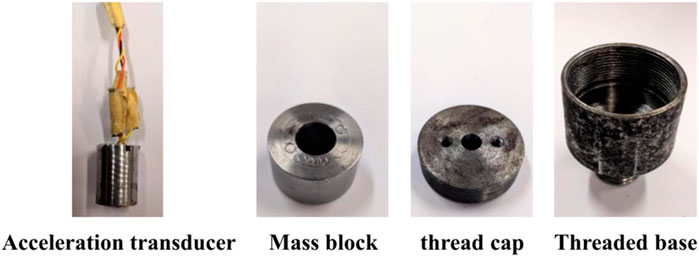
FIGURE 16. Physical depictions of various components.
The overall structure of the experimental setup is illustrated in Figure 17.
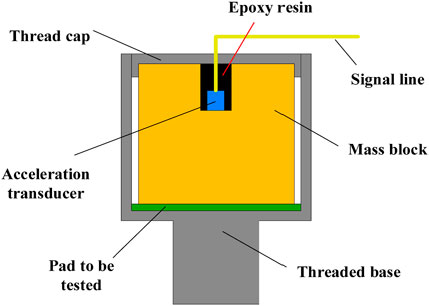
FIGURE 17. Schematic representation of the experimental setup.
Different types of rubber pads are illustrated in Figure 18.
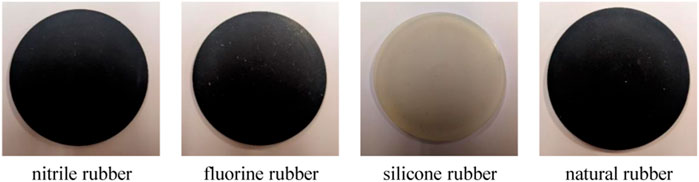
FIGURE 18. Different types of rubber pads.
5.2 Analysis of different rubber protective performance under a 13-tooth impact
Figure 19 presents the voltage variation curve of an acceleration sensor under a 13-tooth impact load for different 2 mm thick rubber pad protections. The red solid line represents nitrile rubber, the blue dashed line signifies fluorine rubber, the green dotted line stands for silicone rubber, and the purple dotted line represents natural rubber. Under the influence of a 13-tooth impact load, with a 2 mm thick pad, it is observed that natural rubber offers the best protective performance, exhibiting a peak overload value of 8,703 g and minimal oscillations. Silicone rubber displayed the poorest protective performance with a peak overload value of 9,885 g and significant oscillations. Although nitrile rubber’s protective performance was lower than that of natural rubber, it exhibited no oscillation signal after impact. The summarized data for different rubber materials under the same experimental conditions are presented in Table 5.
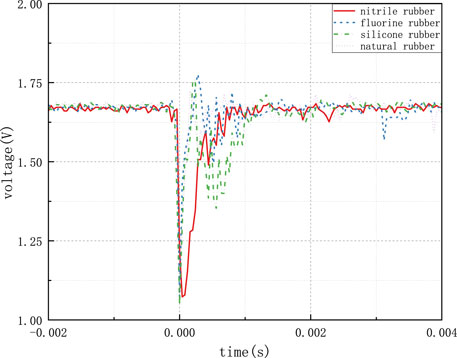
FIGURE 19. Voltage variation curve of the acceleration sensor.
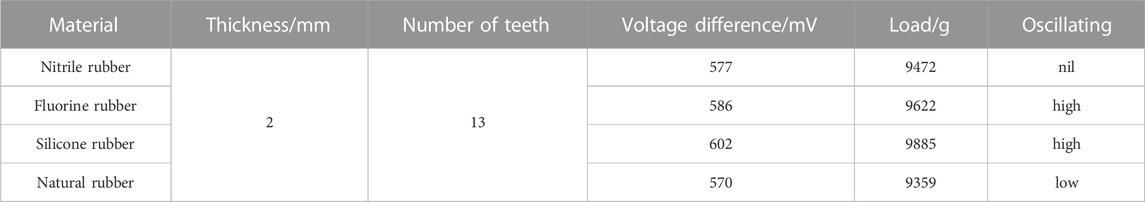
TABLE 5. Experimental results for different 2 mm thick rubber materials.
Figure 20 presents the voltage variation curve of an acceleration sensor under a 13-tooth impact load for different 6 mm thick rubber pad protections. Similar to the previous case, different rubber materials are represented by different colors. With a 6 mm thick pad, silicone rubber offered the best protective performance, displaying a peak overload value of 5,550 g, however, it exhibited substantial oscillations. Natural rubber demonstrated the poorest protective performance with a peak overload value of 8834 g but no significant oscillations. Fluorine rubber’s protective performance slightly lagged behind that of silicone rubber but exhibited only minor oscillations after impact. The summarized data for different rubber materials under the same experimental conditions are presented in Table 6.
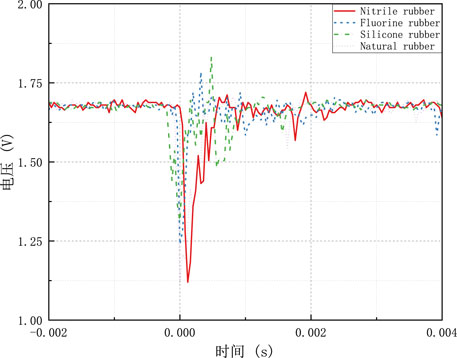
FIGURE 20. Voltage variation curve of the acceleration sensor.
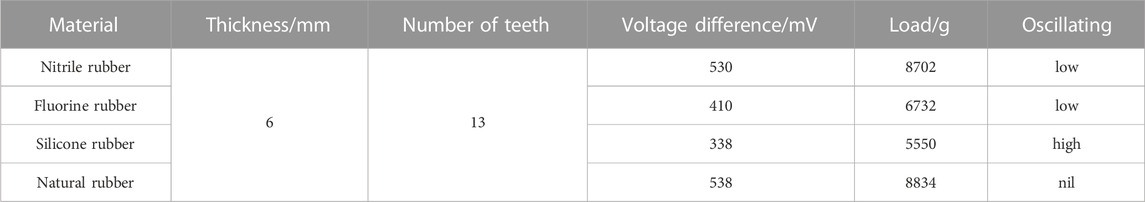
TABLE 6. Experimental results for different 6 mm thick rubber materials.
5.3 Analysis of different rubber protective performance under a 15-tooth impact
Figure 21 presents the voltage variation curve of the acceleration sensor when using different 2 mm thick rubber pads for protection under a 15-tooth impact load. The red solid line represents nitrile rubber as the cushion pad, the blue dashed line corresponds to fluororubber as the cushion pad, the green dotted line represents silicone rubber as the cushion pad, and the purple dotted line stands for natural rubber as the cushion pad. It can be observed that under the 15-tooth impact load, in the case of 2 mm thick pads, fluororubber exhibited the best protective performance with a peak overload value of 11,724 g, however, it was accompanied by significant oscillations. The silicone rubber exhibited the poorest protective performance with a peak overload value of 14,351 g and substantial oscillations. Nitrile rubber offered lower protective performance compared to fluororubber, but it resulted in only minor post-impact oscillations. The sensor protected by natural rubber showed no oscillation. The summarized data for different rubbers under the same experimental conditions are presented in Table 7.
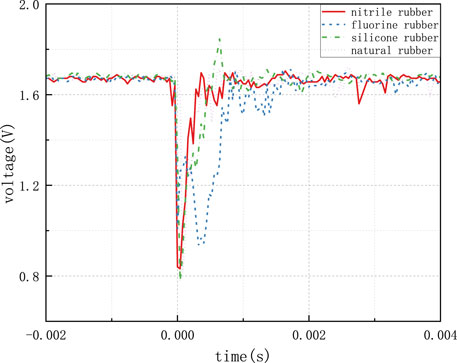
FIGURE 21. Voltage variation curve of the acceleration sensor.
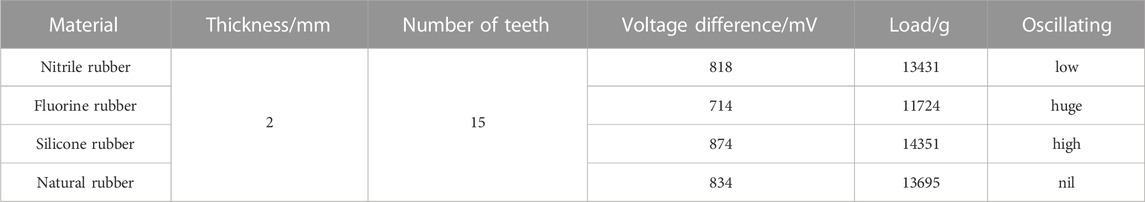
TABLE 7. Experimental results for different 2 mm thick rubbers.
Figure 22 displays the voltage variation curve of the acceleration sensor when using different 6 mm thick rubber pads for protection under the 15-tooth impact load. Similar to the previous figure, the color coding remains consistent. In the case of 6 mm thick pads, silicone rubber demonstrated the best protective performance, with a peak overload value of 9,606 g and smaller oscillations. Fluororubber exhibited the poorest performance with a peak overload value of 10,311 g and significant oscillations. The summarized data for different rubbers under the same experimental conditions are presented in Table 8.
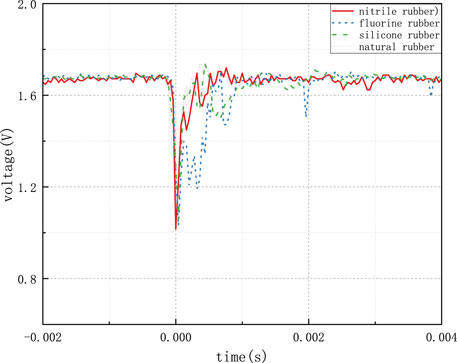
FIGURE 22. Voltage variation curve of the acceleration sensor.
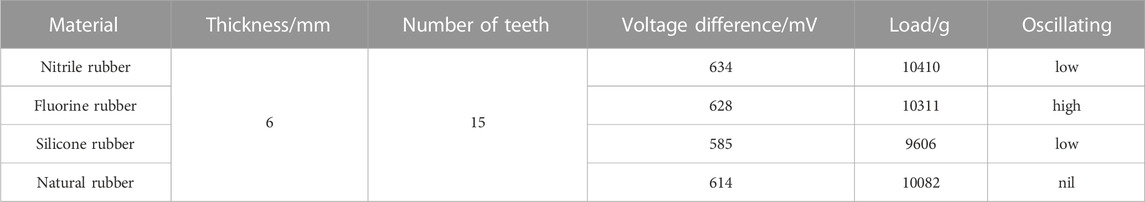
TABLE 8. Experimental results for different 6 mm thick rubbers.
5.4 Analysis of different rubber protective performance under a 17-tooth impact
Figure 23 illustrates the voltage variation curve of the acceleration sensor when using different 2 mm thick rubber pads for protection under the 17-tooth impact load. The color-coding scheme is consistent with the previous figures. Under the 17-tooth impact load, with 2 mm thick pads, natural rubber offered the best protective performance, yielding a peak overload value of 16,880 g without significant oscillations. Fluororubber exhibited the poorest performance, with a peak overload value of 18,949 g and substantial post-impact oscillations. The summarized data for different rubbers under the same experimental conditions are presented in Table 9.
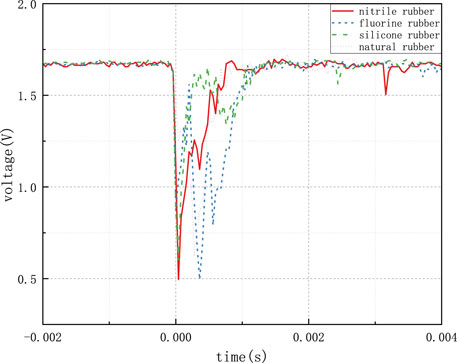
FIGURE 23. Voltage variation curve of the acceleration sensor.

TABLE 9. Experimental results for different 2 mm thick rubbers.
Figure 24 shows the voltage variation curve of the acceleration sensor when using different 6 mm thick rubber pads for protection under the 17-tooth impact load. The color coding corresponds to the rubber types mentioned earlier. For 6 mm thick pads, fluororubber demonstrated the best protective performance with a peak overload value of 13,300 g, albeit accompanied by significant oscillations. Nitrile rubber protection exhibited a slightly lower performance than silicone rubber, with a peak overload value of 18,029 g and smaller oscillations. The summarized data for different rubbers under the same experimental conditions are presented in Table 10.
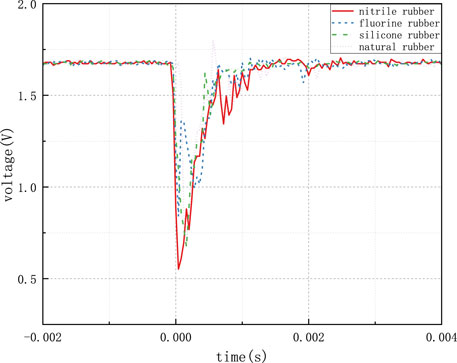
FIGURE 24. Voltage variation curve of the acceleration sensor.
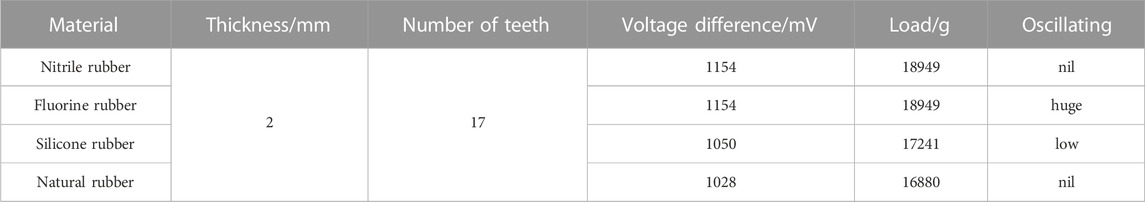
TABLE 10. Experimental results for different 6 mm thick rubbers.
5.5 Summary of experimental results
Based on the horizontal comparison of four types of rubber, it can be seen that fluorine rubber has the worst protective effect regardless of its thickness, while the rest of the rubber exhibits different protective performance under different penetration overloads or thicknesses. When using a 2 mm thick gasket, regardless of the size of the overload, natural rubber has the best comprehensive protective performance. This is because natural rubber has the best comprehensive performance, with high elasticity, strength, and impact toughness; When using 4 mm gaskets, silicone rubber should be used for protection when the overload is not higher than 60,000 g. When the overload is higher than 60000 g, nitrile rubber should be used because nitrile rubber has the highest impact strength; When using 6 mm gaskets, silicone rubber should be used for protection when the overload does not exceed 50000 g. When the overload exceeds 50,000 g, nitrile rubber should be used. When the penetration overload does not exceed 50,000 g, the optimal choice should be 4 mm silicone rubber; On the contrary, 2 mm nitrile rubber should be used.
Overall, the peak overload of silicone rubber is the smallest, but after the end of impact overload, there is a significant oscillation signal in the acceleration sensor protected by silicone rubber, which is consistent with the phenomenon in simulation; The overload peak of natural rubber is slightly lower than that of silicone rubber, but there is no obvious oscillation signal after impact; As for fluorine rubber and nitrile rubber, there is either a problem of high overload peak or obvious oscillation after impact. Experiments have confirmed that the rubber used in the simulation has different protective characteristics in different situations. Therefore, when using rubber as a protective material, the “soft” protective performance of this material cannot be relied solely on, as the “hard” protective performance of this material is poor; Even when the same material penetrates different targets, its protective characteristics will still have significant changes.
6 Conclusion
This study addressed the issue of high overload experienced by initiators during the process of hard target penetration. It analyzed the main failure modes of initiators and the theory of stress wave transmission at the projectile–initiator system interface. The study examined the overload signals on the internal circuit boards of initiators under different rubber protections and thicknesses. Furthermore, it validated the simulations using laboratory Marshall hammer impact tests. The main conclusions drawn from the study are as follows:
1) The majority of overload signals experienced by the projectile during penetration result from axial overloads. Filtering the collected signals at frequencies around 3482.8 kHz effectively eliminates the influence of high-frequency oscillations on overload signal collection.
2) When using 2 mm thick rubber pads for protection, natural rubber demonstrates the best protective performance, while the overload on the initiator’s circuit board reaches around 68,400 g. When using 6 mm thick pads, nitrile rubber is best.
3) When using a 2 mm thick pads for protection under 13 tooth tooling impact load, natural rubber has the best protective performance, silicone rubber is the best when using 6 mm thick pads. When using a 15 tooth fixture to impact a 2 mm thick pads, fluororubber is the best, and when using a 6 mm thick pads, silicone rubber is the best. When using a 17 tooth tooling to impact a 2 mm thick pads, natural rubber is the best, and when using a 6 mm thick pads, fluororubber is the best.
Data availability statement
The original contributions presented in the study are included in the article/Supplementary Material, further inquiries can be directed to the corresponding author.
Author contributions
LD: Writing–original draft. AZ: Writing–review and editing. JP: Methodology, Writing–review and editing. CL: Funding acquisition, Project administration, Writing–review and editing.
Funding
The authors declare that no financial support was received for the research, authorship, and/or publication of this article.
Conflict of interest
The authors declare that the research was conducted in the absence of any commercial or financial relationships that could be construed as a potential conflict of interest.
Publisher’s note
All claims expressed in this article are solely those of the authors and do not necessarily represent those of their affiliated organizations, or those of the publisher, the editors and the reviewers. Any product that may be evaluated in this article, or claim that may be made by its manufacturer, is not guaranteed or endorsed by the publisher.
Supplementary material
The Supplementary Material for this article can be found online at: https://www.frontiersin.org/articles/10.3389/fmats.2023.1284738/full#supplementary-material
References
Adam, G., Jeffrey, B., and Gregory, B. (2022). An arbitrary Lagrange-Eulerian investigation of HRAM shallow jet pre-spurt formation and time sensitivities to impact plate dynamics. Int. J. Impact Eng. 167, 267–275. doi:10.1016/j.ijimpeng.2022.104275
Ashu, S., Nivedita, S., Varun, S., and Maneesha, G. (2020). Series optimized fractional order low pass butterworth filter. Arabian J. Sci. Eng. 45, 44–57. doi:10.1007/s13369-019-04225-7
Chen, J., and Niu, S. H. (2021). Anti-impact performance simulation of fuze multi-layer gasket protection structure. J. Detect. Control 43, 15–21.
Dang, A. G., and Li, X. J. (2014). Review and prospect of the development of earth penetrating weapons abroad. Winged missile 06, 35–39.
Fan, T., Cheng, D., and Zhe, Y. (2022). Protective performance and dynamic behavior of composite body armor with shear stiffening gel as buffer material under ballistic impact. Compos. Sci. Technol. 218, 89–94. doi:10.1016/j.compscitech.2021.109190
Jiang, W. F., Yin, G. F., and Xie, L. F. (2022). Multifunctional 3D lattice metamaterials for vibration mitigation and energy absorption.International. J. Mech. Sci. 233, 76–78. doi:10.1016/j.ijmecsci.2022.107678
Li, P. F., Qu, K. P., and Yang, L. (2016). Optimization design for the buffer structure of penetrating warhead. Sci. Technol. Eng. 16, 99–102.
Liu, W. J., Zhang, Q. M., Long, R. R., Gong, Z., Jiankang, R., Hu, X., et al. (2023). Effects of projectile parameters on the momentum transfer and projectile melting during hypervelocity impact. Def. Technol. 22, 14–47. doi:10.1016/j.dt.2023.06.012
Luo, H. T., Li, Y. X., Fan, C., Wu, X., and Liu, G. (2021). Design and experimental research on buffer protection of high-g penetrator for deep space exploration. Acta Astronaut. 189, 63–78. doi:10.1016/j.actaastro.2021.08.020
Manjesh, K., and Manas, D. (2022). Impact of different magnetorheological fluid compositions on poppet valve profile polishing. Precis. Eng. 76, 75–87. doi:10.1016/j.precisioneng.2022.03.002
Rose, N., Niel, C., and Van, S. (2023). Stress distributions of infinite strip steel reinforced elastomeric isolators with a rubber core. Eng. Struct. 285, 215–225. doi:10.1016/j.engstruct.2023.116033
Stamenković, N., and Krstić, I. (2017). Lowpass filters with almost-maximally flat passband and Chebyshev stopband attenuation. Electron. Lett. 53, 25–37. doi:10.1049/el.2017.3390
Su, Y. L., Hou, X. Y., Li, L., Cao, G., Chen, X., Jin, T., et al. (2020). Study on impact energy absorption and adhesion of biomimetic buffer system for space robots. Adv. Space Res. 65, 1353–1366. doi:10.1016/j.asr.2019.12.006
Taherishargh, M., Belova, I. V., Murch, G., and Fiedler, T. (2014). Low-density expanded perlite–aluminium syntactic foam. Mater. Sci. Eng. 604, 127–134. doi:10.1016/j.msea.2014.03.003
Wang, J. W., Zhang, Y. B., and He, Q. (2023). Durable and robust superhydrophobic fluororubber surface fabricated by template method with exceptional thermostability and mechanical stability. Sep. Purif. Technol. 306, 122423–23. doi:10.1016/j.seppur.2022.122423
Wei, X. J., Zhang, J. W., and He, X. H. (2022). Dynamic properties of impact hammer operator and their influence on dynamics of lightweight structures. J. Sound Vib. 529, 19–32. doi:10.1016/j.jsv.2022.116932
Xu, P. C., and Huang, H. D. (2012). Stress wave reflecting attenuation to improve anti-shock capacity by gasket. J. Detect. Control 34, 1–6. doi:10.3969/j.issn.1008-1194.2012.02.001
Zhang, H. (2018). Development of AmmuIlition for the demand and PrOmotiOn of fuze technology. J. Ordnance Equip. Eng. 39, 1–5. doi:10.11809/bqzbgcxb2018.03.001
Keywords: penetration fuze, impact overload, protection, stress wave, rubber pad
Citation: Ding L, Zhang A, Peng J and Li C (2023) The protective performance of rubber pads for penetration fuze. Front. Mater. 10:1284738. doi: 10.3389/fmats.2023.1284738
Received: 29 August 2023; Accepted: 02 October 2023;
Published: 12 October 2023.
Edited by:
Xinmei Xiang, Guangzhou University, ChinaReviewed by:
Hui Guo, Shanghai University of Engineering Sciences, ChinaXingzhe Wang, Lanzhou University, China
Copyright © 2023 Ding, Zhang, Peng and Li. This is an open-access article distributed under the terms of the Creative Commons Attribution License (CC BY). The use, distribution or reproduction in other forums is permitted, provided the original author(s) and the copyright owner(s) are credited and that the original publication in this journal is cited, in accordance with accepted academic practice. No use, distribution or reproduction is permitted which does not comply with these terms.
*Correspondence: Changsheng Li, bGljaGFuZ3NoZW5nMTk4NEAxNjMuY29t