 Liangping Zhao
 Gang Chen1,2
- 1School of Civil Engineering, Henan University of Engineering, Zhengzhou, China
- 2School of Architecture, Building and Civil Engineering, Loughborough University, Loughborough, United Kingdom
- 3School of Civil Engineering, Xuchang University, Xuchang, China
The benefit of steel fiber on the mechanical behaviors of concrete has been well accepted. The flexural behavior of steel fiber reinforced concrete (SFRC) is complicated which depends on many factors, such as matrix properties, fiber material properties, fiber geometries, fiber volume contents, and interface properties. Thus, the investigations on the flexural behavior of SFRC are needed to be expanded. In this study, the effects of fiber type with varying shapes and aspect ratios on the flexural performance of SFRC were investigated. Five steel fibers were adopted in this study: milled fiber (M), corrugated fiber (C) and three hooked fibers with aspect radios of 45 (HA), 55 (HB), and 65 (HC). Two volume fractions (0.4% and 1.0%) of steel fiber and two compressive strengths (normal and high strengths) of matrix were considered. The load-deflection curves, energy absorption capacity and equivalent flexural strength were discussed. The results show that the flexural behavior of SFRC beams reinforced by 1.0% fibers is significantly higher than that of the beams reinforced by 0.4% fibers. Hooked fiber reinforced beams performed the best flexural load-deflection response compared to the beams reinforced by milled fiber and corrugated fiber reinforced, and exhibited an increasing trend of flexural performance as the fiber aspect ratio increased. The differences between specimens with different fibers for high strength matrix are more obvious compared to the normal strength matrix.
1 Introduction
Due to its excellent durability and low cost, concrete is one of the most commonly used building and construction materials (Rashiddadash et al., 2014). However, concrete is also a quasi-brittle material with weak tension, flexure, impact strength, and poor resistance against cracking due to a low strain capacity. The weak tensile behavior of concrete restricts its use in projects where tensile and flexural behaviors are crucial. Different types of fiber are incorporated into the concrete to prepare Fiber Reinforced Concrete (FRC), which helps to enhance the toughness, shrinkage cracking, impact resistance, and durability of concrete (ACI Committee 544, 2018; Tabatabaeian et al., 2017; Liu et al., 2019; Kim and Shin, 2011; Zhang et al., 2023; Zeng et al., 2023a). In order to improve the energy absorption capacity of concrete, many researchers (Banthia and Sappakittipakorn, 2007; Yoo and Yoon, 2014; Chu et al., 2022; Chu et al., 2023b) have conducted studies utilizing a variety of reinforcements, including fibers (such as steel, polymeric, and carbon fibers), fiber-reinforced polymers, steel reinforcing bars, etc. Additionally, the steel fiber can improve the bonding strength between steel bars and matrix, shorten the length required for anchorage and lap of steel bars. This makes it easier and faster to assemble precast concrete components by improving their ability to connect (Chu and Kwan, 2021).
Among those fibers, the steel fiber is one of the most widely and popular used fibers in both practice and research. The benefit of steel fiber on mechanical behaviors of concrete has been well accepted (Ahmed and Ansell, 2010; Meng et al., 2017; Yuan et al., 2018). First, by preventing cracks from forming and spreading, the addition of fibers enhances the non-linear structural behavior of concrete in tension; second, due to their bridging effect, fibers may increase the post-cracking residual strength; and third, due to their debonding and pull-out failure mechanisms, fibers may enhance the concrete toughness (Ding and Kusterle, 2000; Khaloo and Afshari, 2005; Zeng et al., 2023b). As a result, SFRC has a wide-range of application areas, e.g., industrial floors, hydraulic and marine structures, precast products, pavements and overlays, tunnel linings and slope stabilization work, repairing and retrofitting of reinforced concrete structures (Pujadas et al., 2014; Blanco et al., 2016).
The energy absorption capacity of SFRC can be characterized by the simple loading tests such as compression, tension and flexure. The flexural test is more popular and effective, because it is simpler to conduct and closer to the actual conditions in many practical situations than the tension test (Dong et al., 2008). The results of the flexural behavior of SFRC beams under quasi-static and impact loads show that, an improvement in the post-peak behavior was observed by increasing the fiber content. The improvements in residual flexural performance following impact damage were also a result of the increases in fiber content and strength. As concrete strength rose, the flexural strength became less dependent on the strain-rate (Yoo et al., 2015). The flexural behavior of SFRC depends on many factors, such as matrix properties (e.g., matrix strength, Poisson’s ratio, and stiffness), fiber material properties (e.g., fiber strength, Poisson’s ratio, and stiffness), fiber geometry (smooth, crimped, hooked end, twisted, aspect ratio), fiber volume contents, and interface properties (frictional, adhesion, and mechanical bond) (Dong et al., 2011; Gao et al., 2019; Niu et al., 2022; Syed Safdar Raza et al., 2022; Liu et al., 2023). The material, volume content, type and geometry of fiber should be determined carefully to improve the flexural behavior of SFRC (Teng et al., 2018; Zeng et al., 2022).
The volume fraction of steel fiber is one of the most important factors affecting the mechanical properties of FRC. In addition to steel fiber volume fraction, fiber type also has a great influence on flexural behavior. Different types of steel fibers, i.e., straight, hooked-end, and corrugated fibers were found to have beneficial effects on the flexural behavior of concrete (Shin et al., 2021; Anh-Thang and Hoang, 2023). The flexural strengths and post-peak ductility of concrete rise with an increase in the volume fractions for different steel fibers (Christidis et al., 2021). The post-peak behavior of concrete is strongly influenced by the type of steel fibers. The best flexural behavior is generally produced by the hooked-end SFRC. When concrete is reinforced with steel fibers with hooked ends, the deflection-hardening reaction can be observed. On the other side, the deflection-softening response is impacted by the inclusion of straight steel fibers (Pajak and Ponikiewski, 2013; Li et al., 2018a).
The length and aspect ratio of steel fibers also significantly affect the flexural behavior of concrete. The specimen with a low volume proportion of medium-length fibers hybridized with long fibers would exhibit the best flexural performance. When the replacement ratio of short fibers was more than 1.0%, the combined use of long and short fibers degraded the toughness and cracking behavior, whereas the hybrid uses of long and medium-length fibers significantly enhanced these characteristics (Li et al., 2018b; Niu et al., 2021). The use of long and short fibers in combination decreased the fiber bridging capacity, but the use of long and medium-length fibers in combination enhanced it (Doo-Yeol et al., 2017).
At present, although existing literature has studied the effect of steel fibers on the flexural behavior of concrete, their adopted steel fiber types, aspect ratios, dosages are still needed to be extended. Specially, the effect of each factor on flexural behavior was rarely analyzed from the point of view of equivalent flexural strength. In order to further expand the engineering application of steel fibers, the effects of different fibers on the flexural behavior of normal and high strength concretes were investigated in this study. Three types of steel fiber, i.e., milled, corrugated and hooked fiber were considered. Two fiber volume fractions of 0.4% and 1.0%, aspect ratios of 45, 55 and 65 for hooked steel fiber were adopted. Finally, the equivalent flexural strength of those concretes has been fully analyzed and evaluated.
2 Experimental program
2.1 Materials
Five steel fibers shown in Figure 1 were investigated in this study: milled fiber (M), corrugated fiber (C) and three hooked fibers (HA, HB and HC) with aspect ratios of 45, 55, and 65, respectively. The effect of adding steel fiber to concrete is to improve the flexural resistance of concrete, particularly in the post-cracking stage of the load-deflection response. Hooking effect of steel fiber exerts the significant influences on the properties of SFRC. The mechanical anchorage of steel fibers in SFRC is linked to the basic mechanism enhancing the influence of hooked fibers on flexural performance. End hooks of steel fibers could provide a stronger bridging force across the concrete matrix in SFRC (Chu et al., 2023a). The steel fibers produced by Shanghai Realstrong Fiber Co., Ltd. The mechanical properties of steel fibers measured according to GB/T 228.1-2010 (GB/T 228.1-2010, 2010) are provided by the manufacturer and listed in Table 1.
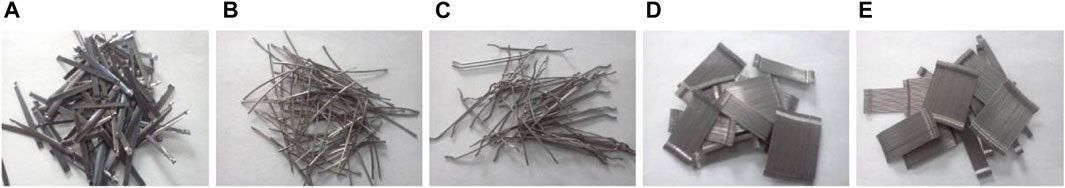
FIGURE 1. Photos of steel fibers: (A) M-fiber; (B) C-fiber; (C) HA-fiber; (D) HB-fiber; (E) HC-fiber.
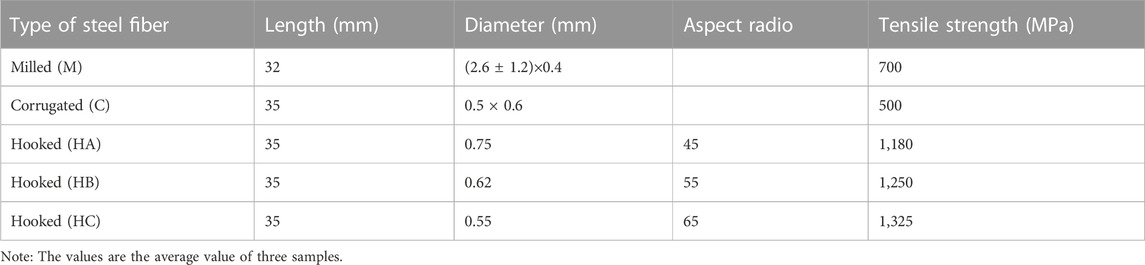
TABLE 1. Properties of steel fibers.
Locally manufactured ordinary Portland cement (PC) 42.5 was utilized as binder. The coarse aggregates are crushed stones with nominal sizes of 10–25 mm. Sieve size distribution of coarse aggregate measured with reference to GB/T 14685-2011 (GB/T 14685-2011, 2011) is shown in Figure 2. The physical properties of coarse aggregate determined according to GB/T 14685-2011 (GB/T 14685-2011, 2011) are shown in Table 2. Natural river sand, with a fineness modulus of 2.64, was used as fine aggregates. Sieve size distribution of natural river sand measured with reference to GB/T 14684-2011 (GB/T 14684-2011, 2011) is shown in Figure 2. A high efficiency water reducer (HWR), type of JKH-1, was used to achieve the required workability of the concrete mixes.
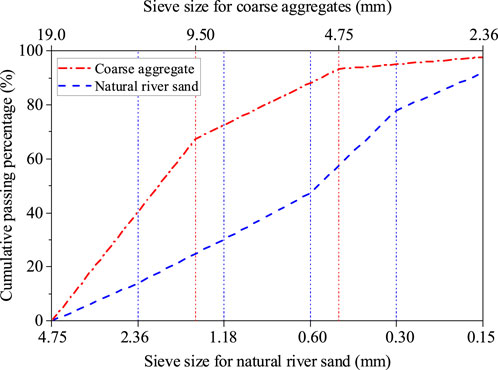
FIGURE 2. Particle size distribution of natural river sand and coarse aggregates.

TABLE 2. Physical properties of coarse aggregate.
2.2 Preparation of specimens
The normal strength concrete with nominal compressive strength of 40 MPa and high strength concrete with nominal compressive strength of 60 MPa (see Table 3) were served as matrix. Five types of fiber with 0.4% and 1.0% volume contents were introduced into the matrix. Thus, a total of twenty series of bending specimens will be tested, as described in Table 4. The series is labeled as matrix strength-fiber type-fiber volume content. For example, the normal strength specimen with 0.4% HB-fibers is labeled as N-HB-0.4. It should be noted that the added steel fibers would significantly reduce the workability of concrete, and result in a poor compaction. Whilst the entanglement of the rigid fibers is definitely one contributing factor, another contributing factor is the loosening of aggregate packing, which increases the volume of voids between aggregate particles to be filled with paste (Chu et al., 2019; Chu, 2021). Considering the influence of the particle packing and the interaction between steel fibers and aggregates, combined with previous mix design experience, the mix proportions of each group of specimens was slightly adjusted based on Table 3.
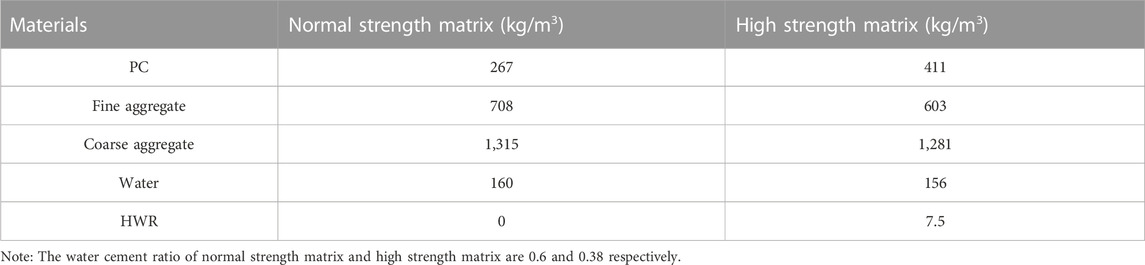
TABLE 3. Mix proportions of concrete matrix.
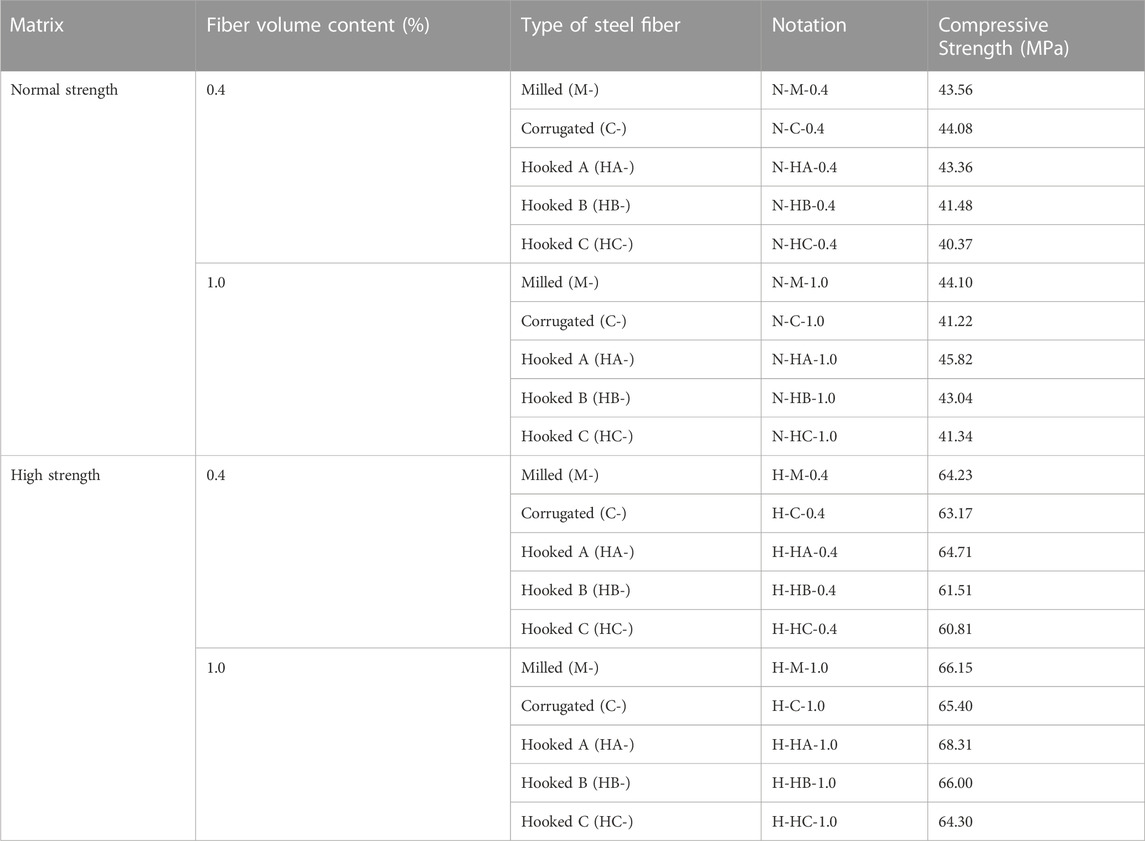
TABLE 4. Compressive strengths of SFRC.
From each mix, three cubes (100 mm × 100 mm × 100 mm) and three beams (100 mm × 100 mm × 400 mm) were cast in steel moulds. These specimens were demoulded after and transferred to a curing chamber maintained at 20°C and 95% relative humidity for 28 days curing before testing. The cubes were tested in compression as per CECS13: 2009 (CECS13, 2009) by using a 3,000 kN load-controlled compression test machine. Only the peak loads were recorded, and converted to compressive strengths by utilizing an elastic analysis. The compressive strengths of all series specimens are given in Table 4.
2.3 Flexural test
The beams (100 mm × 100 mm × 400 mm) were tested for flexural toughness in a modified arrangement as per CECS13: 2009, Figure 3A. As known, during a flexural toughness test, the specimen would be suddenly damaged after the peak load, as the test machine transfers large accumulated energy from specimen to itself. An ordinary test machine cannot absorb so much energy on account of the low stiffness, which results in failure of measuring the descending branch of load-deflection curve. In order to prevent the sudden damage of specimens, four rigid components were installed between the top plate and bottom plate of the test machine, as shown in Figure 3B. With such an arrangement, the rigid components can bear the most energy after the peak load, which ensures the measurement of whole load-deflection curve. During the test, the load and deflection were recorded. A displacement control mode with a loading rate of 0.1 mm/min was adopted for the flexural test. Two Displacement transducers were positioned one at each side of the steel frame to measure the specimen deflection during loading. The results of the measurements from the two LVDTs were averaged.
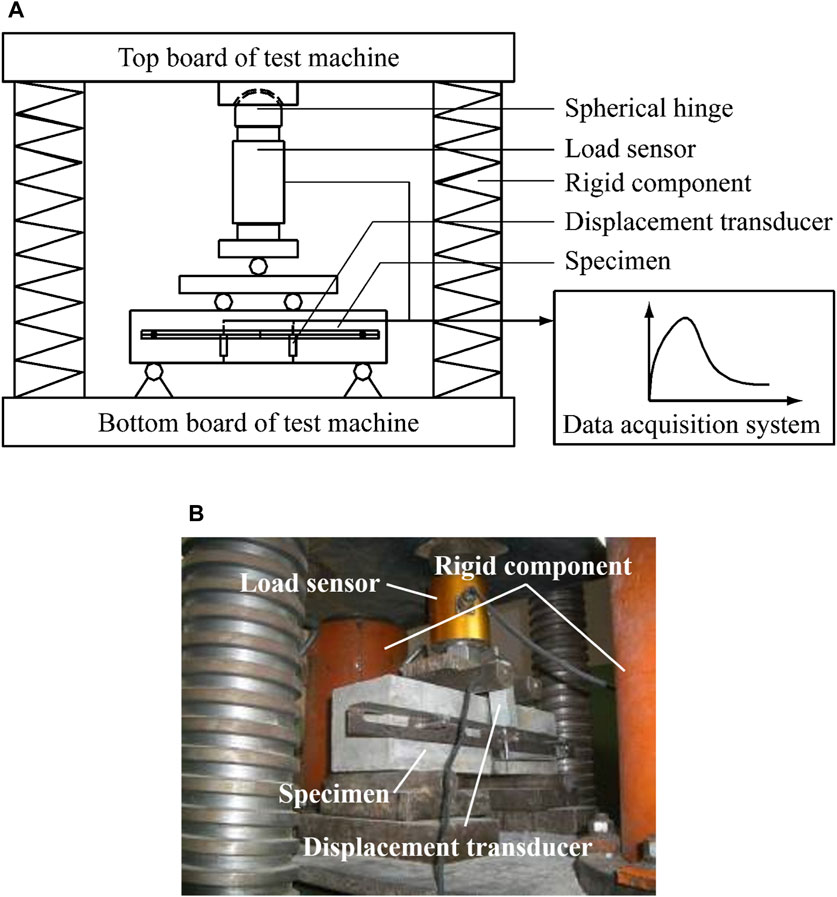
FIGURE 3. Test setup of flexural behavior: (A) schematic representation and (B) photo.
3 Test results and discussion
3.1 Load-deflection curves
The flexural response of all test series, displayed in load-deflection curves, is illustrated in Figure 4. Where, the effect of fiber type is illustrated in Figures 4A, B; while the effect of fiber aspect ratio is illustrated in Figures 4C, D. Each load-deflection curve in the figure is averaged from three or four specimens. The average curve is achieved by Origin software, which had been successfully used by one previous study (Chen et al., 2022).
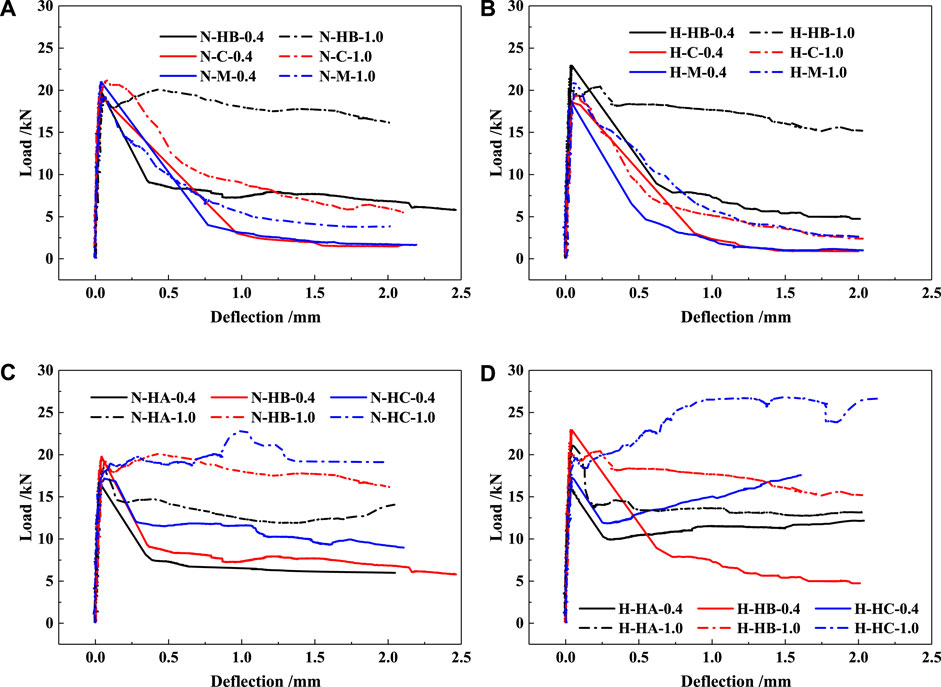
FIGURE 4. Averaged flexural load-deflection curves of (A) normal strength matrix with different fiber types; (B) high strength matrix with different fiber types; (C) normal strength matrix with different fiber aspect ratios; (D) high strength matrix with different fiber aspect ratios.
As illustrated in Figures 4A, B, in comparing the flexural behavior according to the fiber type, HB fiber reinforced specimens generated the best load-deflection response and the highest load carrying capacity both in specimens with 0.4% and 1.0% fibers. All test series specimens with 0.4% fibers exhibited the similar load-deflection response, but HB-0.4 series specimens produced rather higher load carrying capacity compared with C-0.4 and M-0.4 series specimens. The test series specimens with 1.0% fibers exhibited different load-deflection characteristics, since HB-1.0 series specimens produced a significant higher load carrying capacity compared with other series. It should be noted that the load carrying capacity of HB-0.4 series specimens is even higher than that of C-1.0 and M-1.0 series specimens.
It can be seen from Figures 4C, D, as the fiber aspect ratio increases from 45 to 65, most of test series show an increasing trend in load carrying capacity. All test series specimens with 0.4% fibers exhibited a deflection-softening behavior, but HC-0.4 series specimens produced a higher load carrying capacity compared with HB-0.4 and HA-0.4 series. For the series specimens with 1.0% fibers, HC-1.0 series specimens generated a deflection-hardening behavior while HB-1.0 and HA-1.0 series specimens resulted in a deflection-softening response. It is noted that the effect of aspect ratio in high strength matrix is greater than that in normal strength matrix.
3.2 Energy absorption capacity (toughness)
SFRC is known as high energy absorbing materials, which will mitigate the hazards for structures subjected to dynamic loads, such as impact, blast, and seismic. Thus, it is necessary to compare the energy absorption capacity of SFRC for such applications. The effect of fiber type on energy absorption capacity is illustrated by toughness values in Figure 5, while the effect of fiber aspect ratio is illustrated in Figure 6. Detailed information of the energy absorption capacity of SFRC is also documented in Table 5, which give the averaged values of toughness, defined as the area up to a certain deflection under the load-deflection curve.
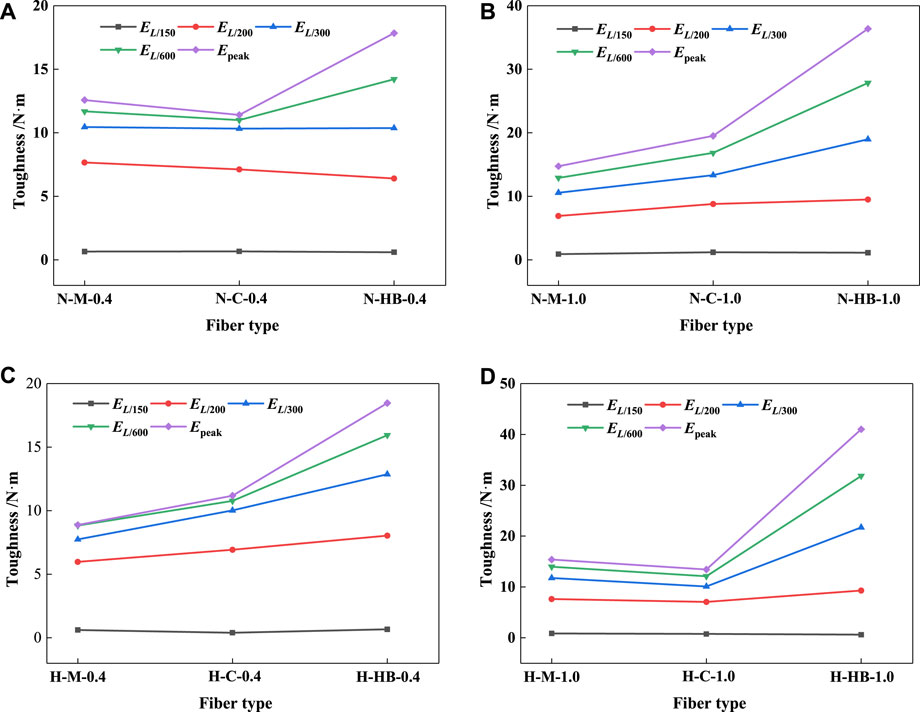
FIGURE 5. Effect of fiber type on toughness for (A) normal strength matrix with 0.4% fibers, (B) normal strength matrix with 1.0% fibers, (C) high strength matrix with 0.4% fibers and (D) high strength matrix with 1.0% fibers.
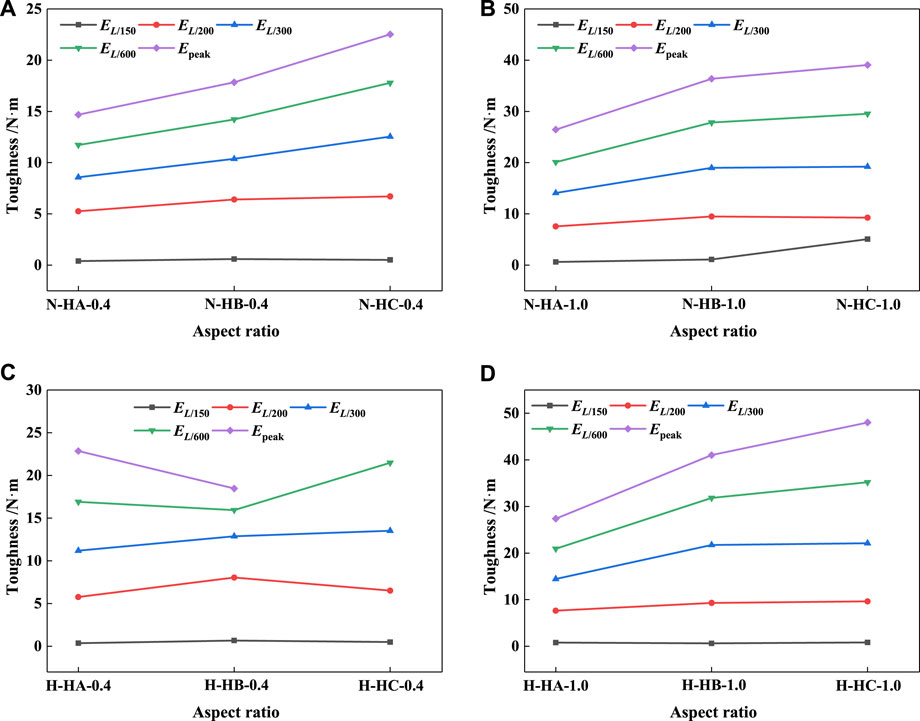
FIGURE 6. Effect of fiber aspect ratio on toughness for (A) normal strength matrix with 0.4% fibers, (B) normal strength matrix with 1.0% fibers, (C) high strength matrix with 0.4% fibers and (D) high strength matrix with 1.0% fibers.
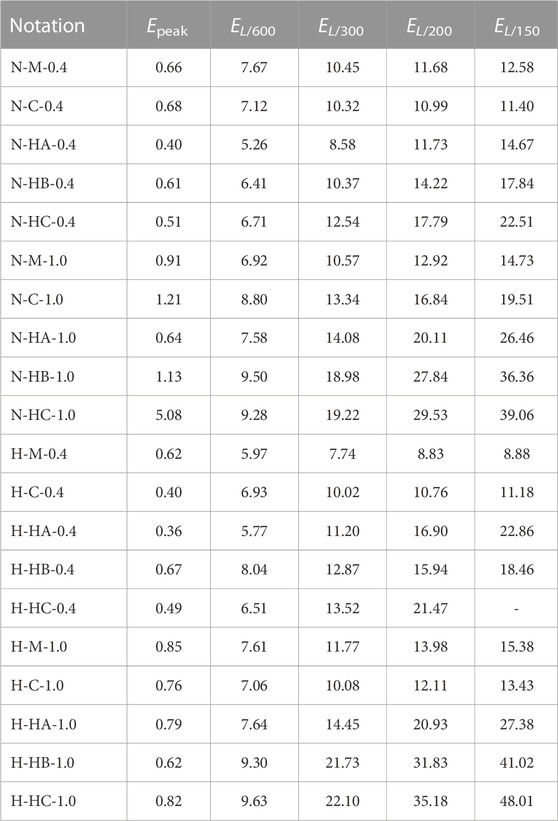
TABLE 5. SFRC toughness (N·m).
A significant difference in energy absorption capacity is noted for the different fiber volume contents studied, thus the different scales are used for the toughness axes of the graphs in Figures 5, 6. As shown in Figure 5A and Table 5, the toughness values of different fiber reinforced specimens at peak point are almost same in all series with 0.4% fibers, since the effect of fiber type on energy absorption capacity is not significant before the peak point. However, as the definitive deflection increase, the noticeable differences among those series start to occur and gradually increase. The HB-fiber provides the highest toughness, while the M and C fibers provide a similar lower toughness. For example, the toughness values at peak point are 0.6594 N·m, 0.6758 N·m and 0.6077 N·m for N-M-0.4, N-C-0.4 and N-HB-0.4, respectively; while the toughness values at point L/150 are increased to 12.5754 N·m, 11.4017 N·m and 17.8386 N·m for N-M-0.4, N-C-0.4 and N-HB-0.4, respectively. In comparison to M- and C- fibers, the end hooks of HB-fibers provide the mechanical interlock during the fiber pullout process in addition to frictional bond for straight fibers. This explains why, on a macro level, using HB-fibers improves flexural toughness. The increased resistance to the pullout load at the micro-scale ultimately led to the enhanced flexural toughness of the specimens in this study (Chu et al).
As shown in Figure 5B, the same general trend can be observed for the specimens with 1.0% fibers. However, the toughness values are rather higher than specimens with 0.4% fibers. Meanwhile, the differences between specimens with different types of fiber are more obvious. The toughness values at peak point are 0.9139 N·m, 1.2058 N·m and 1.1321 N·m for N-M-1.0, N-C-1.0 and N-HB-1.0, respectively; while toughness values at point L/150 are increased to 14.7324 N·m, 19.5144 N·m and 36.3603 N·m for N-M-1.0, N-C-1.0 and N-HB-1.0, respectively.
Figures 5C, D show the effect of fiber type on the toughness of the high strength matrix, the same general trend can be observed for the specimens compare to Figures 5A, B. It is noted that, compared to the normal strength matrix, the differences between the specimens with various fiber types are more remarkable. For example, the EL/150 of H-HB-1.0 is 41.0156 N·m, 2.67 and 3.05 times higher than that of H-M-1.0 and H-C-1.0, respectively; while the EL/150 of N-HB-1.0 is 2.47 and 1.86 times higher than that of N-M-1.0 and N-C-1.0.
As shown in Figure 6 and Table 5, as the fiber aspect ratio increases, the energy absorption capacity of specimens gradually increases, except EL/150 and EL/600 of the high strength matrix with 0.4% fibers. The toughness values of all specimens at peak point are almost the same except the normal strength matrix with 1.0% HC-fibers, since the deflection capacity and energy absorption capacity of H-HC-1.0 increase obviously when compared to other series. As the definitive deflection increases, the differences among those specimens with various fiber aspect ratios gradually increase. For example, (Figure 6B), the Epeak of N-HA-1.0, N-HB-1.0 and N-HC-1.0 are 0.6391 N·m, 1.1321 N·m and 5.0807 N·m, respectively; while the EL/150 of N-HA-1.0, N-HB-1.0 and N-HC-1.0 are 26.4567 N·m, 36.3603 N·m and 39.0589 N·m, respectively. The toughness values of the high strength matrix are higher than that of normal strength matrix, e.g., (Figure 6D) EL/150 of H-HA-1.0, H-HB-1.0 and H-HC-1.0 are 27.3772 N·m, 41.0156 N·m and 48.0129 N·m, respectively. The length of HC-fiber is larger, the adhesion between HC-fiber and matrix is stronger, and fiber pulling out needs more energy. Thus the toughness of HC-series is better than that of HA- and HB-series.
3.3 Flexural parameters of SFRC
In this study, five characteristic points in flexural load-deflection curves of SFRC are adopted to analyze the flexural behavior of SFRC, as shown in Figure 7. The first peak point is defined as a point where the slope is zero, L/600 and L/150 (where ‘L’ is the span of the beam) recommended by ASTM standard C 1609/C 1609M-05 (ASTM C1609, 2012). L/300 and L/200 are additionally recommended in this study since the three points including the first peak point, L/600 and L/150 are not enough to describe the flexural behavior of SFRC at serviceability. The load at the peak point is notated as Ppeak, while that at the other points are notated as PL/m, m is selected as 600, 300, 200 and 150 in this study, and the corresponding deflections (deflection capacity) are notated as
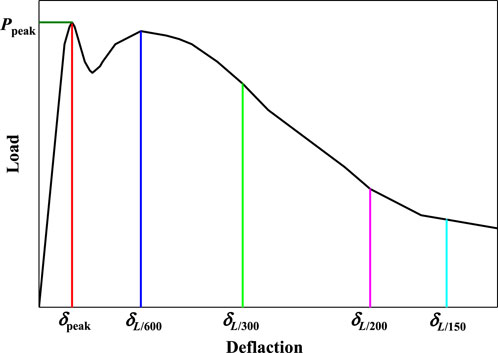
FIGURE 7. Typical flexural load-deflection curves of SFRC.
Several parameters are used to describe the flexural behavior of SFRC with different fibers. The flexural toughness (energy absorption capacity), which is equivalent to the area under the load-deflection curve up to
The equivalent flexural strength at
where, L (in mm) is the span length of specimen under test; b (in mm) is the width of the specimen; h (in mm) is the height of the specimen; Ppeak (in N) is the load at the peak point.
fL/m can be calculated by using the equivalent flexural strength method, which provides a more significant characterization scheme for FRC (Gao et al., 2014; JG/T 472-2015, 2015). This method locates the first peak point and divides the load-deflection curve into two regions: pre-peak and post-peak. As
where,
Although the computing method of fL/m is in fact according to the PCS method, it should be noted that the notations of the parameters in Eq. 2 are quite different to the PCS method.
3.4 Equivalent flexural strength
The effect of fiber type on equivalent flexural strength is illustrated in Figure 8, while the effect of fiber aspect ratio is illustrated in Figure 9. Table 6 documents the detailed information of equivalent flexural strength. Five deflection points (peak, L/600, L/300, L/200 and L/150) are selected from the load-deflection curves as previously explained. fpeak is calculated from the flexural load at the peak point by using Eq. 1, while fL/m is calculated from the flexural loads at different deflection points (L/600, L/300, L/200 and L/150) using Eq. 2.
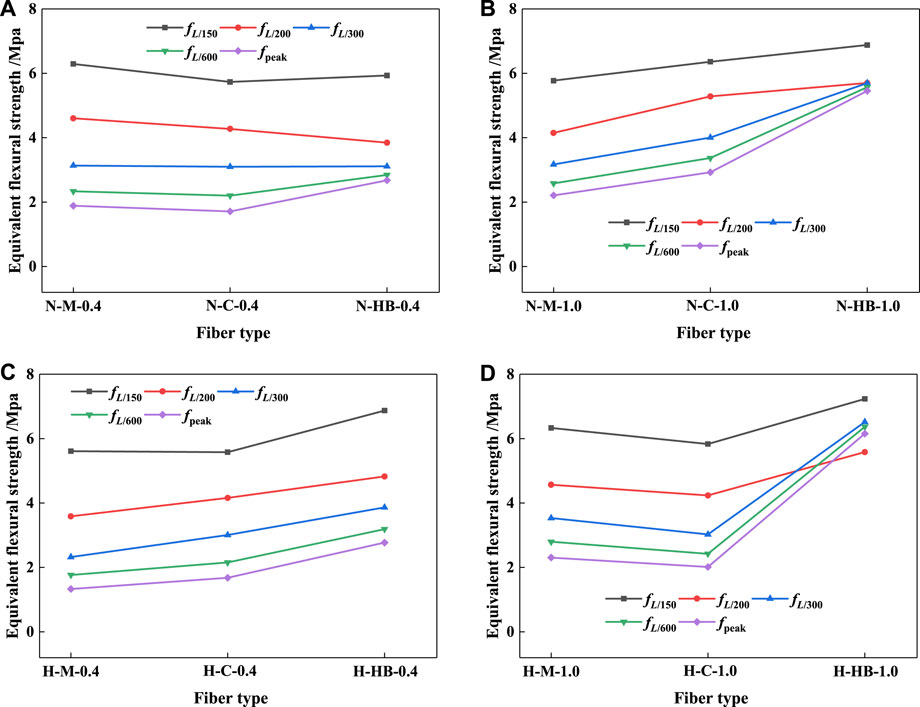
FIGURE 8. Effect of fiber type on equivalent flexural strength for (A) normal strength matrix with 0.4% fibers; (B) normal strength matrix with 1.0% fibers; (C) high strength matrix with 0.4% fibers; (D) high strength matrix with 1.0% fibers.
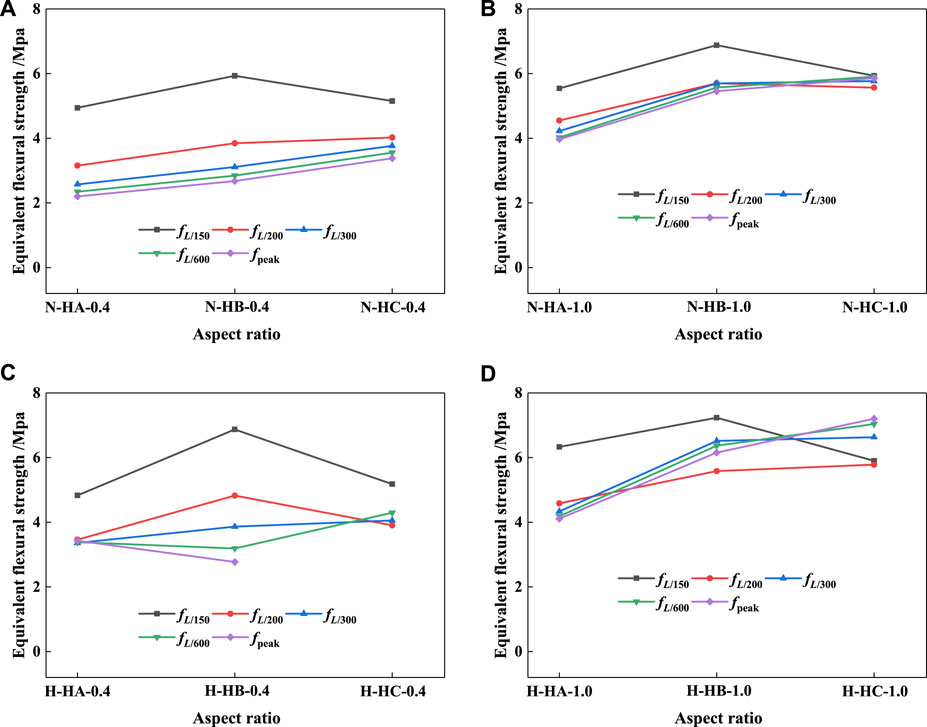
FIGURE 9. Effect of fiber aspect ratio on equivalent flexural strength for (A) normal strength matrix with 0.4% fibers; (B) normal strength matrix with 1.0% fibers; (C) high strength matrix with 0.4% fibers; (D) high strength matrix with 1.0% fibers.
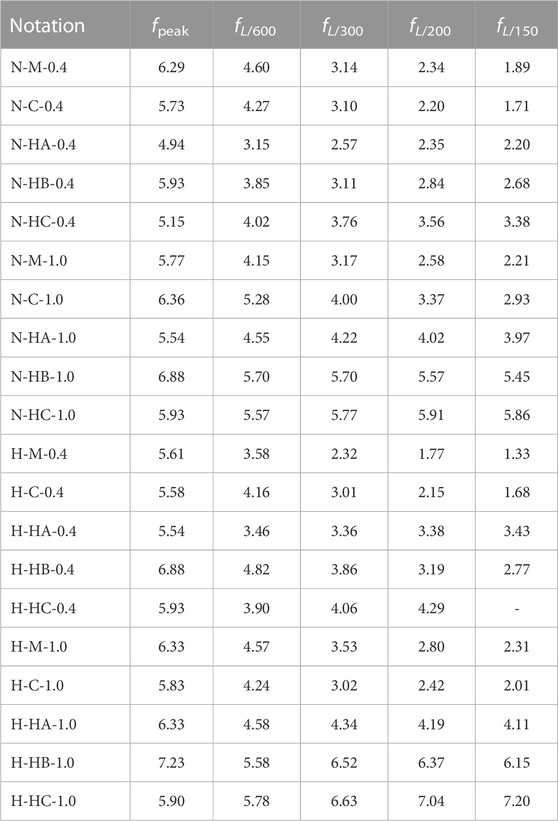
TABLE 6. Equivalent flexural strength of SFRC (MPa).
Figure 8A shows the effect of fiber type on equivalent flexural strength of the normal strength matrix with 0.4% fibers; while Figure 8B shows the equivalent flexural strength of the normal strength matrix with 1.0% fibers. The same arrangement is used for the series of the high strength matrix in Figures 8C, D.
As shown in Figure 8A, the order of equivalent flexural strength among test series with 0.4% fibers is as follows: fpeak > fL/600 > fL/300 > fL/200 > fL/150, which indicates the load resistance of SFRC is reduced as the deflection increases. The effect of fiber type on equivalent flexural strength is insignificant for the series with 0.4% fibers, only fL/200 and fL/150 of HB-series have a higher value than that of M- and C- series. For example, the fL/150 of N-M-0.4, N-C-0.4 and N-HB-0.4 are 1.8863 MPa, 1.7103 MPa and 2.6758 MPa, respectively.
In Figure 8B, the order of equivalent flexural strength among test series with 1.0% fibers is still as follows: fpeak > fL/600 > fL/300 > fL/200 > fL/150. However, since the load resistance of N-HB-1.0 is mildly reduced after the peak point, the difference of fL/m for HB-series is minor. The fpeak, fL/600, fL/300, fL/200 and fL/150 of N-HB-1.0 are 6.877 MPa, 5.6993 MPa, 5.6954 MPa, 5.5671 MPa and 5.4540 MPa, respectively. A significant difference in equivalent flexural strength is noted for the test series with different types of 1.0% fibers. Their order is as follows: HB- > C- > M-fibers. For example, the fL/150 are 2.2099 MPa, 2.9272 MPa and 5.4540 MPa for N-M-1.0, N-C-1.0 and N-HB-1.0, respectively.
The same general trend can be observed from Figures 8C,D for the high strength matrix. It is noted that, with different types of fiber, the differences among those high strength specimens are more notable compare to that among those normal strength specimens. For example, the fL/150 are 1.3319 MPa, 1.6773 MPa and 2.7695 MPa for H-M-0.4, H-C-0.4 and H-HB-0.4, respectively; while the fL/150 are 2.3072 MPa, 2.0149 MPa and 6.1523 MPa for H-M-1.0, H-C-1.0 and H-HB-1.0, respectively.
Figure 9A shows the effect of fiber aspect ratio on the equivalent flexural strength of normal strength matrix with 0.4% fibers; while Figure 9B shows the equivalent flexural strength of normal strength matrix with 1.0% fibers. The same arrangement is used for the series of high strength matrix in Figures 9C, D.
As shown in Figure 9A, the HB-fiber provides the highest fpeak for the test series with 0.4% fibers, while the HC-fiber provides the highest fL/m. The difference of fL/m is not notable, which indicates that the fiber aspect ratio has less effect on fL/m than fiber type. For example, the fL/600, fL/300, fL/200 and fL/150 of N-HC-0.4 are 4.0246 MPa, 3.7622 MPa, 3.5571 MPa and 3.3771 MPa, respectively. The same general trend for the specimens with 1.0% fibers can be observed from Figure 9B, and the difference of fL/m is less than that with 0.4% fibers. For example, fL/600, fL/300, fL/200 and fL/150 of N-HC-1.0 are 5.5663 MPa, 5.7663 MPa, 5.9059 MPa and 5.8588 MPa, respectively. Similar general trend can be observed from Figures 9C, D for the high strength matrix. It is noted that the range of fL/m is wide for the test series of H-HB-0.4. The fpeak, fL/600, fL/300, fL/200 and fL/150 are 6.877 MPa, 4.8228 MPa, 3.8613 MPa, 3.1888 MPa and 2.7695 MPa, respectively.
4 Conclusion
This study investigated the influence of fiber type and aspect ratio on the flexural performance of Steel Fiber Reinforced Concrete (SFRC) with two volume fraction contents (0.4% and 1.0%) in different matrix (normal and high strength). The five steel fibers were milled fiber (M), corrugated fiber (C), three hooked fibers (HA, HB and HC) with aspect ratios of 45, 55, and 65, respectively. The SFRC produced the different load-deflection curves according to the varying fiber types and aspect ratios. The following conclusions can be drawn from the experimental study conducted. Through the comparison of flexural behavior of SFRC with M, C, and HB fibers, the influence of fiber type on the flexural performance was analyzed; while the influence of fiber aspect ratio was analyzed by using SFRC with HA, HB, and HC fibers. This study can provide reference for engineering applications under complex stress states with high anti-cracking requirements. Additionally, the findings of this study can serve as a foundation for the application of steel fibers in both normal- and high -strength concrete.
(1) The hooked steel fiber reinforced specimens generated the best load-deflection responses than milled steel fiber and corrugated steel fiber. The post-peak ductility of hooked steel fiber reinforced concrete shows an increasing trend as the fiber aspect ratio increases. The deflection-hardening behavior of SFRC with 1.0% HC-fibers can be observed, while other SFRC performed a deflection-softening response.
(2) The energy absorption capacity of specimens with 1.0% fibers was significantly higher than that with 0.4% fibers. The Epeak of all test series are similar. The order of EL/m based on fiber type is observed to be as follows: HB-fibers > C-fibers > M-fibers. The EL/150 of high strength concrete with 1.0% HB-fibers is 2.67 and 3.05 times higher than that with 1.0% M-and C-fibers, respectively. The EL/150 of normal strength concrete with 1.0% HB-fibers is 2.47 and 1.86 times higher than that with 1.0% M-and C-fibers, respectively. The order of EL/m based on fiber aspect ratio is as follows: HC-fibers > HB-fibers > HA-fibers. The EL/150 of high strength concrete with 1.0% HC-fibers is 1.75 and 1.17 times higher than that with 1.0% HA-and HB-fibers, respectively. The EL/150 of normal strength concrete with 1.0% HC-fibers is 1.48 and 1.07 times higher than that with 1.0% HA-and HB-fibers, respectively.
(3) The effect of fiber type on equivalent flexural strength for test series with 0.4% fibers is less than that with 1.0% fibers. The order of fL/m based on fiber type is observed to be as follows: HB-fiber > C-fiber > M-fiber. The HB-fiber provides highest the fpeak for test series with different fiber aspect ratios, while the HC-fiber provides the highest fL/m.
(4) The different effects of fiber type and aspect ratio on flexural behavior of concrete are more obvious in high strength concrete than in low strength concrete.
Data availability statement
The raw data supporting the conclusion of this article will be made available by the authors, without undue reservation.
Author contributions
LZ: Conceptualization, Investigation, Project administration, Supervision, Writing–original draft. GC: Formal Analysis, Writing–review and editing. CH: Investigation, Methodology, Writing–review and editing.
Funding
The author(s) declare financial support was received for the research, authorship, and/or publication of this article. Financial support from National Natural Science Foundation of China (Grant Nos. 51908196 and 51809085) and Foundation of Henan Educational Committee (Project Nos. 202102310245 and 202102310254) is gratefully acknowledged.
Conflict of interest
The authors declare that the research was conducted in the absence of any commercial or financial relationships that could be construed as a potential conflict of interest.
Publisher’s note
All claims expressed in this article are solely those of the authors and do not necessarily represent those of their affiliated organizations, or those of the publisher, the editors and the reviewers. Any product that may be evaluated in this article, or claim that may be made by its manufacturer, is not guaranteed or endorsed by the publisher.
References
Ahmed, L., and Ansell, A. (2010). Direct shear strength of high-strength fibre concrete. Mag. Concr. Res. 62, 379–390. doi:10.1680/macr.2010.62.5.379
Anh-Thang, Le, and Hoang, An Le (2023). Comparisons of flexural, split tensile, double punch, and direct tension tests on high-performance concrete reinforced with different fiber types. Case Stud. Constr. Mater. 19, e02413. doi:10.1016/j.cscm.2023.e02413
ASTM C1609 (2012). Standard test method for flexural performance of fiber reinforced concrete (using beam with third-point loading). West Conshohocken, PA: ASTM International.
Banthia, N., and Sappakittipakorn, M. (2007). Toughness enhancement in steel fiber reinforced concrete through fiber hybridization. Cem. Concr. Res. 37 (9), 1366–1372. doi:10.1016/j.cemconres.2007.05.005
Blanco, A., Pujadas, P., De la Fuente, A., Cavalaro, S. H. P., and Aguado, A. (2016). Influence of the type of fiber on the structural response and design of FRC slabs. J. Struct. Eng. 142 (9), 04016054. doi:10.1061/(asce)st.1943-541x.0001515
CECS13 (2009). Standard test methods for fiber reinforced concrete. Beijing: Standards Press of China.
Chen, G., Zhao, L., Gao, D., Yuan, J., Bai, J., and Wang, W. (2022). Flexural tensile behavior of single and novel multiple hooked-end steel fiber–reinforced notched concrete beams. J. Mater. Civ. Eng. 34 (6), 04022077. doi:10.1061/(asce)mt.1943-5533.0004214
Christidis, K. I., Badogiannis, E. G., and Mintzoli, C. (2021). Flexural behaviour of pumice lightweight concrete reinforced with end-hooked steel fibres. Struct 33, 3835–3847. doi:10.1016/j.istruc.2021.06.090
Chu, S. H. (2021). Development of infilled cementitious composites (ICC). Compos. Struct. 267, 113885. doi:10.1016/j.compstruct.2021.113885
Chu, S. H., Jiang, Y., and Kwan, A. K. H. (2019). Effect of rigid fibres on aggregate packing. Constr. Build. Mater. 224, 326–335. doi:10.1016/j.conbuildmat.2019.07.072
Chu, S. H., Khan, M., Deng, X., and Unluer, C. (2022). Bio-inspired self-prestressing concrete (SPC) involving basalt fibers and expansive agent. Cem. Concr. Res. 155, 106735. doi:10.1016/j.cemconres.2022.106735
Chu, S. H., and Kwan, A. K. H. (2021). Crack mitigation utilizing enhanced bond of rebars in SFRC. Struct 33, 4141–4147. doi:10.1016/j.istruc.2021.06.095
Chu, S. H., Sneed, L., Yoo, D. Y., and Kwan, A. K. H. (2023a). Hooking effect on flexural strength and toughness of steel fiber reinforced concrete (SFRC) beam. ACI. Mater. J. M-2022-359.R1.
Chu, S. H., Wang, J. Q., and Kwan, A. K. H. (2023b). Flexural strength and toughness of self-leveling UHPFRC. Compos. Struct. 315, 116921. doi:10.1016/j.compstruct.2023.116921
Ding, Y., and Kusterle, W. (2000). Compressive stress–strain relationship of steel fibre reinforced concrete at early age. Cem. Concr. Res. 30 (10), 1573–1579. doi:10.1016/s0008-8846(00)00348-3
Dong, J. K., Naaman, A. E., and El-Tawil, S. (2008). Comparative flexural behavior of four fiber reinforced cementitious composites. Cem. Concr. Compos. 30, 917–928. doi:10.1016/j.cemconcomp.2008.08.002
Dong, J. K., Seung, H. P., Ryu, G. S., and Koh, K. T. (2011). Comparative flexural behavior of hybrid ultra high performance fiber reinforced concrete with different macro fibers. Constr. Build. Mater. 25, 4144–4155. doi:10.1016/j.conbuildmat.2011.04.051
Doo-Yeol, Y., Kim, S.-W., and Park, J.-J. (2017). Comparative flexural behavior of ultra-high-performance concrete reinforced with hybrid straight steel fibers. Constr. Build. Mater. 132, 219–229. doi:10.1016/j.conbuildmat.2016.11.104
Gao, D., Jing, J., Chen, G., and Yang, L. (2019). Experimental investigation on flexural behavior of hybrid fibers reinforced recycled brick aggregates concrete. Constr. Build. Mater. 227, 116652. doi:10.1016/j.conbuildmat.2019.08.033
Gao, D., Zhao, L., and Zhao, S. (2014). Flexural toughness and it’s evaluation method of steel fiber reinforced concrete. J. Build. Mater. 17 (5), 783–789. doi:10.3969/j.issn.1007-9629.2014.05.006
GB/T 228.1-2010 2010 Metallic materials—tensile testing—Part 1: method of test at room temperature. Beijing: Standards Press of China.
Khaloo, A. R., and Afshari, M. (2005). Flexural behaviour of small steel fibre reinforced concrete slabs. Cem. Concr. Compos. 27 (1), 141–149. doi:10.1016/j.cemconcomp.2004.03.004
Kim, H., and Shin, Y. (2011). Flexural behavior of reinforced concrete (RC) beams retrofitted with hybrid fiber reinforced polymers (FRPs) under sustaining loads. Compos. Struct. 93 (2), 802–811. doi:10.1016/j.compstruct.2010.07.013
Li, B., Xu, L., Shi, Y., Chi, Y., and Liu, Q. (2018b). Effects of fiber type, volume fraction and aspect ratio on the flexural and acoustic emission behaviors of steel fiber reinforced concrete. Constr. Build. Mater. 181, 474–486. doi:10.1016/j.conbuildmat.2018.06.065
Li, B., Yin, C., Xu, L., and Shi, Y. (2018a). Experimental investigation on the flexural behavior of steel-polypropylene hybrid fiber reinforced concrete. Constr. Build. Mater. 191, 80–94. doi:10.1016/j.conbuildmat.2018.09.202
Liu, F., Ding, W., and Qiao, Y. (2019). An experimental investigation on the integral waterproofing capacity of polypropylene fiber concrete with fly ash and slag powder. Constr. Build. Mater. 212, 675–686. doi:10.1016/j.conbuildmat.2019.04.027
Liu, F., Ding, W., Qiao, Y., and Li, J. (2023). Flexural fatigue behavior of hybrid steel-polypropylene fiber reinforced high-strength lightweight aggregate concrete. Constr. Build. Mater. 377, 131079. doi:10.1016/j.conbuildmat.2023.131079
Meng, W., Yao, Y., Mobasher, B., and Khayat, K. H. (2017). Effects of loading rate and notch-to-depth ratio of notched beams on flexural performance of ultra-high-performance concrete. Cem. Concr. Compos. 83, 349–359. doi:10.1016/j.cemconcomp.2017.07.026
Niu, Y., Huang, H., Wei, J., Jiao, C., and Miao, Q. (2022). Investigation of fatigue crack propagation behavior in steel fiber-reinforced ultra-high-performance concrete (UHPC) under cyclic flexural loading. Compos. Struct. 282, 115126. doi:10.1016/j.compstruct.2021.115126
Niu, Y., Wei, J., and Jiao, C. (2021). Crack propagation behavior of ultra-high-performance concrete (UHPC) reinforced with hybrid steel fibers under flexural loading. Constr. Build. Mater. 294, 123510. doi:10.1016/j.conbuildmat.2021.123510
Pajak, M., and Ponikiewski, T. (2013). Flexural behavior of self-compacting concrete reinforced with different types of steel fibers. Constr. Build. Mater. 47, 397–408. doi:10.1016/j.conbuildmat.2013.05.072
Pujadas, P., Blanco, A., Cavalaro, S., and Aguado, A. (2014). Plastic fibres as the only reinforcement for flat suspended slabs: experimental investigation and numerical simulation. Constr. Build. Mater. 57, 92–104. doi:10.1016/j.conbuildmat.2014.01.082
Rashiddadash, P., Ramezanianpour, A. A., and Mahdikhani, M. (2014). Experimental investigation on flexural toughness of hybrid fiber reinforced concrete (HFRC) containing metakaolin and pumice. Constr. Build. Mater. 51, 313–320. doi:10.1016/j.conbuildmat.2013.10.087
Shin, H.-Oh, Kim, K., Oh, T., and Yoo, D. Y. (2021). Effects of fiber type and specimen thickness on flexural behavior of ultra-high-performance fiber-reinforced concrete subjected to uniaxial and biaxial stresses. Case Stud. Constr. Mater. 15, e00726. doi:10.1016/j.cscm.2021.e00726
Syed Safdar, R, Ali, B., Noman, M., Fahad, M., and Mohamed Elhadi, K. (2022). Mechanical properties, flexural behavior, and chloride permeability of high-performance steel fiber-reinforced concrete (SFRC) modified with rice husk ash and micro-silica. Constr. Build. Mater. 359, 129520. doi:10.1016/j.conbuildmat.2022.129520
Tabatabaeian, M., Khaloo, A., Joshaghani, A., and Hajibandeh, E. (2017). Experimental investigation on effects of hybrid fibers on rheological, mechanical, and durability properties of high-strength SCC. Constr. Build. Mater. 147, 497–509. doi:10.1016/j.conbuildmat.2017.04.181
Teng, S., Afroughsabet, V., and Claudia, P. (2018). Flexural behavior and durability properties of high performance hybrid-fiber-reinforced concrete. Build. Mater. 182, 504–515. doi:10.1016/j.conbuildmat.2018.06.158
Yoo, D. Y., and Yoon, Y. S. (2014). Influence of steel fibers and fiber reinforced polymers on the impact resistance of one-way concrete slabs. J. Compos. Mater. 48 (6), 695–706. doi:10.1177/0021998313477167
Yoo, D. Y., Yoon, Y. S., and Banthia, N. (2015). Flexural response of steel-fiber-reinforced concrete beams: effects of strength, fiber content, and strain-rate. Cem. Concr. Compos. 64, 84–92. doi:10.1016/j.cemconcomp.2015.10.001
Yuan, C., Chen, W., Pham, T. M., and Hao, H. (2018). Bond behavior between basalt fibres reinforced polymer sheets and steel fibres reinforced concrete. Eng. Struct. 176, 812–824. doi:10.1016/j.engstruct.2018.09.052
Zeng, J. J., Chen, S. P., Feng, P., Zhuge, Y., Peng, K. D., Dai, J. G., et al. (2023b). FRP bar-reinforced ultra-high-performance concrete plates with a grouting sleeve connection: development and flexural behavior. Eng. Struct. 287, 116164. doi:10.1016/j.engstruct.2023.116164
Zeng, J. J., Wang, J. S., Ouyang, Y., Zhuge, Y., Liao, J., Long, Y. L., et al. (2023a). Tri-axial compressive behavior of expansive concrete and steel fiber-reinforced expansive concrete. J. Build. Eng. 68, 106026. doi:10.1016/j.jobe.2023.106026
Zeng, J. J., Zeng, W. B., Ye, Y.-Yi, Liao, J., Zhuge, Y., and Fan, T. H. (2022). Flexural behavior of FRP grid reinforced ultra-high-performance concrete composite plates with different types of fibers. Eng. Struct. 272, 115020. doi:10.1016/j.engstruct.2022.115020
Zhang, H., Kumar Sarker, P., Wang, Q., He, B., Chandra Kuri, J., and Jiang, Z. (2023). Comparison of compressive, flexural, and temperature-induced ductility behaviours of steel-PVA hybrid fibre reinforced OPC and geopolymer concretes after high temperatures exposure. Constr. Build. Mater. 399, 132560. doi:10.1016/j.conbuildmat.2023.132560
Keywords: flexural behavior, load-deflection curves, fiber type, fiber aspect ratio, toughness, equivalent flexural strength
Citation: Zhao L, Chen G and Huang C (2023) Experimental investigation on the flexural behavior of concrete reinforced by various types of steel fibers. Front. Mater. 10:1301647. doi: 10.3389/fmats.2023.1301647
Received: 25 September 2023; Accepted: 16 November 2023;
Published: 30 November 2023.
Edited by:
S. H. Chu, Columbia University, United StatesReviewed by:
Peng Zhang, Zhengzhou University, ChinaJun-Jie Zeng, Guangdong University of Technology, China
Xi Chen, The Chinese University of Hong Kong, China
Copyright © 2023 Zhao, Chen and Huang. This is an open-access article distributed under the terms of the Creative Commons Attribution License (CC BY). The use, distribution or reproduction in other forums is permitted, provided the original author(s) and the copyright owner(s) are credited and that the original publication in this journal is cited, in accordance with accepted academic practice. No use, distribution or reproduction is permitted which does not comply with these terms.
*Correspondence: Liangping Zhao, bHB6aGFvQGhhdWUuZWR1LmNu