 Shah M. Limon1
 Ahasan Habib
- 1Department of Physics and Engineering, Slippery Rock University of Pennsylvania, Slippery Rock, PA, United States
- 2Keene State College, TDS Center, Keene, NH, United States
- 3Manufacturing and Mechanical Engineering Technology, Rochester Institute of Technology, Rochester, NY, United States
Three Dimensional (3D) bioprinting holds great promise for tissue and organ regeneration due to its inherent capability to deposit biocompatible materials containing live cells in precise locations. Extrusion-based 3D bioprinting (EBP) method stands out for its ability to achieve a higher cell release rate, ensuring both external and internal scaffold structures. The systematic adjustment of key process parameters of EBP, including nozzle diameter, printing speed, print distance, extrusion pressure, material fraction, and viscosity allows for precise control over filament dimensions, ultimately shaping the desired scaffold porosity as per user specifications. However, managing these factors with all possible interactions simultaneously to achieve the desired filament width can be intricate and resource intensive. This study presents a novel framework designed to construct a predictive model for the filament width of 3D bioprinted scaffolds for various process parameters. A total of 157 experiments have been conducted under various combinations of process parameters and biomaterial’s weight fraction for this study purpose. A regression-based machine learning approach is employed to develop the predictive model utilizing Adj. R2, Mallow’s Cp, and Bayesian Information Criterion (BIC). Following model development, rigorous experimental validations are conducted to assess the accuracy and reliability of the model. Based on the cross-validation of randomly split test data, Adj. R2 model emerges as the highest performing machine learning model (Mean Squared Error, MSE = 0.0816) compared to Mallow’s Cp and BIC (MSE = 0.0841 and 0.0877, respectively) models. The comparative analysis results between the experimental and model’s data demonstrate that our predictive model achieves an accuracy of approximately 85% in filament width prediction. This framework presents a significant advancement in the precise control and optimization of 3D bioprinted scaffold fabrication, offering valuable insights for the advancement of tissue engineering and regenerative medicine applications.
1 Introduction
The field of tissue engineering has witnessed significant advancements in recent years, with bio-printing emerging as a promising technology for the creation of three-dimensional (3D) tissue scaffolds. This innovative approach utilizes a 3D printing process to construct intricate tissue structures. Various bio-printing techniques have been developed, such as inkjet, extrusion-based, and laser-assisted methods (Murphy and Atala, 2014; He et al., 2016). Among these techniques, extrusion-based bio-printing stands out due to its exceptional versatility, enabling the deposition of a diverse range of bio-inks made out of various hydrogels and living cells (Hölzl et al., 2016; Ji and Guvendiren, 2017). By carefully adjusting the printing parameters, it is possible to extrude both acellular biomaterials (Almeida et al., 2014; Li et al., 2017) and cell-laden bio-inks (Chung et al., 2013; Tabriz et al., 2015), facilitating the formation of scaffold structures. Remarkably, this straightforward technology has achieved impressive outcomes, with good cell survival rates exceeding 80% and the attainment of desired cell densities (Jia et al., 2014; Ouyang et al., 2016). These achievements demonstrate the potential of extrusion-based bioprinting as a powerful and accessible tool in tissue engineering.
The selection of biomaterials such as alginate, gelatin, chitosan, collagen, and fibrin, as well as synthetic polymers such as polycaprolactone (PCL), polyethylene glycol (PEG), and polylactic acid (PLA) and their rheological and mechanical properties significantly impact the printability, shape fidelity, and cell functionality of 3D bioprinted scaffolds (Ozbolat et al., 2012; Han et al., 2015; Gottipati and Elder, 2017). Layer-upon-layer fashion material extrusion with proper printability and defined shape fidelity can confirm precise pore size, geometry, and porosity (Ribeiro et al., 2017). Figures 1B, C clearly show how a filament without shape fidelity can hamper the pore geometry and overall porosity of 3D printed scaffold. Specifically, the first condition of achieving a complete pore is to ensure a continuous filament release as shown in Figure 1B. The porosity will be defined by the filament-to-filament distance for a bi-layer scaffold. Therefore, a scaffold with variable filament-to-filament distance is depicted in Figure 1B-iii to clearly indicate the influence of this distance on porosity. For a multi-layered scaffold, the porosity will be defined combinedly by the distance and straightness of filament for subsequent layers as shown in Figure 1C. Filament will lack of straightness can create uncontrolled porosity (Figure 1C-ii) compared to the controlled porosity created by straight filament as shown in Figure 1C-i. We also highlighted the importance of resolution of nozzle diameter used to control the filament width and consequently to control the porosity in our earlier published work (Habib et al., 2024).
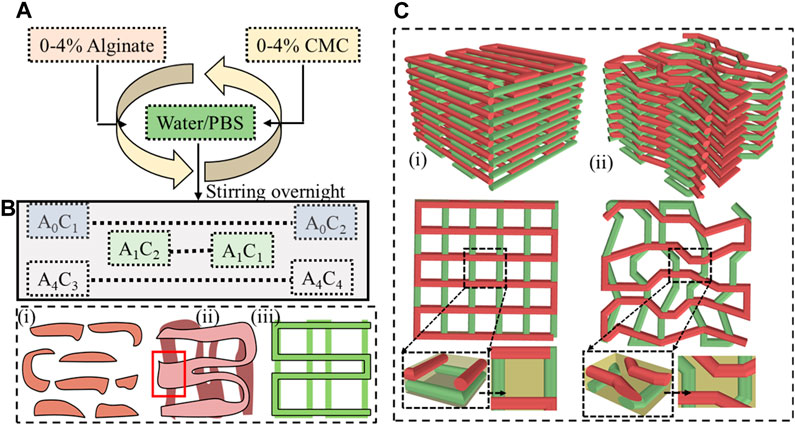
FIGURE 1. (A) Preparing hybrid hydrogel by mixing 0%–4% (w/v) alginate and 0%–4% (w/v) CMC and (B) Filament geometry Various deposition scenarios: (i) discontinuous filament for under deposition, (ii) under defined pore geometry for over-deposition, and (iii) defined pore geometry for ideal or proper deposition, and (C) 3D scaffold fabricated following a (i) proper pore geometry, (ii) improper pore geometry.
Precise control over pore size, porosity, and interconnectivity is crucial to mimic the in-vivo microenvironment and promote tissue formation (Murphy et al., 2010; Perez and Mestres, 2016; Rahman, 2022). However, challenges arise in achieving defined fidelity between designed and manufactured scaffolds in extrusion-based bioprinting due to rheological properties and process parameters, affecting shape accuracy, mechanical integrity, and cell growth (Khoda et al., 2011). The rheology of bio-ink is primarily determined by its viscoelastic and shear behavior, which are influenced by ink formulation components and concentration (Schuurman et al., 2013; Chimene et al., 2016). The extrudability and extrusion uniformity of the bioink also contribute to printability. Additionally, modifiable functions of the 3D printer, such as bio-ink reservoir temperature, extrusion pressure, nozzle diameter and type (flat or conical), print speed, print distance, and platform temperature (PT), can be adjusted to enhance printability (He et al., 2016; Abdollahi et al., 2018). Several efforts have been made to tackle those issues by exhaustively selecting material components, compositions, and process parameters (Ribeiro et al., 2017; Jessop et al., 2019; Rahman et al., 2023). Achieving a reproducibly printable filament width and eventually a 3D scaffold requires meticulous adjustment of numerous variables, which can be a tedious and resource-consuming process.
Neglecting to optimize these variables may lead to issues such as nozzle clogging, under and over deposition, or a structurally weak 3D print (He et al., 2016) as shown in Figure 1B. Despite previous research on printability optimization, including studies on rheological characteristics (Mouser et al., 2016; Kuo et al., 2019), mathematical modeling of bioink flow behavior (Therriault et al., 2007), and image analysis of printed scaffolds (Paxton et al., 2017), researchers still heavily rely on trial-and-error method to fabricate 3D scaffolds with satisfactory shape fidelity. Computational methods have emerged as a potential solution to address the expensive and time-consuming nature of the trial-and-error process used to evaluate and optimize printing parameters. Machine Learning (ML) has emerged as a viable solution, enabling automation, and reducing experimentation time. ML-assisted print optimization is a new paradigm in the bioprinting arena. Unlike classical Design of Experiment (DoE) methods, ML methods allow adaptive sampling during experimentation, facilitating the development of a database for predicting printability and providing recommendations to experimenters (Wu and Xu, 2018; Shi et al., 2019). By utilizing computational methods and machine learning algorithms, researchers can potentially minimize the number of experiments required to create successful tissue constructs. This approach offers a more efficient and effective way of bioprinting, leading to improved accuracy and predictability in the process. These advancements are crucial for developing functional and dependable tissue constructs. Due to the complex relationship between ink composition and mechanical properties in hybrid hydrogels, it is challenging to analyze the overall factors affecting printability. To overcome this challenge, a machine learning approach was used to identify a universal correlation between rheological properties (such as storage modulus and elastic modulus) and ink formulations, as well as their printability. The study found that higher elastic modulus improves shape accuracy and enables extrusion below the critical yield stress point, leading to better printability (Lee et al., 2020). A new approach entitled Hierarchical Machine Learning (HML) was developed to predict and improve the accuracy of 3D printed hydrogel structures, specifically in terms of shape fidelity and linewidth (Bone et al., 2020). The study used a dataset that compared the original Computer Aided Designs (CADs) with the resulting prints made from alginate hydrogel, with variations in print input parameters. These parameters, including ink concentration, nozzle velocity, flow rate, and nozzle diameter, were characterized using physical variables like viscosity, applied pressure, and shear rate. However, the study only focused on alginate as the building block and further research is needed to understand the complex relationship and define viscosity and related print inputs for hybrid hydrogels. A parameter optimization index (POI) has been developed to establish an inverse relationship with filament width, nozzle diameter, and applied pressure. This index aims to achieve high accuracy in 3D printing while minimizing theoretical shear stress (Webb and Doyle, 2017). Even by employing this method, there is potential for enhancing the printability of hydrogel blends through optimization in both the preprocessing and processing stages. Still, determining POI is a resource-intensive exhaustive process. The challenge of designing biocompatible 3D-printable bioinks was addressed using a machine learning-based (the relative least general generalization algorithm for classification and multiple regression to support) approach with naturally derived biomaterials. The research demonstrates that atelocollagen (AC) exhibits favorable physical properties for printing compared to native collagen (NC) and establishes a universal relationship between ink’s mechanical properties and printability, supported by machine learning, enabling the creation of high-fidelity 3D constructs with viable and proliferative cells (Lee et al., 2020). It was reported that models trained on extensive data can accurately predict trends in cell viability, filament diameter, and extrusion pressure, showing potential for applying machine learning in bioprinting experimental design. While classification models for cell viability achieved an average prediction accuracy of 70%, they showed limited improvement with variations in input parameters (Tian et al., 2021). A support vector machine (SVM) model was developed that creates a process map to guide the selection of optimal printing parameters, resulting in high-quality prints with a probability exceeding 75%, offering a practical tool for enhancing extrusion-based bioprinting efficiency (Fu et al., 2021). The use of Machine Learning (ML) to differentiate between printing configurations likely to yield low-quality prints and those with higher potential was explored. The ML-based framework, employing both direct classification and regression models, assessed the quality of prints based on material composition and printing parameters (Conev et al., 2020).
The main objective of this study is to introduce a framework aimed at constructing a predictive model of 3D bioprinted scaffolds for hybrid biomaterials. The initial phase involves collecting data on filament width by exploring different combinations of process parameters and variables mentioned in Section 2. Once a substantial dataset is gathered, a linear regression-based machine learning approach will be utilized to develop the predictive model. After obtaining the predictive model, experiments will be conducted to validate the model.
To develop this proposed framework, various weight percent of naturally derived Alginate (Di Giuseppe et al., 2018) and Carboxy Methyl Cellulose (CMC) (Agarwal et al., 2015) biopolymers were used as building blocks to prepare hybrid hydrogel. Alginate is a well-known biopolymer commonly used for the 3D bioprinting process because of its ease of preparation and ability to control the rheological properties (Chen et al., 2020). It is a common negatively charged bio-copolymer composed of β-D-mannuronic acid (M) and α-L-guluronic acid (G) blocks. It is soluble in water and facilitates cell encapsulation. Being a common viscosity modifier, CMC has been combined with alginate to enhance the physical and mechanical properties of the hydrogels (Gonzalez-Fernandez et al., 2021).
2 Experiment setup and data collection
2.1 Hybrid hydrogel preparation
The hybrid hydrogels formulated in this study were prepared using alginate (alginic acid sodium salt derived from brown algae) and medium viscosity carboxymethyl cellulose (CMC) obtained from Sigma-Aldrich, St. Louis, MO, United States. The G-block of alginate supports gel formation, while the GM and M blocks contribute to increased flexibility. CMC is another water-soluble anionic bio-copolymer composed of β-D-glucose and β-D-glucopyranose-2-O-(carboxymethyl)-mono-sodium salt connected by β-1,4-glucosidic bonds (Han and Wang, 2017). CMC is commonly used as a thickener (Tongdeesoontorn et al., 2011) and is known for its non-toxic and non-allergenic nature. The presence of carboxyl groups in this cellulose derivative enhances its solubility, thickening properties, and stability (Han and Wang, 2017).
Figure 1A provides an overview of the hybrid hydrogel preparation process. Various weight percentages such as 0%–4% of alginate and CMC were mixed into water to prepare a set of Alginate-CMC (AC) compositions. The mixture was stirred overnight to ensure a homogeneous blend of alginate and CMC. Subsequently, the mixture was autoclaved at a temperature of 121°C for 20 min that confirms the sterilization by removing micro-organisms from the bio-inks to reduce the overall probability of contamination. The reduction of contamination of scaffold fabricated with living cells can improve the possibility of higher cell viability and proliferation. In Figure 1A, alginate and CMC are denoted by “A” and “C”, respectively, with the subscripts indicating the corresponding weight percentages.
2.2 Rheological experiments
A rotational rheometer (ARES-LS2, TA instruments, New Castle, DE, United States) equipped with parallel plate geometry (20 mm flat plate) was used to conduct rheological measurements. The measurements were taken at a gap width of 1.0 mm and a temperature of 25°C. Flow curves were generated by assessing the viscosities and shear stresses of various compositions across a range of shear strain rates from 1.0 to 100 s−1. To identify the shear-thinning behavior of the materials considered and determine the coefficients, the Power-Law Equation (Eq. 1) was fitted to the linear region of the shear rate vs. viscosity plot (Therriault et al., 2007).
Where
2.3 Scaffold fabrication
An extrusion-based 3D bio-printer [BioX (CELLINK, Boston, MA)] has been used to fabricate the filaments and scaffolds. The generation of vectorized tool paths for the scaffold was achieved using a Visual Basic-based scripting language, which was then converted into a machine-readable format. The hybrid hydrogels were stored in a disposable barrel reservoir (EFD, Nordson, Westlake, OH, United States) and dispensed by applying air pressure through a dosing nozzle (EFD, Nordson) onto a stationary print bed. The scaffold was fabricated in a grid pattern, with layers of bio-ink extruded in a 0°/90° orientation. Filament width and pore size were measured using ImageJ software, with three random measurements (n = 3) taken for each data point, and the results were presented as the mean ± standard deviation. Table 1 represents various process parameters used in bioprinting experiments for this study.
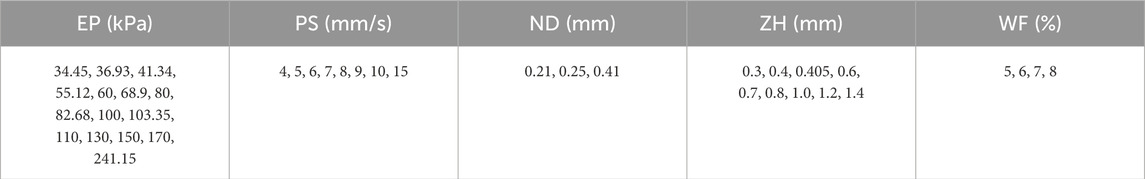
TABLE 1. Various process parameters such as Extrusion pressure (EP), Print Speed (PS), Nozzle Diameter (ND), Z-Height (ZH), and material’s Weight Fraction (WF) used to fabricate filament and determine Filament Width (FW) for this proposed framework.
2.4 Data collection procedure
All process parameters were selected based on the authors’ expertise and widely used in other literature. Process parameters were changed in a systematic way to capture the effects of specific process parameters. To enhance measurement precision, a pixel-based image analysis method was employed to determine filament width as mentioned in our earlier published work (Quigley et al., 2023). In short, microscopic images of deposited filaments were captured within a minute of printing. The scale of the microscope image was determined to calculate the width in pixels. Subsequently, MATLAB’s image batch processing toolbox was utilized for the analysis. The images were loaded into the program, processed, and converted to binary format. The filament width was then determined by identifying the coordinates of the initial and final pixels. These measurements were conducted thrice to obtain an average diameter for the printed filament. The discrepancy between the filament width and the diameter of the extrusion nozzle was defined as the diffusion rate [(actual filament width - nozzle diameter)/nozzle diameter × 100] in this study.
3 Machine learning framework for 3D bioprinting
In this work, a framework has been proposed to develop a predictive model for 3D bio-printed object’s structure. The first step is to obtain the filament width data for various combinations of process parameters and other variables mentioned in Section 2. Once the experimental data set is obtained, a regression-based machine learning method will be implemented to obtain the predictive model. The overall framework implemented in this work is illustrated in Figure 2.
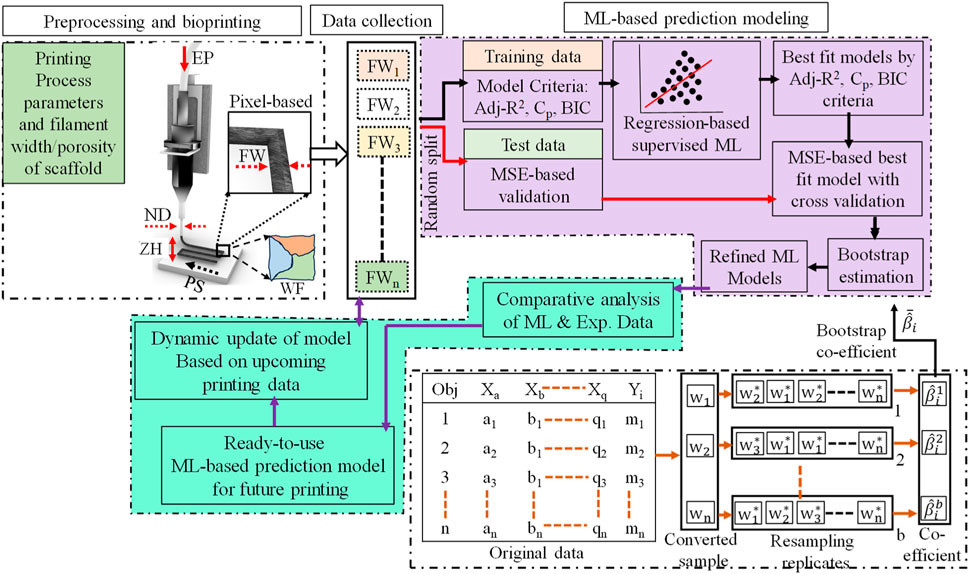
FIGURE 2. A regression-based machine learning framework for 3D bio-printed scaffold structures modeling.
3.1 Initial data processing
In the first stage, a simple descriptive analysis of data can help to understand the data and its related process behavior. The normality assumption is considered in regression-based modeling, however, for the larger dataset, the regression-based model is still very robust even if data are not perfectly normally distributed.
The Pearson correlation coefficient would be used initially to understand the linear relationship between process variables including the process output. Considering X1 and X2 represent two variables with having n amount of dataset, the Pearson correlation can be found using the following equation (Weiss and Weiss, 2017):
Here
As it is intended to apply the machine learning approach to develop our predictive model, it is necessary to split our data into two parts: training and test datasets. The training data would be used to establish different regression-based machine learning models whereas test data would be used to validate and compare the model performances. The data would be randomly split between 75% and 25% of the original dataset approximately for training and test purposes, respectively.
3.2 Regression process and variable selection
The 3D bio-printed structure’s output and process parameters are a quantitative type of variable that generates level-type data. Therefore, the linear regression-based method will be implemented considering the supervised machine learning modeling. The general least-square approach will be used for regression coefficient estimates. As there exist several process parameters in this study, the multiple-regression modeling will be utilized. The process parameters in engineering applications have higher tendencies to interact and therefore, it is considering all possible interaction terms in the model selection approach. However, higher-order polynomials will not be considered in this work as they have little to no meaning in explaining the 3D bio-printing physical process. Let’s consider a random variable Y represents the filament width of the printed object and a random variable X represents process parameters that influence the filament width. Then the regression model would be,
Here q represents the number of process parameters for the 3D bioprinting process, β′s represents the coefficient of the regression equation, and ε represents the error term. The residual sum of squares (RSS) then can be estimated by Eq. 4,
The total sum of squares (TSS) can be obtained by Eq. 5,
Both Eqs 4, 5 would be useful for the selection of different statistical model criteria in the later section. The β coefficients of a regression model are estimated considering minimizing the Eq. 4. For a decently larger number of process parameters, the number of total variables will be exponentially increased especially as it is considered all levels of interaction effects between process parameters. To handle this large amount of regression variable it is necessary to have a systematic process to select the best variables which influence the filament width with statistical significance. Three classic stepwise methods are used to select the best variables for the multiple regression model: forward, backward, and mixed stepwise selection methods (Harrell, 2001; Zhang, 2016). The forward selection method started with only intercept and with no variable. Step by step it added one after one variable and stopped the process once the selection criteria were met. The backward selection method starts with all possible variables and step by step it removes each variable following the selection criteria until it reaches an optimal number of variables. The backward selection method requires a larger number of datasets compared to the number of variables and the forward selection method might include some variables very early which become redundant later. The mixed model is a combination of forward and backward section processes where it adds variables to the model but may be removed variables later steps if the variable does not improve the model fit (James et al., 2013). The mixed model method has been adopted in this work for the best set of variable selections for the regression-based machine learning model.
3.3 Statistical model criteria
It has been considered three prominent statistical criteria for the variable selection method: adjusted R-square (Adj. R2) Mallow’s Cp, and Bayesian information criterion (BIC) (Zhang, 2016). The traditional R-square value is influenced by the number of variables and hence it is adjusted. Using Eqs 4, 5, the adjusted R-square can be estimated by Eq. 6,
Here, n is the total number of data points and d represents the total number of all possible variables including interaction terms. As these model selections are implemented using the training data therefore total number of data would be the total number of the training dataset instead of the full dataset. The adjusted R-square ranged between 0 and 1 and it interpreted how much the regression model can explain the variability of the data. The larger adjusted R-square value indicates a stronger model fit.
The second model criterion we adopted in this work is Mallow’s Cp measurement. The Cp can be estimated from the Eq. 7,
Here
The third model criterion is the Bayesian information criterion (BIC) which considers the Bayesian perspective in model selection. The BIC can be computed using Eq. 8,
Similar to Cp criteria, the model with lower BIC represents the stronger model fit. Due to the logarithmic penalty in BIC estimation, typically it heavily penalizes a larger number of variable inclusions in the model, thus BIC criteria usually have a smaller number of variables in the model (James et al., 2013).
3.4 Best model selection using cross-validation
In stepwise method mentioned in the previous section used training data to select the best set of variables for a model fit. As those machine learning models are obtained using training data there are high chances of model overfitting meaning the models perform very well with the training dataset however with the new dataset it does not perform satisfactorily. To address this overfitting issue we will utilize the cross-validation method (James et al., 2013). The test Mean Square Error (MSE) measurement will be used to perform the cross-validation of previously selected models. The test MSE can be obtained by following the equation,
In variable selection, we have used Adj. R2, Cp, and BIC criteria to choose the best-fit model. All these models will be used to estimate test MSE using the test dataset for selecting the best-performed model. The lower test MSE indicates that the model performs better with unknown or new datasets. The training MSE can be also estimated by Eq. 9 using the training dataset instead of the test dataset.
3.5 Bootstrap estimation of the model coefficients
The cross-validation method would provide the best regression-based machine learning model considering the current dataset. The model coefficient would vary based on training and test data. To address this uncertainty issue and increase the mode coefficient’s estimation accuracy, the bootstrap method is adopted. The bootstrap is a type of nonparametric Monte Carlo method that estimates coefficients using the resampling of data (Efron, 1992). The bootstrap process has been depicted in Figure 2 method framework in detail. In the first step of the bootstrap method, the sample size needs to be determined. In this work, it is considered that the sample size would be the same as the number of original datasets which is n. In the next step, generate a random sample also known as a resample from the original dataset using the random replacement of data points. The usual resample replicates (B) are 50 to 100 in number, however, for higher accuracy of estimation a larger number of replicates is considered such as 10,000 replicates (Limon et al., 2016). Once the resampling replicates are generated then for each replicate the model coefficients (βi) are estimated. Assume the bootstrap replicates for b = 1,2,3, ….B, the bootstrap estimate of the coefficient can be calculated using Eq. 10,
As a non-parametric type estimation, bootstrap estimates are free from any assumption of distribution fit.
3.6 Predictive model application
The best-fit model using the test data validation with the bootstrap coefficient estimate would be our final regression-based machine learning model. Several new experiments could be conducted to compare and further validate the experimental scaffold data with machine learning model data. When there are new sets of more experimental data, the total framework can be re-run to update the machine learning model to search for a better model fit with higher accuracy of the coefficient estimates.
4 Case study analysis and results
4.1 Preliminary observations
Out of 157 data, we have selected 8 of them that were obtained for various process parameters such as 110 kPa and 170 kPa EP, 5 mms−1 and 15 mms−1 PS, 0.21 mm and 0.41 mm ND to discuss the usual effects of them on filament width. All possible combinations are (EP, PS, ND): (110, 5, 0.21), (110, 15, 0.21), (110, 5, 0.41), (110, 15, 0.41), (170, 5, 0.21), (170, 15, 0.21), (170, 5, 0.41), and (170, 15, 0.41). Filament widths for all those combinations are shown in Figure 3. A set of phenomena was observed such as (i) with increasing EP, FW increased for constant ND and PS, (ii) bigger ND extrude filament with larger FW for constant EP and PS, (iii) with increasing PS, FW increased for constant ND and EP. For instance, when the EP was raised from 110 kPa to 170 kPa, a 115% increase in FW was measured during the extrusion process through a 0.21 ND at a PS of 5 mms−1. On the other hand, a similar EP change and ND size, but with a higher PS of 15 mms−1, resulted in a 110% increment in FW. ZH and WF were considered 0.3 mm and 8%, respectively for all combinations. Figure 3C shows filament widths with respect to PS and EP for 51 filaments extruded through 0.41 mm ND maintaining 8% solid content and 522 Pa s viscosity. Figure 3D represents FWs with respect to PS and EP for 38 filaments extruded through 0.21 mm ND maintaining 8% solid content and 522 Pa s viscosity. Both figures even show some trends such as (1) FW increases with increasing EP, (2) EP reduces with increasing PS, and (3) FW increases with increasing ND, the change of FW may not be straightforward to estimate and can be material properties and process parameters dependent (Chung et al., 2013; Diamantides et al., 2017; Habib et al., 2018). Therefore, for a large set of data, ML can be an efficient tool to identify a predictive model to estimate FW.
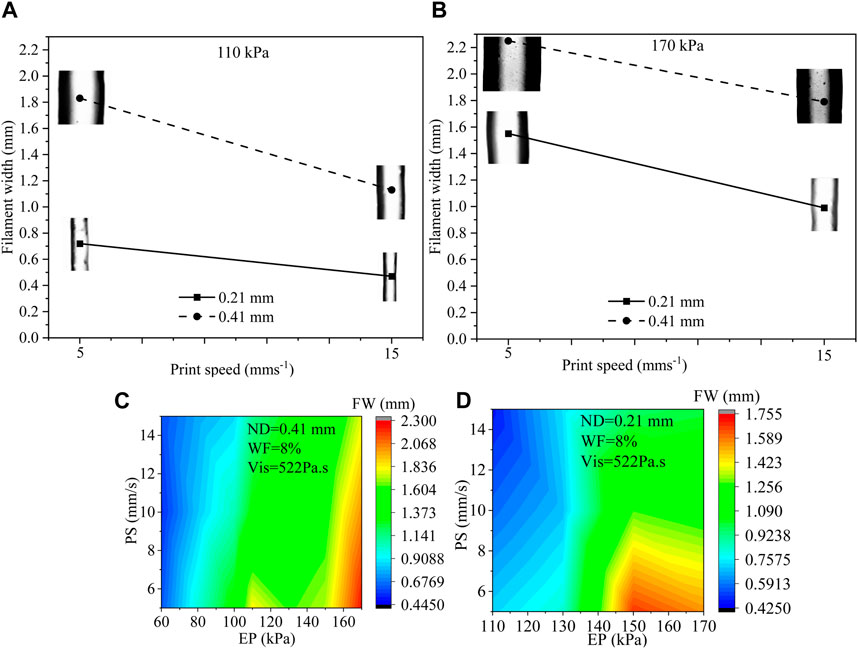
FIGURE 3. (A, B) Filament width for various EP (110 kPa and 170 kPa), PS (5 mms−1 and 15 mms−1), and ND (0.21 mm and 0.41 mm) where ZH and WF were considered constant such as 0.30 mm and 8%, respectively, (C) FW with respect to PS (5, 10, 15 mm/s) and EP (60–150 kPa) for 0.41 mm ND for 51 filaments, and (D) FW with respect to PS (5, 10, 15 mm/s) and EP (110–170 kPa) for 0.21 mm ND for 38 filaments.
4.2 Machine learning observations
As mentioned in Section 2, our case study dataset contains five process parameters, and the filament width of the printed object would be the dependent output variable. In total, there are 157 experimental data for this demonstration case study purpose. All analysis of this work has been performed by R Statistical Software (v4.3.1, R Core Team 2023). Figure 4 shows the scatterplot of the relative relation between process parameters including the output variable. The different data density of the scatterplot indicates that all combination of process parameter is not varied in the same proportion during the experimental test.
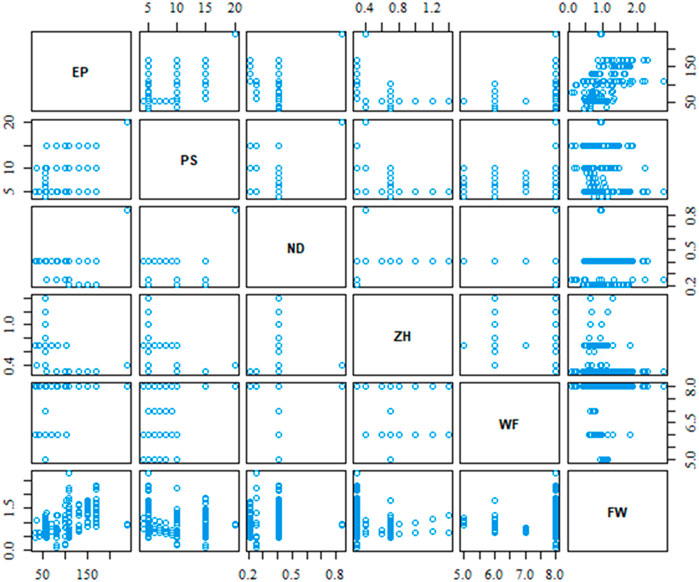
FIGURE 4. Scatter plot between process parameters and output variable.
The scatterplot in Figure 4 provides a visual depiction of the parameters’ relation, however, it does not provide the strength of the relation. The correlation matrix in Figure 5 provides the strength and direction of the variable’s relation using Eq. 2. It is very clear from the correlation matrix that several variables are significantly correlated such as extrusion pressure (EP) with print speed (PS) or material’s weight fraction (WF) with Z-height (ZH) between print nozzle and print bed. This correlation also justifies our initial assumption of possible interaction between process parameters and considers them during the best variable selection method.

FIGURE 5. Correlation matrix plot between process parameters.
4.3 Establishing the machine learning model
As we mentioned in Section 3.2, after the approximately 75/25 random split of the original dataset of 157 data, there are 122 data points for training the machine learning model and 35 data points for testing the model obtained using the training dataset. Considering all possible interactions for five process parameters there are a total of 31 variables. However, while we ran the mixed-type stepwise regression model selection algorithm, 15 of the interaction variables were omitted due to linear dependencies. A higher number of training datasets would help to reduce this issue. Therefore, the mixed stepwise selection algorithm would search for the best model fit among 16 variables using the training dataset.
Table 2 and Figure 6 show the stepwise iteration results considering the three different model criteria. The bold number in Table 2 represents the optimal value of corresponding model criteria whereas the red marks in Figure 4 indicate the optimal number of variables considering each model criteria. Though it shows only the number of variables, the specific variables are not the same in each iteration when it considers different model criteria. It is found that Adj R2 criteria reached optimal variable number selection by 9 with the highest value of 0.6491 or 64.91%, the Cp criteria reached optimal variable number by 7 with the lowest value of −12.2301, and the BIC criteria reached optimal variable number by 4 with the lowest value of −97.4532. As mentioned in Section 3, the Cp and BIC methods put extra penalties for additional variables inclusion in the model. Thus, the number of variables is higher in the Adj R2 method than in the Cp method and lowest in the BIC method. For our case study, the Adj R2 is not in the upper value. However, this model could be useful for predicting the porosity of the printed scaffolds. For the demonstrated case study, we have considered the most critical process parameters in our work for efficient and cost-effective experimentation. Considering a few more environmental variables such as curing temperature and humidity through the Design of the Experiment method can increase the accuracy of the model. In case of a higher number of outliers present, data transformation could further improve the prediction model as well. In our future work, we plan to integrate DoE [showed better R2 in our earlier work (Quigley et al., 2023)] and ML, increasing variables, and appropriate data transfer to potentially improve the resulting Adj-R2.
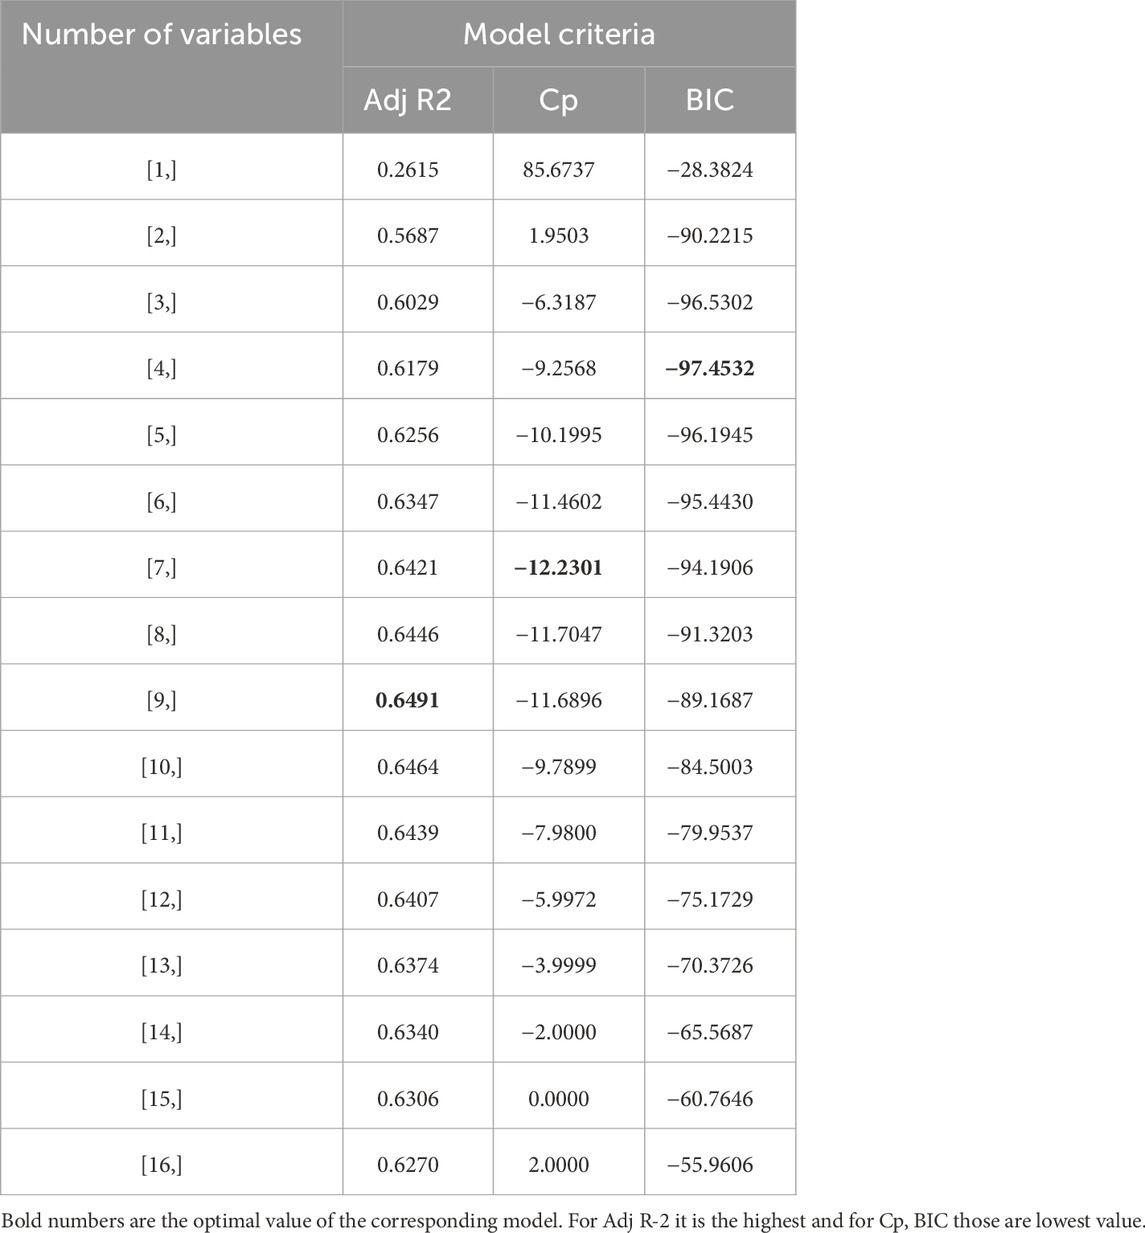
TABLE 2. Optimal variable selection under different model criteria.
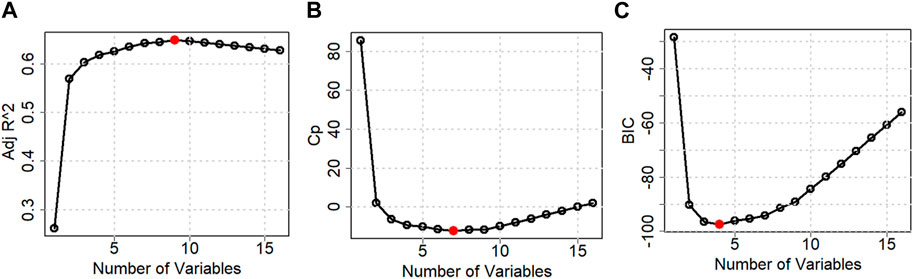
FIGURE 6. Best model fit by number of variables considering (A) Adj. R2 (B) Cp (C) BIC method.
The combination of selected variables under each model criterion is listed in Table 3. From all three model criteria, the best-fit model has a heavy presence of interaction terms. This is intuitive because process parameters interact with each other in a 3D printing process. Additionally, this confirms correlation matrix results that indicate a higher correlation between variables.
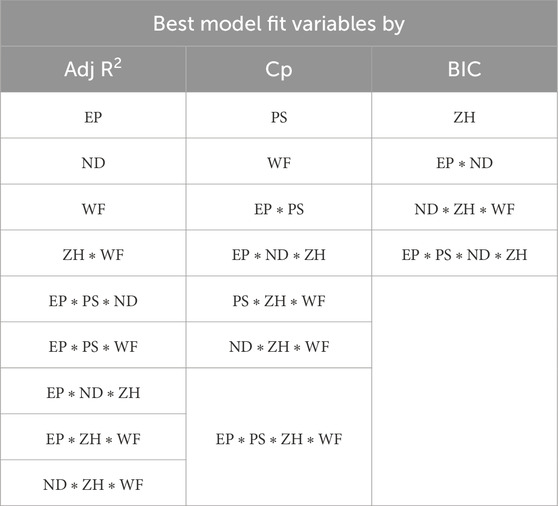
TABLE 3. Selected variables based on different model fit criteria.
4.4 Cross-validate and fine-tuning the model
All model best-fit criteria have been derived using training data. However, the performance of the best model will be cross-validated with the test data. The test MSE has been considered to cross-validate the training best-fit model listed in Table 3. Table 4 tabulated both the training and test MSE of each model obtained using the training dataset. It is observed that for every case, the training MSE is lower than the test MSE. This is very common because the training MSE uses the same data it used for model selection. The test MSE of Adj. R2, Cp, and BIC models are 0.0816, 0.0841, and 0.0877, respectively. Thus, the Adj. R2 model with 9 variables becomes the best performance machine learning model for our current dataset. The percentage difference of test MSE compared with the best model is also listed in Table 4. Based on the difference it can be concluded that the other two models are also very competitive compared to the best performance model.
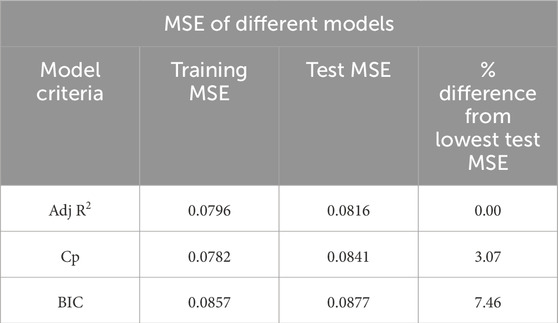
TABLE 4. Selected model’s MSE for different criteria.
The residual analysis of the best performance model is conducted which is the Adj. R2 criteria-based model. The residual analysis is conducted using the test dataset. Figure 7 depicts the residual plot and QQ plot based on the test dataset for the best model. Both the figures confirm that data are fairly randomized and follow normality with few outliers both in the upper and lower ends of data.
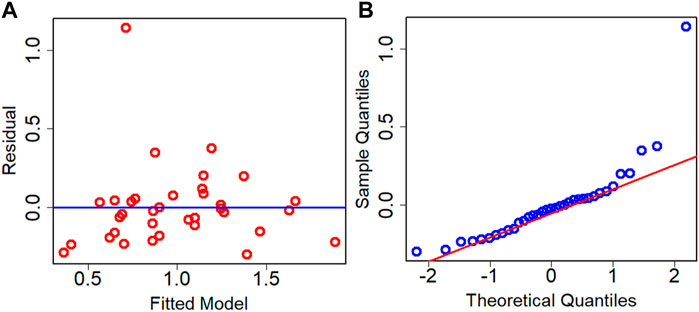
FIGURE 7. Residual analysis of best model using test data (A) residual plot (B) Q-Q plot.
The presence of an outlier can heavily impact the model coefficient estimate. In machine learning models, data are typically in large numbers with higher chances of being skewed in nature. The Bootstrap estimation method mentioned in Section 3 can significantly help to reduce the uncertainty, outlier issues, and asymmetric nature of data. Table 5 lists the coefficient estimate for the best performance model obtained after the cross-validation method. It is observed that the variation of coefficient estimates among the training and test datasets. In the current case scenario, one of the variables does not have an estimate for test datasets due to the test datasets are typically lower in number. The Bootstrap resampling method generates new sample data using randomized with replacement and estimates the coefficient for larger datasets. Therefore, the Bootstrap estimate is a very robust estimate of the coefficient and very useful especially when datasets are further departed from normality. The last column of Table 5 shows each variable estimate using 10,000 resamples of the Bootstrap method.
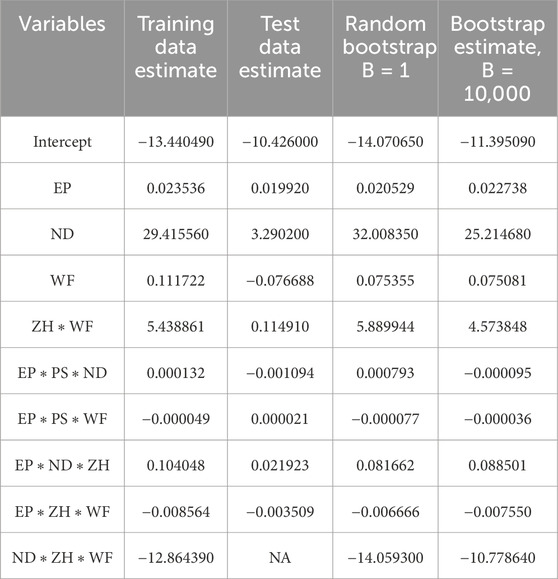
TABLE 5. Bootstrap coefficient of the cross-validated best-fit model.
Once the coefficient value of the best performance model is estimated, then the final predictive model based on Eq. 3 is established. To further understand and validate our machine learning model, there are conducted 4 more new 3D bio print experiments with different sets of process parameters. The experimental FW (FW-Exp.) would be measured in a similar fashion mentioned in Section 2. The process parameter value of these new experiment samples is used in the best-fit machine learning model and estimates the FW (FW-Mod). The different sets of process parameters, experimental and model-based FW are listed in Table 6. The comparison between experimental and model FW is depicted in Figure 8. The percentage error indicates the model fairly closely predicted the FW within an acceptable range.
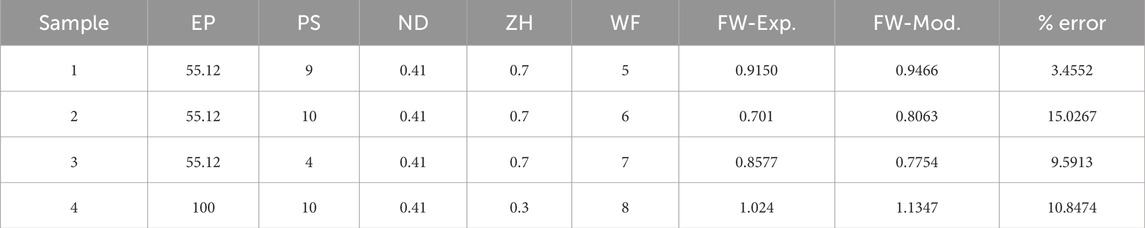
TABLE 6. Comparison with experimental and model filament width.
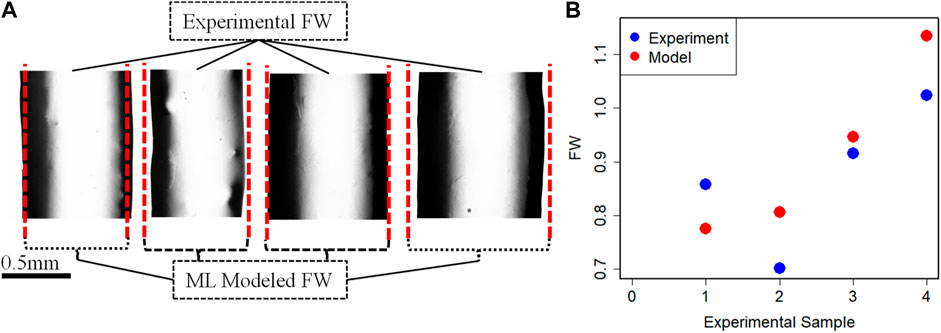
FIGURE 8. (A) Fabricated filaments for validation and (B) FW comparison between experimental and Model data.
5 Conclusion
3D bioprinted scaffold structures with desired mechanical and bio-properties play a key role in the development and growth of encapsulated cells and eventually tissue and organ regeneration. A noble photo-pixel method has been used in this work to measure the printed object’s filament width. To establish the predictive model a regression-based supervised machine learning approach has been adopted in the proposed methodology. The test MSE of three statistical models has been estimated using the randomly split test data which resulted from the MSE of Adj R2, Cp, and BIC models being 0.0816, 0.0841, and 0.0877, respectively. The Adj R2 model with 9 variables becomes the best performance machine learning model for our current dataset. The other two models are also very competitive and can be used by trading off slightly higher MSE. To deal with the nonnormality of data and fine-tuning of the model coefficient bootstrap method has been implemented. Based on comparative analysis results our model can predict filament width with at least approximately 85% accuracy.
The proposed method has been demonstrated on hybrid hydrogel (alginate and CMC) biomaterials. Therefore, the resulting best-fit model is limited to the specific material type. However, the proposed framework is equally applicable to biomaterial types. Different types of biomaterials with additional combinations of process parameters are in our future research scope. Several other environmental parameters such as curing temperature and humidity could be considered in future work.
Data availability statement
The raw data supporting the conclusion of this article will be made available by the authors, without undue reservation.
Author contributions
SL: Data curation, Methodology, Software, Writing–original draft, Writing–review and editing. CQ: Data curation, Validation, Writing–review and editing. RS: Data curation, Validation, Writing–review and editing. AH: Conceptualization, Funding acquisition, Resources, Writing–original draft, Writing–review and editing.
Funding
The author(s) declare financial support was received for the research, authorship, and/or publication of this article. Research was supported by New Hampshire-EPSCoR through BioMade Award #1757371 from National Science Foundation and New Hampshire-INBRE through an Institutional Development Award (IDeA), P20GM103506, from the National Institute of General Medical Sciences of the NIH, and Dean’s Office, Slippery Rock University of Pennsylvania, PA, USA.
Conflict of interest
The authors declare that the research was conducted in the absence of any commercial or financial relationships that could be construed as a potential conflict of interest.
Publisher’s note
All claims expressed in this article are solely those of the authors and do not necessarily represent those of their affiliated organizations, or those of the publisher, the editors and the reviewers. Any product that may be evaluated in this article, or claim that may be made by its manufacturer, is not guaranteed or endorsed by the publisher.
Abbreviations
3D, Three Dimensional; AC, AteloCollagen; BIC, Bayesian Information Criterion; CAD, Computer Aided Design; CMC, Carboxy Methyl Cellulose; DoE, Design of Experiment; EBP, Extrusion-based BioPrinting; EP, Extrusion Pressure; FW, Filament Width; HML, Hierarchical Machine Learning; MSE, Mean Squared Error; ML, Machine Learning; NC, Native Collagen; ND, Nozzle Diameter; PEG, PolyEthylene Glycol; PCL, PolyCaproLactone; PLA, PolyLactic Acid; POI, Parameter Optimization Index; PS, Print Speed; PT, Platform Temperature; Q-Q, Quantile-Quantile; RSS, Residual Sum of Squares; SVM, Support Vector Machine; TSS, Total Sum of Squares; WF, Weight Fraction; ZH, Z-Height.
References
Abdollahi, S., Davis, A., Miller, J. H., and Feinberg, A. W. (2018). Expert-guided optimization for 3D printing of soft and liquid materials. PloS one 13, e0194890. doi:10.1371/journal.pone.0194890
Agarwal, T., Narayana, S. G. H., Pal, K., Pramanik, K., Giri, S., and Banerjee, I. (2015). Calcium alginate-carboxymethyl cellulose beads for colon-targeted drug delivery. Int. J. Biol. Macromol. 75, 409–417. doi:10.1016/j.ijbiomac.2014.12.052
Almeida, C. R., Serra, T., Oliveira, M. I., Planell, J. A., Barbosa, M. A., and Navarro, M. (2014). Impact of 3-D printed PLA-and chitosan-based scaffolds on human monocyte/macrophage responses: unraveling the effect of 3-D structures on inflammation. Acta biomater. 10, 613–622. doi:10.1016/j.actbio.2013.10.035
Arif, Z. U., Khalid, M. Y., Ahmed, W., and Arshad, H. (2022b). A review on four-dimensional (4D) bioprinting in pursuit of advanced tissue engineering applications. Bioprinting 27, e00203. doi:10.1016/j.bprint.2022.e00203
Arif, Z. U., Khalid, M. Y., Noroozi, R., Hossain, M., Shi, H. H., Tariq, A., et al. (2023b). Additive manufacturing of sustainable biomaterials for biomedical applications. Asian J. Pharm. Sci. 18, 100812. doi:10.1016/j.ajps.2023.100812
Arif, Z. U., Khalid, M. Y., Noroozi, R., Sadeghianmaryan, A., Jalalvand, M., and Hossain, M. (2022a). Recent advances in 3D-printed polylactide and polycaprolactone-based biomaterials for tissue engineering applications. Int. J. Biol. Macromol. 218, 930–968. doi:10.1016/j.ijbiomac.2022.07.140
Bone, J. M., Childs, C. M., Menon, A., Poczos, B., Feinberg, A. W., LeDuc, P. R., et al. (2020). Hierarchical machine learning for high-fidelity 3D printed biopolymers. ACS Biomaterials Sci. Eng. 6, 7021–7031. doi:10.1021/acsbiomaterials.0c00755
Chen, Y., Xiong, X., Liu, X., Cui, R., Wang, C., Zhao, G., et al. (2020). 3D Bioprinting of shear-thinning hybrid bioinks with excellent bioactivity derived from gellan/alginate and thixotropic magnesium phosphate-based gels. J. Mater. Chem. B 8, 5500–5514. doi:10.1039/d0tb00060d
Chimene, D., Lennox, K. K., Kaunas, R. R., and Gaharwar, A. K. (2016). Advanced bioinks for 3D printing: a materials science perspective. Ann. Biomed. Eng. 44, 2090–2102. doi:10.1007/s10439-016-1638-y
Chung, J. H., Naficy, S., Yue, Z., Kapsa, R., Quigley, A., Moulton, S. E., et al. (2013). Bio-ink properties and printability for extrusion printing living cells. Biomaterials Sci. 1, 763–773. doi:10.1039/c3bm00012e
Conev, A., Litsa, E. E., Perez, M. R., Diba, M., Mikos, A. G., and Kavraki, L. E. (2020). Machine learning-guided three-dimensional printing of tissue engineering scaffolds. Tissue Eng. Part A 26, 1359–1368. doi:10.1089/ten.tea.2020.0191
Diamantides, N., Wang, L., Pruiksma, T., Siemiatkoski, J., Dugopolski, C., Shortkroff, S., et al. (2017). Correlating rheological properties and printability of collagen bioinks: the effects of riboflavin photocrosslinking and pH. Biofabrication 9, 034102. doi:10.1088/1758-5090/aa780f
Di Giuseppe, M., Law, N., Webb, B., Macrae, R. A., Liew, L. J., Sercombe, T. B., et al. (2018). Mechanical behaviour of alginate-gelatin hydrogels for 3D bioprinting. J. Mech. Behav. Biomed. Mater. 79, 150–157. doi:10.1016/j.jmbbm.2017.12.018
Efron, B. (1992). “Bootstrap methods: another look at the jackknife,” in Breakthroughs in statistics: methodology and distribution (Springer), 569–593.
Fu, Z., Angeline, V., and Sun, W. (2021). Evaluation of printing parameters on 3D extrusion printing of pluronic hydrogels and machine learning guided parameter recommendation. Int. J. bioprinting 7, 434. doi:10.18063/ijb.v7i4.434
Gonzalez-Fernandez, T., Tenorio, A. J., Campbell, K. T., Silva, E. A., and Leach, J. K. (2021). Alginate-based bioinks for 3D bioprinting and fabrication of anatomically accurate bone grafts. Tissue Eng. Part A 27, 1168–1181. doi:10.1089/ten.tea.2020.0305
Gottipati, A., and Elder, S. (2017). Effect of chitosan calcium phosphate bead size on scaffold properties as they relate to formation of biphasic constructs for osteochondral regeneration. J. Polym. Mater. 34, 287.
Habib, A., Quigley, C., Sarah, R., Hurd, W., and Clark, S. (2024). Design and fabrication of in-house nozzle system to extrude multi-hydrogels for 3D bioprinting process. J. Manuf. Sci. Eng. 146. doi:10.1115/1.4063357
Habib, A., Sathish, V., Mallik, S., and Khoda, B. (2018). 3D printability of alginate-carboxymethyl cellulose hydrogel. Materials 11, 454. doi:10.3390/ma11030454
Han, K.-S., Song, J. E., Tripathy, N., Kim, H., Moon, B. M., Park, C. H., et al. (2015). Effect of pore sizes of silk scaffolds for cartilage tissue engineering. Macromol. Res. 23, 1091–1097. doi:10.1007/s13233-015-3156-4
Han, Y., and Wang, L. (2017). Sodium alginate/carboxymethyl cellulose films containing pyrogallic acid: physical and antibacterial properties. J. Sci. Food Agric. 97, 1295–1301. doi:10.1002/jsfa.7863
Harrell, F. E. (2001). Regression modeling strategies: with applications to linear models, logistic regression, and survival analysis. Springer.
He, Y., Yang, F., Zhao, H., Gao, Q., Xia, B., and Fu, J. (2016). Research on the printability of hydrogels in 3D bioprinting. Sci. Rep. 6, 29977. doi:10.1038/srep29977
Hölzl, K., Lin, S., Tytgat, L., Van Vlierberghe, S., Gu, L., and Ovsianikov, A. (2016). Bioink properties before, during and after 3D bioprinting. Biofabrication 8, 032002. doi:10.1088/1758-5090/8/3/032002
James, G., Witten, D., Hastie, T., and Tibshirani, R. (2013). An introduction to statistical learning. Springer.
Jessop, Z. M., Al-Sabah, A., Gao, N., Kyle, S., Thomas, B., Badiei, N., et al. (2019). Printability of pulp derived crystal, fibril and blend nanocellulose-alginate bioinks for extrusion 3D bioprinting. Biofabrication 11, 045006. doi:10.1088/1758-5090/ab0631
Ji, S., and Guvendiren, M. (2017). Recent advances in bioink design for 3D bioprinting of tissues and organs. Front. Bioeng. Biotechnol. 5, 23. doi:10.3389/fbioe.2017.00023
Jia, J., Richards, D. J., Pollard, S., Tan, Y., Rodriguez, J., Visconti, R. P., et al. (2014). Engineering alginate as bioink for bioprinting. Acta biomater. 10, 4323–4331. doi:10.1016/j.actbio.2014.06.034
Khoda, A., Ozbolat, I. T., and Koc, B. (2011). Engineered tissue scaffolds with variational porous architecture. J. Biomechanical Eng. 133, 011001. doi:10.1115/1.4002933
Kuo, C., Qin, H., Acuña, D., Cheng, Y., and Jiang, X. (2019). Printability of hydrogel composites using extrusion-based 3D printing and post-processing with calcium chloride. J. Food Sci. Nutr. 5, 051.
Lee, J., Oh, S. J., An, S. H., Kim, W.-D., and Kim, S.-H. (2020). Machine learning-based design strategy for 3D printable bioink: elastic modulus and yield stress determine printability. Biofabrication 12, 035018. doi:10.1088/1758-5090/ab8707
Li, V.C.-F., Dunn, C. K., Zhang, Z., Deng, Y., and Qi, H. J. (2017). Direct ink write (DIW) 3D printed cellulose nanocrystal aerogel structures. Sci. Rep. 7, 8018. doi:10.1038/s41598-017-07771-y
Limon, S., Yadav, O. P., Zuo, M. J., Muscha, J., and Honeyman, R. (2016). Reliability estimation considering usage rate profile and warranty claims. Proceedings of the Institution of Mechanical Engineers, Part O: Journal of Risk and Reliability 230 (3), 297–308.
Mouser, V. H., Melchels, F. P., Visser, J., Dhert, W. J., Gawlitta, D., and Malda, J. (2016). Yield stress determines bioprintability of hydrogels based on gelatin-methacryloyl and gellan gum for cartilage bioprinting. Biofabrication 8, 035003. doi:10.1088/1758-5090/8/3/035003
Murphy, C. M., Haugh, M. G., and O'Brien, F. J. (2010). The effect of mean pore size on cell attachment, proliferation and migration in collagen–glycosaminoglycan scaffolds for bone tissue engineering. Biomaterials 31, 461–466. doi:10.1016/j.biomaterials.2009.09.063
Murphy, S. V., and Atala, A. (2014). 3D bioprinting of tissues and organs. Nat. Biotechnol. 32, 773–785. doi:10.1038/nbt.2958
Ouyang, L., Yao, R., Zhao, Y., and Sun, W. (2016). Effect of bioink properties on printability and cell viability for 3D bioplotting of embryonic stem cells. Biofabrication 8, 035020. doi:10.1088/1758-5090/8/3/035020
Ozbolat, I. T., Khoda, A., Marchany, M., Gardella, J. A., and Koc, B. (2012). Hybrid tissue scaffolds for controlled release applications: a study on design and fabrication of hybrid and heterogeneous tissue scaffolds for controlled release applications is presented in this paper. Virtual Phys. Prototyp. 7, 37–47.
Paxton, N. C., Smolan, W., Böck, T., Melchels, F. P., Groll, J., and Juengst, T. (2017). Proposal to assess printability of bioinks for extrusion-based bioprinting and evaluation of rheological properties governing bioprintability. Biofabrication 9, 044107. doi:10.1088/1758-5090/aa8dd8
Perez, R. A., and Mestres, G. (2016). Role of pore size and morphology in musculo-skeletal tissue regeneration. Mater. Sci. Eng. C 61, 922–939. doi:10.1016/j.msec.2015.12.087
Quigley, C., Limon, S., Sarah, R., and Habib, A. (2023). Factorial design of experiment method to characterize bioprinting process parameters to obtain the targeted scaffold porosity. J. 3D Print. Addit. Manuf. doi:10.1089/3dp.2023.0138
Rahman, M. A. (2022). Process optimization of 3D printing with continuous fiber reinforced UV curable thermoset resin. Fargo, ND: North Dakota State University.
Rahman, M. A., Hall, E., Gibbon, L., Islam, M. Z., Ulven, C. A., and La Scala, J. J. (2023). A mechanical performance study of dual cured thermoset resin systems 3D-printed with continuous carbon fiber reinforcement. Polymers 15, 1384. doi:10.3390/polym15061384
Ribeiro, A., Blokzijl, M. M., Levato, R., Visser, C. W., Castilho, M., Hennink, W. E., et al. (2017). Assessing bioink shape fidelity to aid material development in 3D bioprinting. Biofabrication 10, 014102. doi:10.1088/1758-5090/aa90e2
Schuurman, W., Levett, P. A., Pot, M. W., van Weeren, P. R., Dhert, W. J., Hutmacher, D. W., et al. (2013). Gelatin-methacrylamide hydrogels as potential biomaterials for fabrication of tissue-engineered cartilage constructs. Macromol. Biosci. 13, 551–561. doi:10.1002/mabi.201200471
Shi, J., Song, J., Song, B., and Lu, W. F. (2019). Multi-objective optimization design through machine learning for drop-on-demand bioprinting. Engineering 5, 586–593. doi:10.1016/j.eng.2018.12.009
Tabriz, A. G., Hermida, M. A., Leslie, N. R., and Shu, W. (2015). Three-dimensional bioprinting of complex cell laden alginate hydrogel structures. Biofabrication 7, 045012. doi:10.1088/1758-5090/7/4/045012
Therriault, D., White, S. R., and Lewis, J. A. (2007). Rheological behavior of fugitive organic inks for direct-write assembly. Appl. Rheol. 17, 10112–10118. doi:10.1515/arh-2007-0001
Tian, S., Stevens, R., McInnes, B. T., and Lewinski, N. A. (2021). Machine assisted experimentation of extrusion-based bioprinting systems. Micromachines 12, 780. doi:10.3390/mi12070780
Tongdeesoontorn, W., Mauer, L. J., Wongruong, S., Sriburi, P., and Rachtanapun, P. (2011). Effect of carboxymethyl cellulose concentration on physical properties of biodegradable cassava starch-based films. Chem. Central J. 5, 6. doi:10.1186/1752-153x-5-6
Webb, B., and Doyle, B. J. (2017). Parameter optimization for 3D bioprinting of hydrogels. Bioprinting 8, 8–12. doi:10.1016/j.bprint.2017.09.001
Wu, D., and Xu, C. (2018). Predictive modeling of droplet formation processes in inkjet-based bioprinting. J. Manuf. Sci. Eng. 140. doi:10.1115/1.4040619
Keywords: 3D bioprinting, hydrogel, machine learning, scaffold porosity, extrusion, print parameters
Citation: Limon SM, Quigley C, Sarah R and Habib A (2024) Advancing scaffold porosity through a machine learning framework in extrusion based 3D bioprinting. Front. Mater. 10:1337485. doi: 10.3389/fmats.2023.1337485
Received: 13 November 2023; Accepted: 26 December 2023;
Published: 02 February 2024.
Edited by:
Xiaohua Chang, Hangzhou Normal University, ChinaReviewed by:
Mahboubeh Nabavinia, The Research Institute at Nationwide Children’s Hospital, United StatesZia Ullah Arif, University of Southampton, United Kingdom
Copyright © 2024 Limon, Quigley, Sarah and Habib. This is an open-access article distributed under the terms of the Creative Commons Attribution License (CC BY). The use, distribution or reproduction in other forums is permitted, provided the original author(s) and the copyright owner(s) are credited and that the original publication in this journal is cited, in accordance with accepted academic practice. No use, distribution or reproduction is permitted which does not comply with these terms.
*Correspondence: Ahasan Habib, bWFobWV0QHJpdC5lZHU=