 Shashwath Patil1Thanikodi Sathish1P. S. Rao2M. S. Prabhudev3V. Vijayan4
 S. Rajkumar5
 Shubham Sharma6,7,8*Abhinav Kumar9Mohamed Abbas10Emad Makki11*
- 1Department of Mechanical Engineering, Saveetha School of Engineering, Chennai, Tamil Nadu, India
- 2Department of Mechanical Engineering, National Institute of Technical Teachers’ Training and Research, Chandigarh, India
- 3Department of Mechanical Engineering, Government Polytechnic Kalgi, Kalaburgi, India
- 4Department of Mechanical Engineering, K. Ramakrishnan College of Technology, Trichy, India
- 5Department of Mechanical Engineering, Faculty of Manufacturing, Institute of Technology, Hawassa University, Awasa, Ethiopia
- 6School of Mechanical and Automotive Engineering, Qingdao University of Technology, Qingdao, China
- 7Department of Mechanical Engineering, Lebanese American University, Beirut, Lebanon
- 8Centre for Research Impact and Outcome, Chitkara University Institute of Engineering and Technology, Chitkara University, Punjab, India
- 9Department of Nuclear and Renewable Energy, Ural Federal University Named After the First President of Russia, Boris Yeltsin, Ekaterinburg, Russia
- 10Electrical Engineering Department, College of Engineering, King Khalid University, Abha, Saudi Arabia
- 11Department of Mechanical Engineering, College of Engineering and Architecture, Umm Al-Qura University, Makkah, Saudi Arabia
Introduction: Among alloys of medium-carbon and high-strength steel, EN 24 steel is characterised by its nickel-chromium-molybdenum composition. EN 24 steel is highly suitable for application in heavy-duty projects due to its notable resilience to damage, especially when exposed to low temperatures. With the objective of minimising surface irregularities, this research endeavours to enhance the milling process of EN 24 steel by employing coated tungsten carbide (WC) tool inserts.
Methods: Feed rate, cutting speed, depth of cut, and cutting fluid are all crucial process factors in the experimental investigation. Four distinct levels are applied to each factor. The research utilises the Design of Experiments (DOE)-based Central Composite Design of Response Surface Methodology. To predict output parameters, mathematical models are developed utilising analysis of variance (ANOVA) for optimisation purposes.
Results and discussions: Through the utilisation of multi-objective optimisation, the optimal combination for tungsten carbide inserts was determined, which provided surface irregularities of 0.301 µm. Cutting speed (CS) of 149.507 m/min, feed rate (FR) of 340.27 mm/min, depth of cut (DOC) of 0.599 mm, and cutting fluid (CF) of 12.50 L/min are the optimal parameters. The surface morphologies of the machined workpiece at particular parameter values can be discerned through scanning electron microscope (SEM) analysis, yielding significant insights. The optimal parameters that have been identified provide practical recommendations for improving the milling method of EN 24 steel when tungsten carbide inserts are utilised. Understanding the milling process in its entirety is facilitated by SEM analysis of surface morphologies and microstructures under particular cutting conditions. The morphology and surface irregularities of the machined workpiece are evaluated using profilometry, which provides additional insight into surface integrity. The discourse investigates the potential applications and implications of the results, as well as suggests directions for further study concerning the enhancement of milling processes for similar steel alloys.
1 Introduction
Computer Numerical Control (CNC) vertical milling machine technology has advanced significantly in recent years to meet the advanced requirements in different manufacturing domains due to the ability to enhance the machine’s performance, reduce costs while accomplishing shorter lead times, and increase productivity, particularly in the precision metal cutting industry (Kotaiah et al., 2010). Better surface quality is the central aspect of engineering materials (Özel and Karpat, 2005). Surface integrity is vital in specifying the surface quality of manufactured components. Better surface roughness improves the final product’s microstructural characteristics, fatigue strength, and visual look (Asiltürk and Çunkaş, 2011). Also, surface irregularity influences various properties of machined components, including friction, wear, and heat transmission (Fetecau and Stan, 2012). Surface roughness is described as a collection of irregular surface waves evaluated in micrometers (Yahul and Saravanan, 2022) surface integrity data identified from testing may be used to calculate the roughness factor (Praveen Chowdary and Saravanan, 2022). Many roughness factors have been used, and Ra is considered the most prevalent. Rz and Rq are two more significant parameters (Hamdan et al., 2012). Surface irregularity is influenced by milling factors that can be programmed in advance, like feed rate, cutting speed, and cut depth (Patil et al., 2021). It has been influenced by uncontrollable factors like the mechanical qualities of the materials, the cutter type used, and the vibration created throughout the operation (Praveen Chowdary and Saravanan, 2023). The rate of the cutting speed is a machining factor that influences surface integrity, but the depth of the cut has little effect (Mohammed Yahu, 2023). Optimizing these parameters to attain the minimum surface integrity and tool wear is critical for efficiency (Xavior and Adithan, 2009). Coating tools have always been assumed to accomplish several valuable functions, like lowering the cutting temperature and cutting force and enhancing abrasion resistance (Sayit et al., 2009; Sequeira, 2012). The coated cutting tool reduces surface integrity. However, assistance depends on various aspects, including the substrate material, combinations of tool coatings, and the thermo-physical circumstances of both the tool and workpiece. Coated carbide tools broaden the range of machining conditions where a lower wear rate is observed (Bauer et al., 2024).
Mandal et al. (2011) evaluated the machining of AISI 4340 steel by a newly designed zirconia-toughened alumina ceramic tool insert, applying the Taguchi L9 with three variables (depth of cut, feed rate, and cutting speed) approach. They concluded that the best optimal cutting condition was based on mean of response and signal-to-noise ratio (SNR), with a cutting speed of 280 m/min, depth of cut of 0.5 mm, and feed rate of 0.12 mm/rev. The cut depth was observed to have the most significant impact on tool wear. This study also focuses optimizing process parameters but optimized with use of RSM for EN 24 Steel with WC-Coated inserts in the milling cutter. (Dawood et al., 2012) applied the Taguchi approach and a genetic algorithm to minimize surface integrity during milling MS with three zinc-coated tools placed into a 25-mm-diameter face miller. The machining parameters studied were the number of passes, depth of cut, spindle speed, and feed rate. The effect of these parameters on surface roughness was evaluated. The predicted values were validated through experimental confirmation, with a deviation of 4.308 between the predicted and confirmed values. This study also employed optimization but RSM used for optimizing milling parameters with coated tool for machining EN24 steel. Palanikumar (2008) examined the outcome of input factors on surface integrity during GFRP composite milling by building a second-order model using a polycrystalline diamond tool to determine surface roughness. The experimental findings indicate that the feed rate is the most influential machining parameter for surface roughness, followed by cutting speed. This study also focuses to investigate influence of process parameters but for milling of EN24 Steel with coated tool. Thakre et al. (2013) examine the impact of various milling factors with three levels of cutting parameters. Experiments on face milling operations are conducted by deploying the Taguchi approach L9 array on 1040 mild steel material on vertical milling with carbide tool inserts. Experiment findings revealed that the surface integrity parameter is influenced by coolant flow, around 60% of the aggregate. With an optimal coolant flow rate, a good surface finish is achieved. The second most significant factor is spindle speed (22%). But this investigation for optimizing machining parameters with RSM for EN24 steel machining in milling process. Akhyar et al. (2008) applied the Taguchi approach to enhance cutting factors during turning Ti-6%Al-4%V with an incredibly minimal interstitial using uncoated and coated tools in dry circumstances and maximum cutting speed for enhanced surface quality. An L27 with three levels for each parameter was employed to find the ideal combination. An analysis of variance utilizing the tool grade will investigate if cutting speed and tool grade is influenced by surface quality. The experimental findings indicate that the feed rate is the most influential machining parameter for surface roughness. This study also aimed to improve surface finish but with coated tool in milling operation on EN24 steel. Suresh et al. (2002) used a two-stage technique to optimize surface roughness. RSM first utilized experimental findings to develop mathematical models for surface integrity. A second-order mathematical model was used as the objective function, and milling conditions for the specified surface quality were optimized using a genetic algorithm (GA). This investigation aims to optimize milling parameters with RSM and develop with quadradic equation for prediction for EN24 steel milling. Bhanu Prakash et al. (2017) During optimized CNC milling during the machining of AA 6082, the surface integrity degrades with decreasing spindle speed and increasing cut depth and feed rate. The RSM technique estimated the optimal surface roughness value to be 1.192 microns, using a spindle speed of 3,000 rpm, feed rate of 1,000 mm/min, and depth of cut of 0.2 mm. The GA technique estimated the optimal surface roughness value to be 1.195 microns, using a spindle speed of 2997.64729 rpm, feed rate of 1,005.94134 mm/min, and depth of cut of 0.20862 mm but in this study also used RSM for EN24 steel milling with specially coated tool. Nadaf and Shinde (2020) examined milling operations using E250 material with three levels of variables (output variables are MRR and surface integrity were utilized to develop a genetic algorithm (GA) and coupled objective function (COF) for optimal input variables of the L18 orthogonal array. The primary factors influencing surface roughness are feed rate, depth of cut, and speed, contributing 85.51%, 7.72%, and 4.58%, respectively. Feed rate (by 50.13%), depth of cut (31.46%), and speed (10.10%) all have a substantial impact on the rate of material removal. This study focused on optimizing process parameters to maximize Surface finish. Haja Syeddu Masooth et al. (2020) The Taguchi technique was deployed to examine the effect of milling variables on surface integrity in dry machining of the AA Al6061-T6 utilizing uncoated and TiAlN-coated carbide inserts. An L9 orthogonal array is used for experimentation. Spindle speed has a substantial effect on irregularities. The excellent surface irregularity value for an uncoated tool is 0.365 m. Unlike DOC and feed rate, spindle speed is the main parameter impacting surface integrity on coated TiAlN carbide tool surfaces. The better surface irregularity value for coated carbide tools is 0.1406 m. This study analyses to maximize surface finish in machining EN 24 Steel with WC-Coated inserts in milling operation Patil et al. (2022) investigated the effect of end milling factors such as the number of revolutions, feed rate, and DOC on the surface integrity of Al 6061 and Al 6463. Grey relation analysis (GRA) and Principal component analysis (PCA) were used to determine the extent of surface integrity during the milling process and analyze the pre-measured trial data. Experimental results show that spindle speed is more efficient than feed and DOC. Raju et al. (2011) investigated the influence of different control factors on surface integrity while end milling 6061 AA using HSS and carbide inserts in both dry and wet factors and used a multiple regression study to identify investigational measures using analysis of variance. According to the findings, feed rate had an impact on roughness. Surface irregularity decreases when a carbide tool is used instead of an HSS tool. Surface roughness is reduced when coolant is used. Satyanarayana et al. (2023) aimed to analyze the optimal parameters for fly (face) milling of components composed of AISI 1045 steel in terms of surface finish and energy consumption. The study found that the most effective fly milling performance for fast manufacturing (case 1) is achieved with a feed per tooth of fz = 0.25 mm/tooth, cutting speed of vc = 392.6 m/min, and machined length of l = 5 mm. The optimal parameters for conserving resources (tools) in case 2 are feed per tooth (fz) = 0.125 mm/tooth, cutting speed (vc) = 392.6 m/min, and machined length (L) = 5 mm. This study also used for optimizing process parameters in milling of EN 24 Steel with WC-Coated inserts. Equbal et al. (2022) examined the CNC milling capabilities for the machining process of AISI 316 stainless steel. The study indicates that with surface roughness, the primary influential factor is the feed, with the depth of cut (DOC) and cutting speed following in order of significance. This study focuses the machinability of surface roughness response to optimize the process parameters. Mahir et al. AKGÜN and DEMİR, (2020) aimed to optimize cutting conditions and perform a numerical analysis of flank wear during the milling of Inconel 625 superalloy. The results showed that feed rate was the most significant parameter affecting flank wear. This study focuses the experimental values after machining was considered. The machinability was measured in term of surface roughness response to optimize the process parameters. Cuong and Khanh (Lam Khanh and Van Cuong, 2021) studied the optimal input parameters for milling SCM440 steel. The objective was to analyze the impact of input factors on the surface roughness and the MRR during the milling process. The analysis of the results determined the impact of the input parameters on surface roughness and material removal rate (MRR). But this investigation used SR for optimizing the input parameters Vikas et al. Marakini et al. (2022) analyzed the impact of face milling procedures on the surface properties of AZ91 magnesium alloy using uncoated carbide inserts. The research also explored material behavior. Further, a time-domain analysis is conducted to establish a correlation between the machining vibration signals and surface integrity characteristics. This study investigates the tool behavior in surface finish. Silveira et al. (2023) analyzed the surface integrity of annealed AISI H13 steel concerning the impact of face milling parameters and tool grade. The study found that the milling force components were primarily influenced by the depth of cut and feed per tooth parameters. The EN 24 Steel with WC-Coated inserts is used in this investigation. Chen et al. (2023) This study comprehensively assessed the serpentine channel pouring (SCP) process, considering its impact on microstructure, mechanical properties, and yields. The application of numerical multiple-response optimization criteria was used to enhance the quality of semi-solid metal (SSM) slurry, thereby contributing to the advancement of the SCP process. This study emphasizes the potential benefits of using the comprehensive assessment concept and multiple-response optimization method in the mass-scale production and application of the SCP process. Chen et al. (2021) Investigated the Strong interfacial bonding and uniform GNP dispersion in the metallic matrix are hallmarks of AZ91D magnesium alloy-graphene nanoplatelets (AZ91D-GNPs) nanocomposites, which are produced through thixomolding. Microstructures, dispersibility of GNPs, and mechanical characteristics were analyzed as a function of injection velocity (V I) and the rotational speed of the screw (RS). Nanocomposites uniformly distributed GNPs by embedding them inside -Mg grains rather than only along their periphery. Due to the MgO nanoparticles’ strong bonding surfaces, GNPs and the alloy matrix created an Mg/MgO semi-coherency interface and MgO/GNPs contact. Hence, this investigation is unique and considerably important in machining EN 24 Steel with WC-Coated inserts.
The selection of EN 24 steel for this investigation is based on its remarkable material characteristics, which render it an ideal choice to perform machining experiments. EN 24 steel is renowned for its notable tensile strength, exceptional resistance to wear, and favourable machinability characteristics (Appoh and Yunusa-kaltungo, 2021; Liang et al., 2023a; Yang et al., 2023a). The inherent characteristics of this material present challenges for the machining process, and the optimisation of machining techniques for this material holds considerable potential for industrial applications, particularly in sectors that demand durable/robust components such as the aviation and automotive sectors (Yunusa-kaltungo et al., 2015; Luwei et al., 2017; Balali et al., 2023).
The relevance of this research to industrial applications is significant.
The EN 24 steel is widely employed in numerous engineering uses whereby components need the ability to sustain substantial loads and demonstrate resilience against wear, fatigue, damage, and strain (Appoh and Yunusa-kaltungo, 2021; Wu et al., 2022; Tang et al., 2023). The investigation concentrates around the optimisation of surface roughness in the machining process of EN 24 steel, that’s a material extensively employed across several sectors. This research addresses a significant issue within these industries. The findings of this study have the potential to immediately enhance the quality and performance of components manufactured employing EN 24 steels, consequently profiting manufacturers (Liao et al., 2020; Niu et al., 2022; Chen et al., 2024).
The focus of discourse is to the enhancement of machinability through the utilisation of coated inserts.
Utilising tungsten carbide (WC)-coated inserts in the process of machining EN 24 steel is a strategic decision. WC-Coated inserts are chosen based on their exceptional hardness and resistance to wear (Zhu et al., 2017; Fang et al., 2019a; Fu et al., 2020). These characteristics contribute to the prolongation of tool lifespan and enhancement of machining efficiency, particularly when working with tough materials such as EN 24 steel (Fang et al., 2019b). The selection of WC-Coated inserts is in accordance with the goal of enhancing machinability while retaining optimal metal cutting performance (Yang et al., 2022a).
Now, in order to examine the real-world applications of employing CVD TiAlN-coated carbide inserts for the machining of EN 24 steel.
1.1 Enhanced tool longevity/durability:
Carbide inserts coated with CVD TiAlN exhibit enhanced tool durability and prolonged tool lifespan owing to their exceptional resistance to wear. When employed in the machining of EN 24 steel, these inserts have the capacity to considerably diminish the frequency of tool replacements, consequently leading to reduced downtime within industrial operations or manufacturing processes (Yang et al., 2022b; Wang et al., 2023a; Liang et al., 2023b).
1.2 Enhancement of surface finish:
The application of TiAlN coatings results in the formation of a surface that is both smooth and possesses a high degree of hardness on the carbide inserts. The presence of a smooth surface facilitates the reduction of friction during the machining process, leading to enhanced surface finish on the workpiece. Components that undergo machining employing chemical vapour deposition (CVD) TiAlN-coated inserts have the potential to exhibit enhanced surface quality (Hua et al., 2022; Long et al., 2023; Su et al., 2023). This characteristic has considerable significance in sectors where both aesthetics and precision play a critical role.
1.3 Reducing expenses
Enhanced tool longevity and enhanced surface finish not only contribute to heightened productivity/performance efficiency, however, additionally resulted in financial economic benefits. A reduction in tool modifications leads to a drop in tooling expenditures, while an enhancement in surface quality diminishes the necessity for further post-processing and finishing processes (Gao et al., 2022; Li et al., 2022; Yang et al., 2023b).
1.4 The environmental consequences
The study indirectly aids in sustainability by enhancing the machining process through the utilisation of CVD TiAlN-coated inserts. The mitigation of tool wear and the extension of tool lifespan leads to a decline in the volume of tool disposals, therefore minimising the adverse environmental impacts related with the tool manufacturing and disposal processes (Xu et al., 2023a; Yang et al., 2023c; Meng et al., 2023).
All in all, the authors’ rationale for choosing EN 24 steel as the material for their workpiece and employing CVD TiAlN-coated carbide inserts in their investigation is substantiated by scientific and practical considerations (Rahman et al., 2019). The study focuses on addressing significant concerns related to the machining of difficult materials, with the aim of providing possible advantages to many sectors and contributing to the progress of machining technology.
The novelty of that investigation was that the promising coating materials were considered to minimize tool wear by maintaining consistency of tool profile for a long time to perform well with extended tool life by means of hybrid coating of TiAlN and CVD to cut with superior performance in machining commercial steel materials. This work aims to investigate the impact of process variables on surface irregularities in the machining of EN 24 steel with CVD TiAlN-coated carbide inserts. DOE based on Central Composite Designs (CCD) of RSM was generated in Design Expert 13 analysis software, which was deployed for optimization techniques. Identifying optimal machining conditions (feed rate, cutting speed, cutting fluid, and depth of cut) for minimum surface roughness which is an output parameter. In addition, regression analyses and multi-optimization were utilized to predict the experimental value. Lastly, confirmation experiments test the reliability of developed models.
The novelty of this investigation is the commercial material of EN 24 steel surface milling with coated WC inserts embedded tool is experimented and operating parameters like feed rate, cutting speed, cutting fluid, and depth of cut were optimized with the use of response surface methodology for CNC milling so that high-rate production and high quality are ensured. The mathematical model was developed to be personalized as per business requirements and ensured its accuracy through confirmation experiments. The tool wear study was also conducted and analysed through SEM analysis. Hence, this investigation is unique and novel in the surface milling of N24 steelworks.
2 Experimental methodology
2.1 Workpiece and tool insert material
Selecting workpiece and tool insert is essential because both considerably impact responses. EN24 steel (length 100 mm, width 45 mm, and thickness 20 mm) was used as a work sample, and coated WC inserts were used in the present experimental study. Quaker Houghton (semi-synthetic) oil was employed as a coolant (30 lit/min) for CNC milling machining. Figure 1 shows machined workpiece samples. The composition of the work sample is shown in Figure 2.
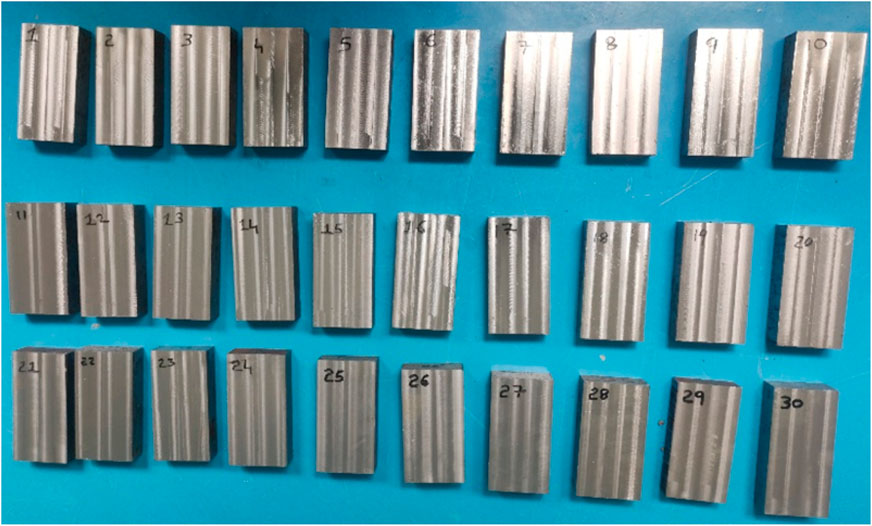
FIGURE 1. Machined workpiece.
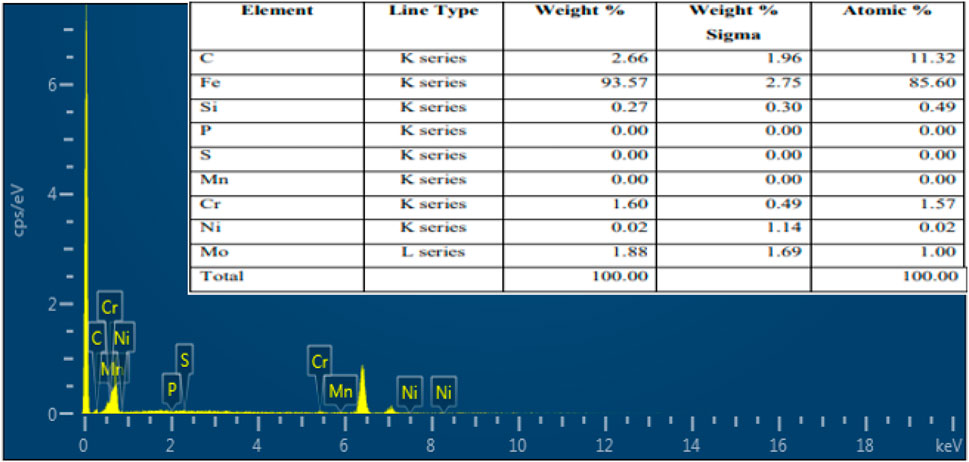
FIGURE 2. A spectrum of EN 24 Steel.
2.2 Experimental setup
The experiment was carried out on HURCO VM1O CNC Milling Machine (VMC), Figure 3 shows the experimental setup CNC Milling Machine.
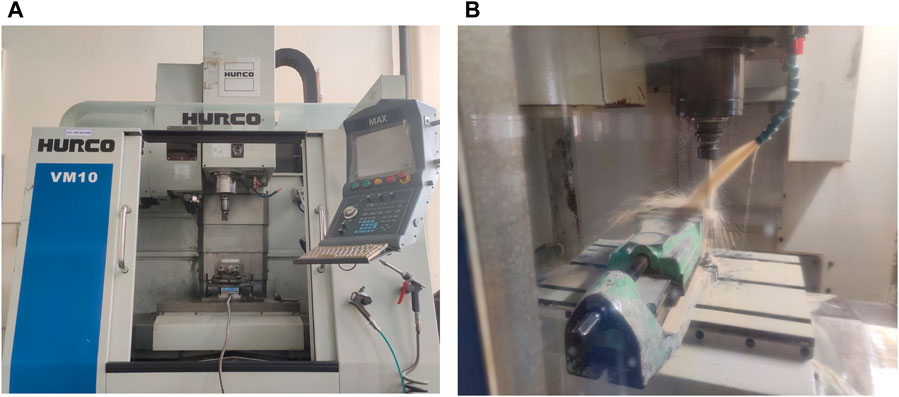
FIGURE 3. (A) CNC milling machine set up (B) CNC milling operation.
2.3 Experimental design
Response surface methodology-based CCD method is applied for developing the design of the experiment (DOE) by Design-Expert 13 software. Four parameters were chosen for this experiment. The pilot studies performed using the One factor-at-a-time approach (OFAT) helped to give the proper ranges of the input variables for the CNC milling machining, as shown in Table 1.

TABLE 1. Process parameters and their levels.
The experimental run order is generated by Response surface methodology with the CCD given 30 experimental runs, and experiments conducted according to the order of the run are depicted in Table 2.
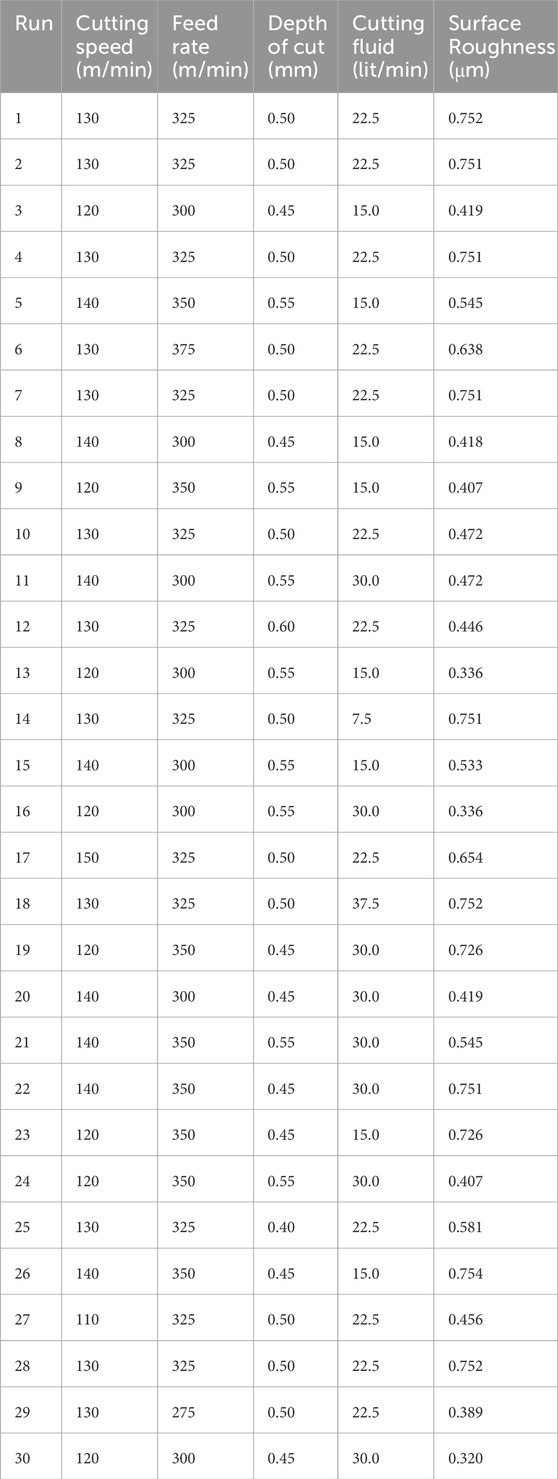
TABLE 2. Central Composite Designs with process parameters of milling of EN24 steel.
3 Results and discussions
3.1 Surface roughness
The selection of the Ra model for all experimental conditions is determined by referring to Table 3. The quadratic model seems significant and not aliased with the highest-order polymer. It is suggested to use quadratic models for response parameters in all experimental conditions. The sequential sum of squares measures the contribution of terms of increasing complexity to the model (Kiranakumar et al., 2022; Lashin et al., 2022; Kumar et al., 2023c). This test selects the ultimate polynomial order with no aliased terms. The estimated model terms will be aliased if the design only gives a few points or selects the incorrect points. The analysis cannot separate them. In general, the model with the greatest F-value and the lowest p-value is chosen.
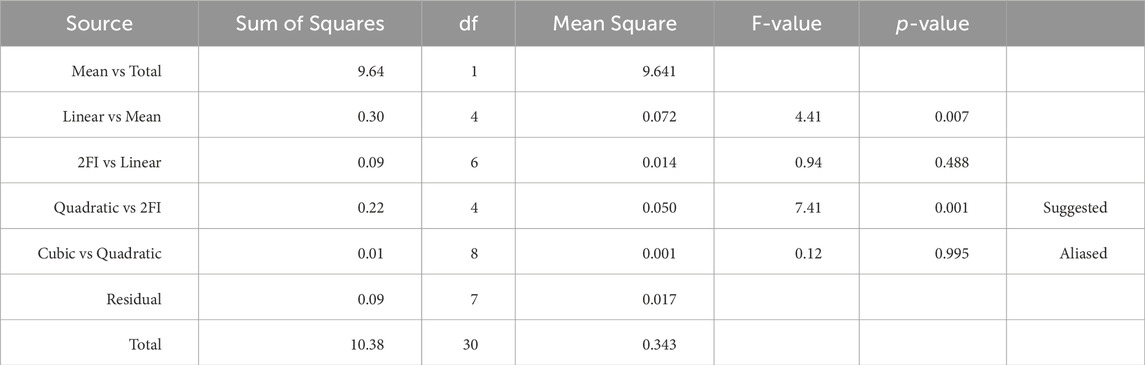
TABLE 3. Selection of model for average surface roughness (Ra).
3.2 Analysis of variance
The idea of utilizing ANOVA is to break down the total variability of the experimental data into components of variance and then assess their significance (Sehar et al., 2022; Prasanthi et al., 2023). A quadratic model was selected for the surface integrity of the machining of EN 24 steel. The developed model was tested using ANOVA for its significance. The test for lack of fit was accomplished for the significance of the regression model. The ANOVA for surface roughness machining of EN 24 steel is illustrated in Table 4.
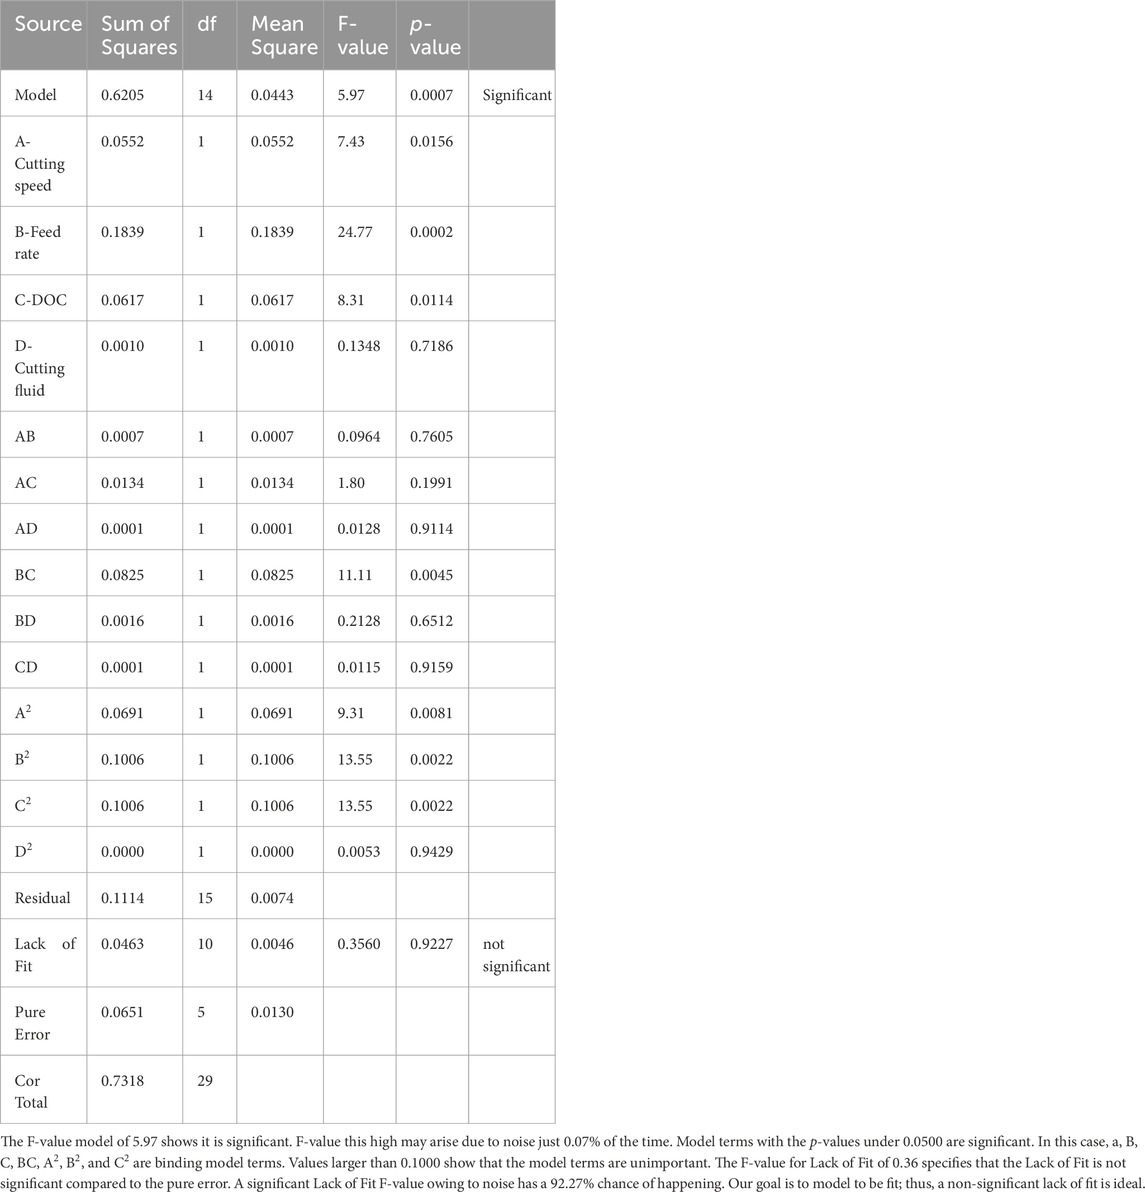
TABLE 4. ANOVA for MRR of machining of EN 24 steel.
R2 is a statistic that provides information on the fit of the regression model; the R2 coefficient of identification is a measurable statistic of how fit the regression line corresponds to the actual data point (Ganeshkumar et al., 2023; Kumar et al., 2023). An R2 of 1 implies that a regression line fits the data exactly. Table 5 illustrates the R-square Table for Surface irregularity.

TABLE 5. R-square table for Surface Roughness of Machining of EN 24 steel.
A predicted R2 of 0.5074 is accepted reasonably with an Adjusted R2 of 0.7058, and the variance is less than 0.2. Adeq. Precision measure signal-to-noise ratio. A ratio larger than 4 is preferable. The signal-to-noise ratio of 7.727 suggests a good signal. This method helps navigate the design space.
3.3 Mathematical modelling and regression analysis
Models were created for every response function, and statistical analysis of variance was performed on the experimental data (Shahid et al., 2022; Vemanaboina et al., 2023). Below are the regression equations that express the output parameters regarding the actual factors. The mentioned equations are applicable for forecasting the outcome corresponding to specific levels of individual factors. The regression equation for surface roughness of machining of EN 24 Steel is identified from the linear regression in equation 1.
“Surface Roughness = - 31.4705 + 0.114335 * A + 0.0975075 * B + 34.2237 * C - 0.0244361 * D - 0.000027* AB + 0.057875 * AC + 0.000033* AD - 0.05745 * BC + 0.000053* BD + 0.00616667 * CD - 0.000501979 * A2 - 0.000097* B2 - 24.2292 * C2 - 0.000021* D2” - (1).
Positive values denote an excellent effect on optimization, whereas negative values indicate a negative correlation between the parameter and the response. The equations mentioned above demonstrate that the output variables are impacted by parameters such as Cutting speed, Feed rate, Depth of cut, and Cutting fluid.
Figure 4A shows the predicted vs. actual value of the surface irregularities. The graph illustrates that the actual model of surface roughness developed is near the predicted theoretical values generated during the experimental performance, which can be validated easily by seeing the spread of the actual values to the predicted actual line. According to the predicted models (Equations (1)), the calculated predicted values for SR Figure 4A, were compared to the actual values. There is a modest misalignment between the data points, but the predicted and actual data points are close to the y = x optimal line. Figure 4B shows a perturbation graph for the surface roughness, which will assist in comparing the influence of various variables at a suitable point location in the design area. The output is characterized by varying each factor within its given range during possession, keeping all variables constant (Singh et al., 2023a; Dikshit et al., 2023; Singh et al., 2024). A steeply inclined slope or curvature in the characteristic curve shows the input parameter factor as the response is sensitive to the output parameter surface roughness. As closeness to a flat line displays insensitivity to make a difference in that specific factor (Amoljit Singh et al., 2020; Paswan et al., 2023).
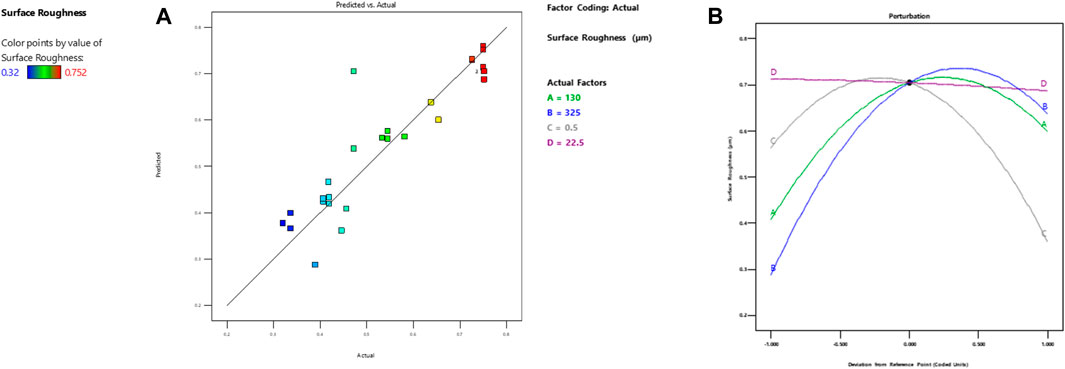
FIGURE 4. (A) Predicted vs. actual value of the Surface Roughness; and (B) Perturbation graph for the Surface Roughness.
Figure 5A illustrates the relationship among residuals and predicted values of surface roughness.
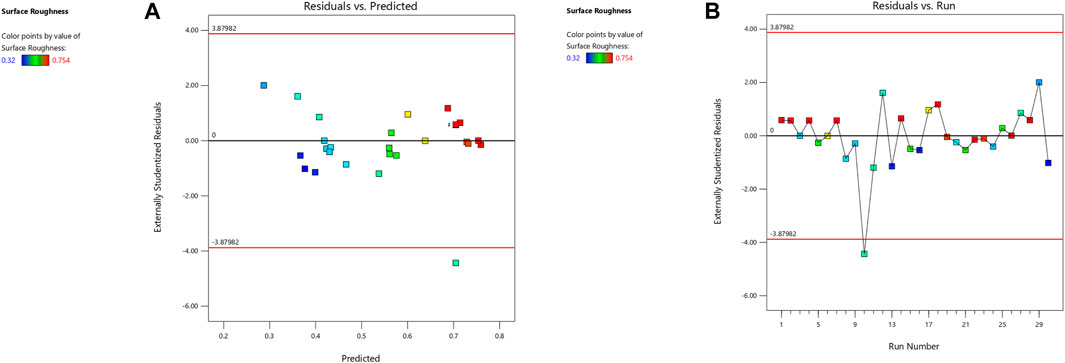
FIGURE 5. (A) Residuals vs. Predicted value of the Surface Roughness; and (B) Residuals vs. Run value of the Surface Roughness.
Figure 5A depicts the relationship among the residuals, which indicate the variations among the actual experimental values and the values predicted by the mathematical models, and the expected values of surface roughness. The application of this visualisation graph is crucial in evaluating the adequateness, precision, adequacy, and goodness of fit of the formulated mathematical models (Singh et al., 2023b; Zhang et al., 2023). The following is a comprehensive elucidation:
i. Scattered Data Points: Figure 5A illustrates the presence of randomly distributed data points around the horizontal axis, which represents the projected values of surface roughness. The widespread scattered or dispersion of data points suggests the absence of any discernible systematic structure or consistent deviation in the residuals when compared to the predicted values (Raj et al., 2022; Xu et al., 2022; Saravanan et al., 2023). This observation is indicative of a favourable outcome as it implies that the models possess the ability to effectively capture the broad spectrum of variations for the response variable, specifically surface roughness.
ii. Regression Assumption Validation: The validation of regression assumptions is an essential step in the analysis of regression models. One critical assumption to examine is homoscedasticity, which pertains to the constancy/consistency or uniformity of residual variability over all predicted values (LIU et al., 2021; Singh et al., 2022; Wang et al., 2023b). Figure 5A demonstrates the fact that the distribution of data points remains constant while the projected values vary, suggesting that the presumption hypothesis of homoscedasticity remains valid thus the model predictions can be considered valid.
iii. Goodness of Fit: The measure of goodness of fit may be assessed by examining the dispersion of residuals around the zero point on the horizontal axis, which indicates that the models are generating unbiased predictions (Cui et al., 2021; Khan Aqib et al., 2021). In other words, the models exhibit neither a consistent tendency to overestimate nor underestimate the actual levels for surface roughness. This finding provides evidence that the suggested models are suitable for predicting surface roughness within the specific experimental parameters.
Figure 5B depicts the relationship correlation among residuals and run values for surface roughness.
Figure 5B displays a figure whereby the residuals are graphed against the run values, which represent the experimental run numbers or conditions under which the data points were collected. The chart presented beyond provides valuable information into the extent to which the models accurately capture the variations in surface roughness observed across numerous experimental trials (Pramanik et al., 2021). The following is a comprehensive elucidation:
i. Random Distribution of Residuals: Comparable to its depiction in Figures 5A, B exhibits a random distribution of residuals into the horizontal axis, which represents the run values. This finding suggests that the models do not exhibit any consistent systematic bias when tested under various conditions of experimentation (Kumar et al., 2022). In other words, the predictive abilities of the models remain consistent in assessing surface roughness irrespective of the particular experimental-run.
ii. Model Consistency: The presence of randomly distributed residuals in Figure 5B indicates that the developed models exhibit consistency, uniformity, reliability, and retain their ability to predict across all experimental conditions. The ensuring of consistency is of utmost significant in order to facilitate the utilisation of models for optimisation objectives over a wide range of parameters (Aggarwal et al., 2020; Narayan et al., 2022).
iii. Optimization Criteria: The reference of optimisation criteria pertains to the primary goal of the research, which is to minimise surface imperfections or defects or failures, specifically surface roughness. The observation that the residuals demonstrate a random distribution within the range of −2 to +2 nearly provides evidence in favour of the proposition that the experimental design and models employed are appropriate for attaining the objective of optimisation. The findings indicate that the models have the potential to be utilised in determining the most optimal-amalgamation combination of factor-levels that result in a significant reduction in surface roughness (Garg et al., 2022; Sharma and Sudhakara, 2019; Gong et al., 2023).
Figures 5A, B depict the residuals of models plotted against the predicted models for all experimental conditions. The figures demonstrate that the data points are dispersed, indicating the absence of a discernible trend. This supports the conclusion that the developed models are appropriate for the current study (Hu et al., 2023). The error percentage was calculated by comparing the predicted and experimental values. The outcomes indicate a high concurrence between the predicted and obtained optimized values. If the regression assumption holds, approximately 95% of data points are expected to fall within 2σ of the fitted curve. Approximately 95% of the standardized residuals are expected to exhibit random distribution within the range of −2 to +2. Therefore, the experimental design is appropriate for the study. The optimization of the SR model focuses on minimizing surface irregularities (Xu et al., 2023b). This process involves determining the optimal combination of factor levels that satisfy the optimization criteria for both response and input factors (Liang et al., 2023b).
3.4 Contour plot
The contour plot is a 2D depiction of the response plotted against numeric factors and mixed component combinations (Appoh and Yunusa-kaltungo, 2021; Yang et al., 2023a; Balali et al., 2023). It can illustrate the link between responses, mixture components, and numerical variables. Figures 6A–F illustrates the contour plot for surface roughness. Here blue colour in the graph represents the lowest value and the red colour value represents the highest values.
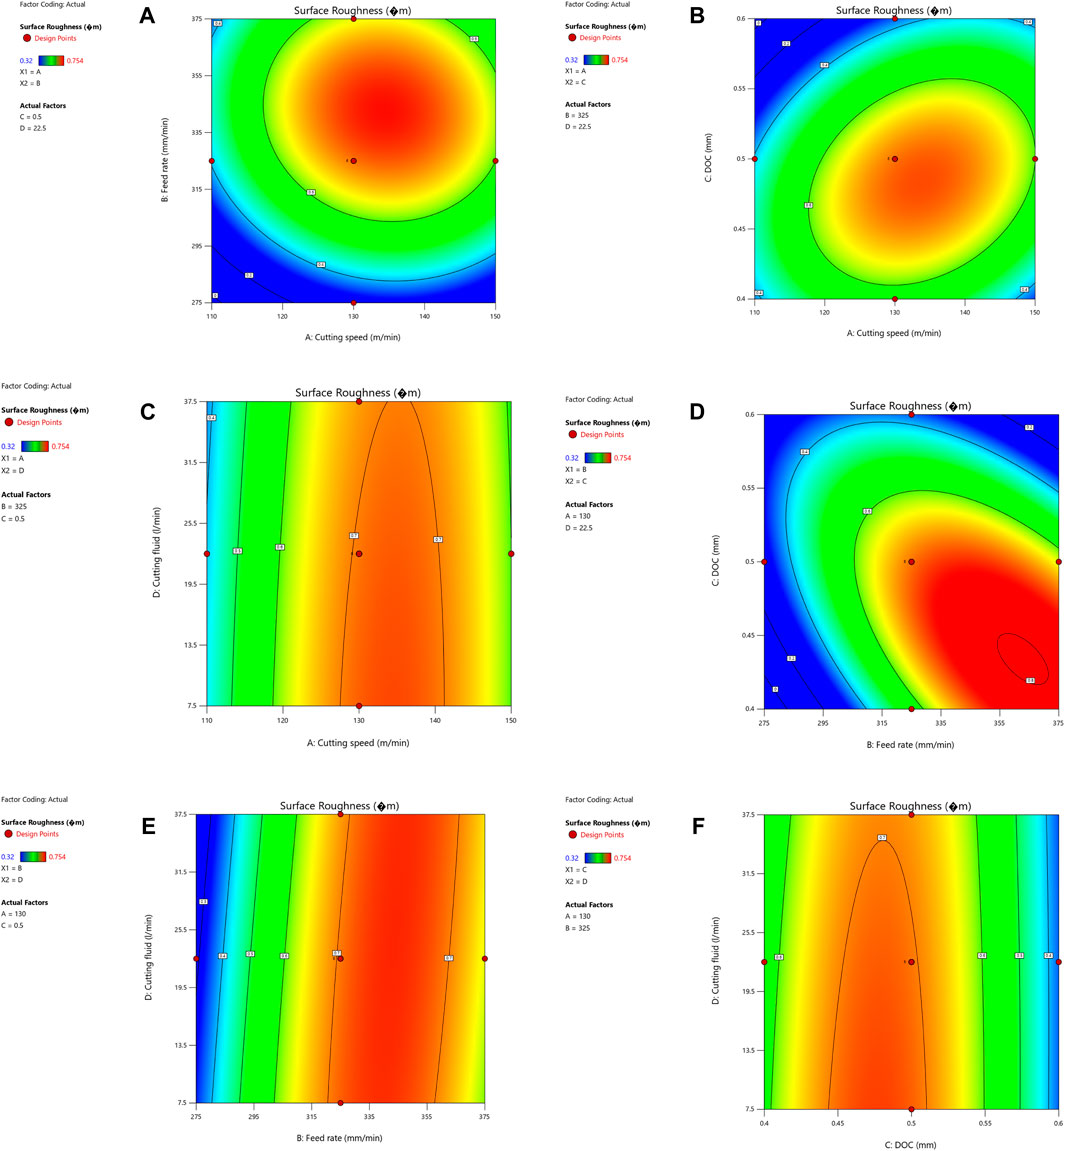
FIGURE 6. (A–F) Contour plot between two parameters of surface roughness.
The contour plot in Figure 6A depicts the correlation among surface roughness and two significant machining parameters, namely feed rate and cutting speed. The following is a comprehensive elucidation:
The color-coded contours depict the surface roughness values corresponding to various combinations of feed rate and cutting speed. The blue regions on the surface correlate to lower degrees of surface roughness, whilst the red regions show greater amounts of surface roughness.
The primary goal in the field of machining frequently revolves on the minimization of surface roughness. Inside this plot, it was conceivable to observe the presence of a distinct area characterised by blue contours. This particular region implies that a reduction in surface roughness may be attained by acting inside its regions/boundaries (Yunusa-kaltungo et al., 2015; Luwei et al., 2017). The provided information holds significant value in the context of optimising machining operations.
The impact of interaction may be revealed through the utilisation of contour plots, which provide a visual representation of the relationship among input parameters (Appoh and Yunusa-kaltungo, 2021). For instance, in a given region exhibiting elongated or distorted contours, it may be inferred that the interaction among feed rate and cutting speed exerts a substantial influence on the resulting surface roughness. This information serves as a guiding framework for the optimisation of processes.
Figure 6B provides a contour plot illustrating the relationship among the depth of cut and cutting speed.
Figure 6B displays a contour map that investigates the interaction relationship among the depth of cut and cutting speed in relation to surface roughness. This analysis is conducted while maintaining a constant feed rate and cutting fluid.
The color-coded contours in accordance with Figure 6A illustrate the impact of variations in depth of cut and cutting speed on surface roughness.
The optimal zone may be observed in a comparable way as depicted in Figure 6A, where an array of blue contours can be discerned, indicating lower values of surface roughness. The figure provided in this study illustrates that certain combinations of depth of cut and cutting speed yield more favourable outcomes in terms of generating smoother surfaces (Chu et al., 2023; Sun et al., 2023).
The presence of contour distortion or elongation, if detected, would suggest the existence of interaction effects among the variables of depth of cut and cutting speed (Li et al., 2023). These interaction effects should be taken into account during the process optimisation phase.
A contour plot depicting the relationship among cutting fluid and cutting speed appears in Figure 6C.
Figure 6C presents a contour map that examines the impact of cutting fluid and cutting speed on surface roughness, while maintaining a constant depth of cut and feed rate.
The utilisation of colour coding is employed in this study to visually represent the impact of cutting fluid and cutting speed on surface roughness.
Similarly, to prior visual representations, the regions delineated by blue outlines signify the advantageous amalgamation of cutting fluid and cutting speed parameters, hence facilitating the attainment of reduced surface roughness (Li et al., 2023; An et al., 2024).
Contour line distortions can serve as indicators of interaction effects between cutting fluid and cutting speed, thereby necessitating their consideration in the optimisation process.
A contour plot illustrating the relationship between feed rate and depth of cut is presented in Figure 6D.
Figure 6D presents a contour map that investigates the correlation among feed rate and depth of cut on surface roughness, while maintaining a constant cutting speed and cutting fluid.
The use of colour coding in this study enables the visual representation of the impact of variations in feed rate and depth of cut on surface roughness.
Regions with blue contours highlight combinations of feed rate and depth of cut that result in lower surface roughness.
The examination of contour shape alterations can provide insights into the presence of interaction effects among feed rate and depth of cut, necessitating cautious consideration during optimisation attempts.
Figure 6E analyses the influence of feed rate and cutting fluid on surface roughness while retaining cutting speed and depth of cut constant:
The utilisation of colour coding is employed to visually represent the impact of variations in feed rate and cutting fluid on the surface roughness.
The regions delineated by blue outlines on the graph represent the optimal combinations of feed rate and cutting fluid leading to reduced surface roughness.
The presence of distortions in contour lines suggests the potential of interaction effects among the variables of feed rate and cutting fluid.
A contour plot illustrating the relationship among the depth of cut and the use of cutting fluid is presented in Figure 6F.
Figure 6F investigates the correlation among the depth of cut and the use of cutting fluid on surface roughness, while maintaining a constant cutting speed and feed rate.
Color-coded contours depict the influence of variations in depth of cut and cutting fluid on surface roughness.
Regions with blue outlines indicate combinations of depth of cut and cutting fluid that resulted in dropped surface roughness.
Distortions in contour lines suggest potential interaction effects among depth of cut and cutting fluid.
Figure 6A depicts a contour plot for surface roughness vs. feed rate and cutting speed. This plot maintains a constant cut depth and cutting fluid. Figure 6B depicts a contour plot for surface roughness against the cut and cutting speed depth. In this plot, the feed rate and cutting fluid are held constant. Figure 6C. Illustrates the contour plot of surface roughness vs. cutting fluid and cutting speed. This figure holds the depth of cut and feed rate constant. Figure 6D demonstrates a contour plot of surface roughness vs. cut and feed rate depth. In this plot, the cutting speed and fluid are held constant. Figure 6E depicts a contour plot of surface roughness vs. cutting fluid and feed rate. In this plot, cutting speed and depth of cut are held constant. Figure 6F displays a contour plot of surface roughness vs. cutting fluid and depth of cut. In this plot, cutting speed and feed rate are constant.
3.5 Surface plot
The surface plot is a 3D depiction of the response plotted against numeric factors and mixed component combinations. It can illustrate the link between responses, mixture components, and numerical variables. The surface plot for surface roughness is illustrated in Figures 7A–F.
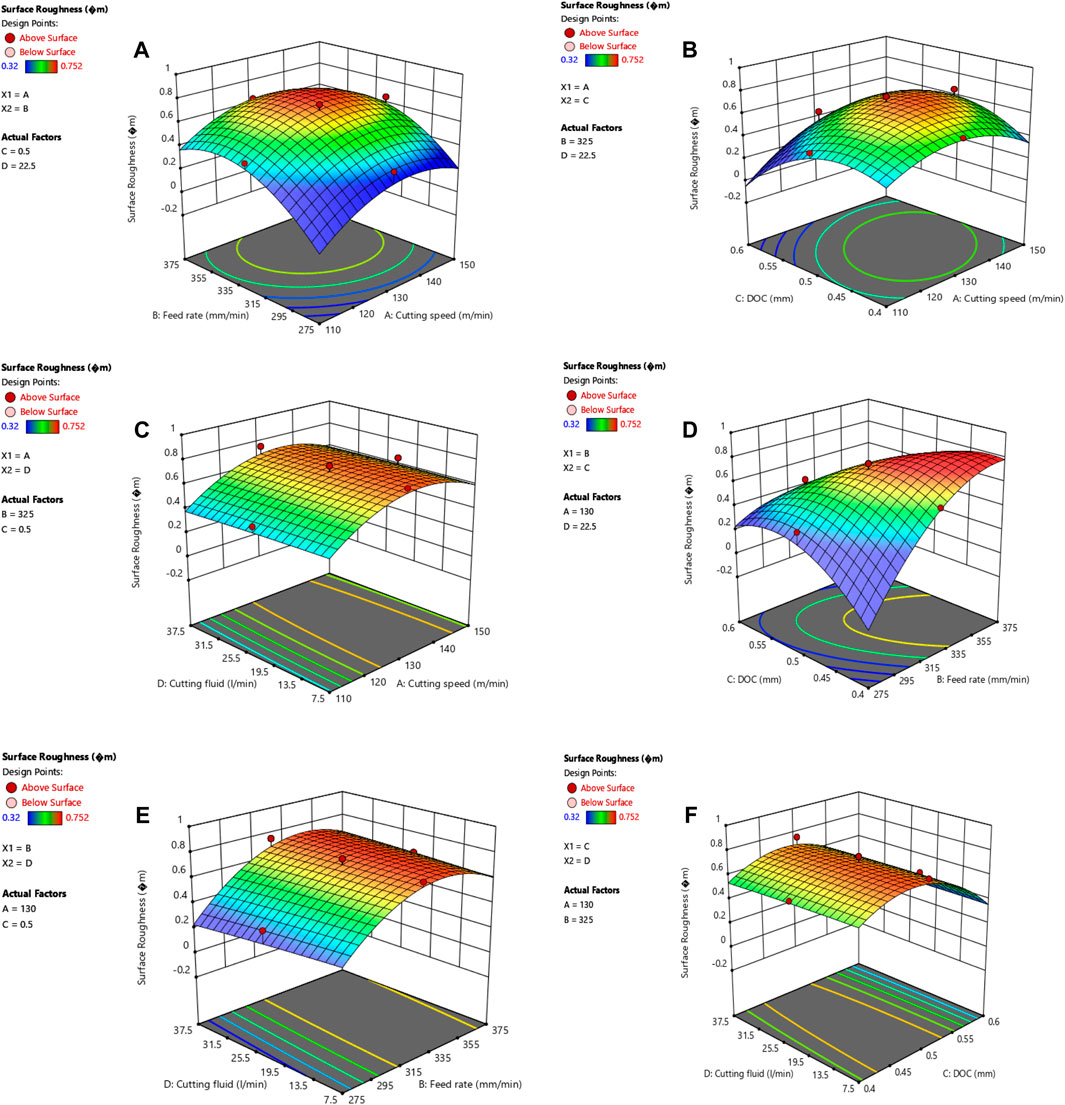
FIGURE 7. (A–F) Surface plot between two parameters of surface roughness.
Figure 7A depicts a surface plot for surface roughness vs. feed rate and cutting speed, depth of cut and cutting fluid are maintained constant in this plot. SR decreases with the increase of cutting speed and it slightly grows initially and then decreases with the further rise of feed rate. Figure 7B depicts a surface plot for surface roughness against depth of cut and cutting speed. In this plot, the feed rate and cutting fluid are held constant. As the cutting speed and DOC increase the SR increases and then decreases. Figure 7C Illustrates the surface plot of surface roughness vs. cutting fluid and cutting speed. This figure holds the depth of cut and feed rate constant. SR decreases with the increase of cutting speed and it slightly grows initially and then decreases with the further rise of cutting fluid. Figure 7D demonstrates a surface plot of surface roughness vs. cut depth and feed rate. In this plot, the cutting speed and fluid are held constant. SR increases with the rise in cut depth and feed rate. Figure 7E depicts a surface plot of surface roughness vs. cutting fluid and feed rate. In this plot, cutting speed and depth of cut are held constant. SR decreases with the increase of feed rate and it slightly grows initially and then decreases with the further rise of cutting fluid. Figure 7F displays a surface plot of surface roughness vs. cutting fluid and depth of cut. In this plot, cutting speed and feed rate are constant. In this plot, the SR increases slightly beginning with the rise in cutting fluid and depth of cut and drastically decreases lastly.
Figure 8 displays a comparison between the measured surface roughness results obtained from the experiments and the predicted values created by the model. The bar chart highlights that the thirtieth experimental run had the lowest surface roughness values. Furthermore, it indicates that the observed surface roughness values of the experimental runs were closer to the predicted values. The experimental runs were conducted using high-precision, non-contact measurements to quantify the surface integrity of the profile. The minimum recorded surface roughness was 0.32 µm, whereas the predicted surface roughness was found to be 0.37 µm. All thirty runs were significantly impacted by four parameters and four levels. Each run corresponds to the observed surface roughness values within distinct ranges. Surface roughness values ranging from 0.320 µm to a maximum of 0.754 µm were attained.
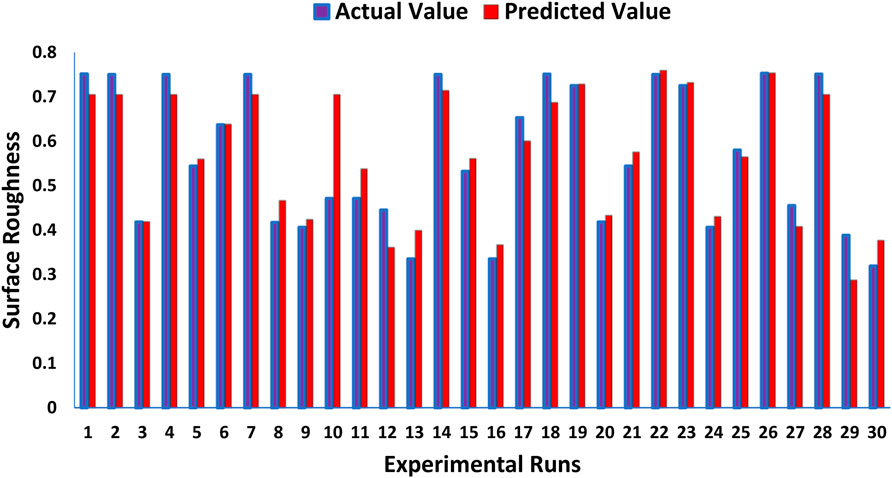
FIGURE 8. Experimental runs vs. Experimental and predicted surface roughness.
The range of parameters, goals, limits, and importance for all conditions of experiments is shown in Table 6. Goals and limits were set for each response to assess their influence on overall desirability accurately. The highest or lowest level for each response characteristic needs to be optimized. The multi-response optimization was achieved through the desirability function. Weights were assigned to emphasize a target value, the upper or lower bounds, or both. The importance of each response is assigned to the other responses. Importance varies from the least important (1) to the most important (5).
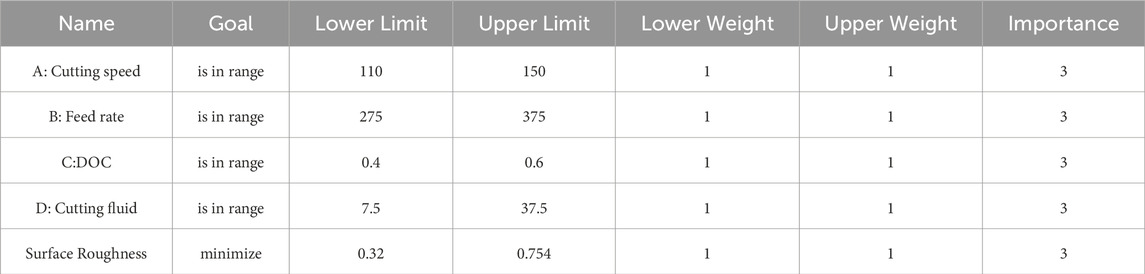
TABLE 6. Range of parameters for desirability.
3.6 Confirmation experiments
Confirmation experiments were conducted to ensure the optimal combination of input parameters for surface roughness. The proposed numerical model of the process was validated through experimentation conducted under identical machining conditions as the simulation results. The error rate of the experimental and predicted values for the optimal configuration was also computed. The experiment’s confirmation error has a confidence level of 95%, demonstrating the accuracy of the predicted models. The Table 7 has exhibited the optimal set of input processing parameters.
A high-quality JEOL JSM-6510 LV Series SEM set to 15 kV was used to examine the surface morphologies and micrographs of the treated inserts. Figures 9A, B illustrates the SEM analysis of the machined workpiece surface at CS 130 m/min, FR 325 mm/min, DOC 0.50 mm, and CF 22.5 L/min.
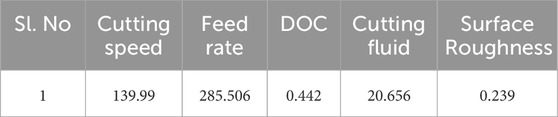
TABLE 7. The optimal set of input parameters.
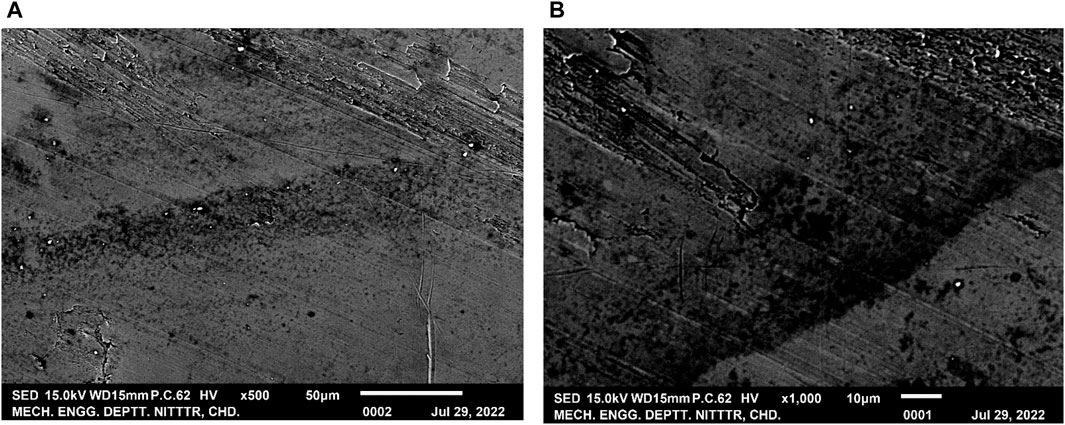
FIGURE 9. (A, B) SEM picture of machined workpiece (at CS 130 m/min; FR 325 mm/min; DOC 0.50 mm; CF 22.5 L/min).
SEM micrographs provide the visual evaluation of the impact of various cutting parameters on the surface of the machined material. At a cutting velocity of 130 m per minute, a discernible modification in the surface topography was noticed in comparison to lower velocities. The raised cutting speed is presumed to have contributed to a rise in tool wear, which may be ascribed to rising temperature and wear rates. This phenomenon may be rationalised by the observation that higher cutting speeds produce enhanced heat production as a result of rising friction among the cutting tool and the workpiece. Consequently, this enhanced heat generation contributes to a more pronounced adherence of material to the cutting tool edge.
The role of cutting fluid in machining processes.
The maintenance of a consistent flow rate of 22.5 L per minute of cutting fluid is of paramount significance for ensuring the maintenance of surface integrity. The utilisation of SEM images revealed that when an appropriate flow rate was employed, the cutting fluid demonstrated a notable reduction in temperature at the cutting interface. Additionally, it allowed the efficient removal of chips, resulting in an enhanced surface finish characterised by enhanced smoothness. The scientific rationale behind this phenomenon can be attributed to the cooling and lubricating characteristics demonstrated by the cutting fluid. These attributes effectively mitigate tool wear and minimise friction.
a. Microstructural alterations: SEM images can offer valuable insights into the alterations in microstructure caused by machining processes. Deformation bands and recrystallized grains were detected in close proximity to the machined surface while employing a depth of cut measuring 0.50 mm. Plastic deformation and dislocation formation within the material were induced by the substantial mechanical forces associated with the milling process. Grain recrystallization occurred as a result of the heat generated during the machining process. This phenomenon has been extensively reported in the field of materials research and is substantiated by the observations of microstructure.
b. Mechanisms of Tool Wear: The SEM analysis may be employed to analyse the wear scratching patterns observed on the cutting edge of the tool. The findings of this study indicate that the SEM micrographs demonstrated the presence of flank wear and crater wear on the WC-Coated Inserts. Flank wear is a phenomenon that arises as a consequence of abrasion caused by the contact among the cutting tool and the workpiece. On the other hand, crater wear is an appearance that emerges from interactions at higher temperatures. The wear processes discovered in the present investigation correspond to the observed wear behaviour of WC-Coated Inserts in high-speed machining operations.
The SEM microstructure of the machined workpiece at CS 120 m/min, FR 350 mm/min, DOC 0.45 mm, and CF 15 L/min is shown in Figures 10A, B. These images were captured at a high magnification level (i.e., 500x, 1000x).a. The impact of cutting parameters: The examination for SEM micrographs provided valuable information into the surface integrity of EN 24 Steel when subjected to the specified machining conditions. The use of a reduced cutting speed of 120 m/min, together with a moderate feed rate of 350 mm/min and a depth of cut of 0.45 mm, yielded discernible surface characteristics. Reducing the cutting speed has the effect of minimising the thermal load on both the tool and workpiece, hence reducing the probability of tool wear and resulting in a more refined machined surface.b. The role of cutting fluid in machining processes: The maintenance of surface integrity is contingent upon the inclusion of cutting fluid at a flow rate of 15 L per minute. The SEM images provided visual evidence of the effectiveness of the cutting fluid in both heat dissipation and prevention of adhesion among the tool and workpiece. Consequently, this phenomenon played a role in facilitating a more efficient process of chip formation, and mitigating the prevalence of built-up edge (BUE). The scientific rationale for this practise is rooted in the realisation that the provision of sufficient cooling and lubrication through the use of cutting fluid is essential for preserving the longevity of the tool and attaining the required quality of the surface finish.
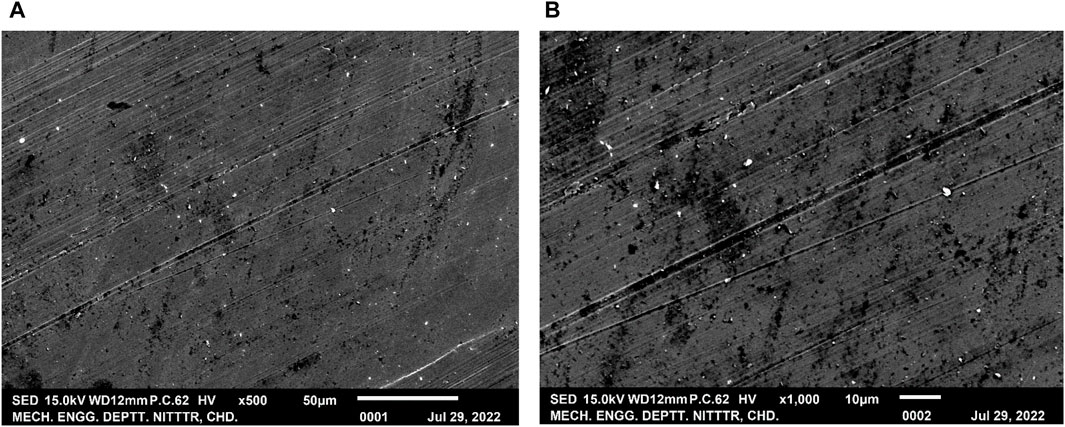
FIGURE 10. (A, B) SEM picture of machined workpiece CS 120 m/min; FR 350 mm/min; DOC 0.45 mm; CF 15 L/min.
The scientific mechanisms and rationales for the aforementioned trend has been exhibited as follows,
3.6.1 Microstructural changes
The SEM images revealed microstructural variations that are related to the machining process. Upon performing experiments with a depth of cut of 0.45 mm, we noticed an appearance of localised plastic deformation, a slight rise in material hardness caused by work hardening, and a limited reduction in grain size in the vicinity of the machined surface. The aforementioned observations correspond with the anticipated mechanical deformation that occurs during the process of machining. The depth of cut, which was substantially lower, had a significant impact on limiting the magnitude of plastic deformation. This is consistent with the fundamental principles of metal cutting and the field of material science.
3.6.2 Mechanisms of tool wear
The utilisation of SEM analysis facilitated the evaluation of the tool’s advanced technology in order to detect any indications of deterioration. The micrographs shown in this study revealed the presence of mild flank wear and minimal crater wear on the WC-Coated Inserts. The observed wear, which was limited in nature, aligns with the selected machining parameters. These parameters are specifically designed to prioritise reduced tool wear by employing lower cutting speeds and optimising chip formation. This assertion is substantiated by extensively reported wear processes observed in milling operations.
The surface integrity-determining machine used for analysing surface integrity is the Contour GT-K 3D surface profilometer. This profilometer has been designed to provide high-precision, non-contact measurement of a surface profile to quantify its surface integrity. Crucial dimensions such as curvature, step, and flatness are computed from the surface topography. Profilometry is a method of extracting topographic features from the texture of a surface. It can be a single data point scan, a three-dimensional scan, or a line scan. Profilometry is utilized to find the morphology of machined surfaces and surface irregularities are shown in Figure 11A. It can be done with a physical probe or with a light. Figure 11B shows the profile graph of surface roughness, where X profile graph variation of X at 124.1831 m, Z at 0.4417 m, and Y profile graph variation of X at 940.1467 m, Z at 0.7784 m is achieved to attain the minimum surface integrity.
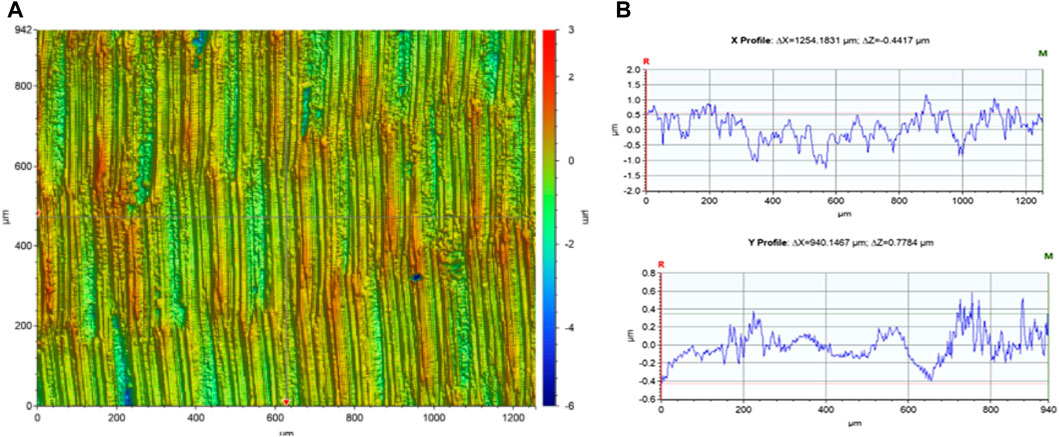
FIGURE 11. (A) Surface profile; and (B) Profile graph of surface roughness.
4 Conclusion
This experimental study examines the effect of process parameters on surface roughness during milling EN 24 steel with tungsten carbide (WC) coated inserts. An increase in tool hardness improves machinability and helps maintain high metal cutting performance. Through a hybrid coating, this was fabricated, tested, and ensured improved performance while cutting the EN24 steel. The design of experiments using Central Composite Designs (CCD) of RSM was generated in Design Expert 13 software deployed for analysis, and a total of 27 experimental trials were conducted under various input parameter settings. The EN 24 specimen was used in this research work. It finds broad applicability in various fields due to its high strength and wear resistance. Before experiments, the chemical composition of the workpiece specimen was determined by the EDX technique. Tungsten carbide with a coating of TiAlN tool insert has been selected for this study because of its greater ductility and an excellent choice for interrupted cuts. SEM analysis examines the surface microstructure after machining the workpiece at high magnification (i.e., 500x and 1000x). A surface profilometer is deployed to examine the surface irregularity of the workpiece. The following conclusions are drawn from experimental work and optimization result analysis:
i. The optimal surface roughness value is 0.209 μm at a cutting speed of 139.9 m/min, a feed rate of 285.506 mm/min, a depth of cut of 0.442, and a cutting fluid flow rate of 20.656 L/min
ii. The feed rate had a more significant influence on the surface roughness than other variables.
iii. The observed results were analyzed in terms of regression models using ANOVA. The developed models were able to predict the results with reasonable accuracy. The R-square values for all models were observed to be greater than 0.95.
iv. An optimum parameter for machining EN 24 steel was obtained and validated experimentally. Confirmation experiments have been conducted to validate the analytical part of the study. The investigational findings attained after experimentation are closer to the predicted findings. The developed models are suitable for predicting the results with reasonable accuracy.
Data availability statement
The original contributions presented in the study are included in the article/supplementary material, further inquiries can be directed to the corresponding authors.
Author contributions
SP: Conceptualization, Formal Analysis, Investigation, Methodology, Writing–original draft. TS: Conceptualization, Formal Analysis, Investigation, Methodology, Writing–original draft. PSR: Conceptualization, Formal Analysis, Investigation, Methodology, Writing–original draft. MSP: Conceptualization, Formal Analysis, Investigation, Methodology, Writing–original draft. VV: Conceptualization, Formal Analysis, Investigation, Methodology, Writing–original draft. SR: Conceptualization, Formal Analysis, Investigation, Methodology, Writing–original draft. SS: Conceptualization, Formal Analysis, Funding acquisition, Investigation, Methodology, Project administration, Supervision, Writing–original draft, Writing–review and editing. AK: Conceptualization, Formal Analysis, Funding acquisition, Writing–review and editing. MA: Formal Analysis, Funding acquisition, Supervision, Writing–review and editing. EM: Validation, Formal Analysis, Funding acquisition, Supervision, Writing–review and editing.
Funding
The author(s) declare that no financial support was received for the research, authorship, and/or publication of this article.
Acknowledgments
The authors extend their appreciation to the Deanship of Scientific Research at King Khalid University (KKU) for funding this research through the Research Group Program Under the Grant Number: (R.G.P.2/591/44).
Conflict of interest
The authors declare that the research was conducted in the absence of any commercial or financial relationships that could be construed as a potential conflict of interest.
Publisher’s note
All claims expressed in this article are solely those of the authors and do not necessarily represent those of their affiliated organizations, or those of the publisher, the editors and the reviewers. Any product that may be evaluated in this article, or claim that may be made by its manufacturer, is not guaranteed or endorsed by the publisher.
References
Aggarwal, V., Pruncu, C. I., Singh, J., Sharma, S., and Pimenov, D. Y. (2020). Empirical investigations during WEDM of Ni-27Cu-3.15Al-2Fe-1.5Mn based superalloy for high temperature corrosion resistance applications. Mater. (MDPI) J. 13 (1–18), 3470. doi:10.3390/ma13163470
Akgün, M., and Demir, H. (2020). Optimization and finite element modelling of tool wear in milling of inconel 625 superalloy. J. Polytechnic. doi:10.2339/politeknik.706605
Akhyar, G., Haron, C., and Ghani, J. (2008). Application of Taguchi method in the optimization of turning parameters for surface roughness. Int. J. Sci. Eng. Technol. 1, 60–66.
Amoljit Singh, G., Kumar, S., Singh, J., Agarwal, V., and Sharma, S. (2020). A review of recent methods for tool wear reduction in electrical discharge machining. Surf. Rev. Lett. 27, 2030002. (SRL)-World Scientific Publishers. doi:10.1142/S0218625X20300026
An, Q., Yang, J., Li, J., Liu, G., Chen, M., and Li, C. (2024). A state-of-the-art review on the intelligent tool Holders in machining. Intelligent Sustain. Manuf. 1 (1), 10002. doi:10.35534/ism.2024.10002
Appoh, F., and Yunusa-kaltungo, A. (2021). Composite hybrid framework for through-life multi-objective failure analysis and optimisation. IEEE Access 9, 71505–71520. doi:10.1109/ACCESS.2021.3077284
Asiltürk, I., and Çunkaş, M. (2011). Modeling and prediction of surface roughness in turning operations using artificial neural network and multiple regression method. Expert Syst. Appl. 38, 5826–5832. doi:10.1016/j.eswa.2010.11.041
Balali, A., yunusa-kaltungo, A., and Edwards, R., (2023). A systematic literature review of passive energy consumption optimisation strategies in buildings and their selection criteria. doi:10.1115/IMECE2022-93887
Bauer, M., Karabaić, D., Kršulja, M., and Jurcan, M. (2024). An investigation into the applicability of EN24 steel for shrink-fit tool Holders for CNC milling machines. Trans. FAMENA 48 (1), 47–62. doi:10.21278/tof.481056323
Bhanu Prakash, D., Rama Balaji, G., Gopi, A., Ajay Kumar, V., and Prabhaker, D. V. N. (2017). Optimization of machining parameters for aluminium alloy 6082. Cnc End. Milling 3, 505–510. Avaialable at: http://www.ijera.com.
Chen, L. W., Li, J., Chen, W. P., Zhao, Y. H., and Hou, H. (2023). Comprehensive assessment and multiple-response optimization of serpentine channel pouring process for achieving high-quality semi-solid slurry. J. Mater. Res. Technol., 24 3839–3852. doi:10.1016/j.jmrt.2023.04.083
Chen, L. W., Zhao, Y. H., Li, M., Li, L., Hou, L., and Hou, H. (2021). Reinforced AZ91D magnesium alloy with thixomolding process facilitated dispersion of graphene nanoplatelets and enhanced interfacial interactions. Mater. Sci. Eng. A 804, 140793. doi:10.1016/j.msea.2021.140793
Chen, R., Zhao, B., He, T., Tu, L., Xie, Z., Zhong, N., et al. (2024). Study on coupling transient mixed lubrication and time-varying wear of main bearing in actual operation of low-speed diesel engine. Tribol. Int. 191, 109159. doi:10.1016/j.triboint.2023.109159
Chu, A., Li, C., Zhou, Z., Liu, Bo, Zhang, Y., Min, Y., et al. (2023). Nanofluids minimal quantity lubrication machining: from mechanisms to application. Lubricants 11, 422. doi:10.3390/lubricants11100422
Cui, X., Li, C., Ding, W., Yun, C., Cong, M., Xu, X., et al. (2021). Minimum quantity lubrication machining of aeronautical materials using carbon group nanolubricant: from mechanisms to application. Chin. J. Aeronaut. 35, 85–112. doi:10.1016/j.cja.2021.08.011
Dawood, S., Khadar, A., Selvam, M. D., Karuppusami, G., and Dawood, A. K. S. (2012). Optimization of machining parameters for face milling operation in a vertical CNC milling machine using genetic algorithm. Avaialable at: https://www.researchgate.net/publication/310598557.
Dikshit, M., Singh, S., Pathak, V., Saxena, K., Agrawal, M., Malik, V., et al. (2023). Surface characteristics optimization of biocompatible Ti6Al4V with RCCD and NSGA II using die-sinking EDM. J. Mater. Res. Technol. 24, 223–235. doi:10.1016/j.jmrt.2023.03.005
Equbal, A., Equbal, M. A., Equbal, M. I., Ravindrannair, P., Khan, Z. A., Badruddin, I. A., et al. (2022). Evaluating CNC milling performance for machining AISI 316 stainless steel with carbide cutting tool insert. Materials 15, 8051. doi:10.3390/ma15228051
Fang, J. X., Dong, S. Y., Li, S. B., Wang, Y. J., Xu, B. S., Li, J., et al. (2019b). Direct laser deposition as repair technology for a low transformation temperature alloy: microstructure, residual stress, and properties. Mater. Sci. Eng. A 748, 119–127. doi:10.1016/j.msea.2019.01.072
Fang, J. X., Li, S. B., Dong, S. Y., Wang, Y. J., Huang, H. S., Jiang, Y. L., et al. (2019a). Effects of phase transition temperature and preheating on residual stress in multi-pass & multi-layer laser metal deposition. J. Alloys Compd. 792, 928–937. doi:10.1016/j.jallcom.2019.04.104
Fetecau, C., and Stan, F. (2012). Study of cutting force and surface roughness in the turning of polytetrafluoroethylene composites with a polycrystalline diamond tool. Meas. (Lond) 45, 1367–1379. doi:10.1016/j.measurement.2012.03.030
Fu, Z. H., Yang, B. J., Shan, M. L., Li, T., Zhu, Z. Y., Ma, C. P., et al. (2020). Hydrogen embrittlement behavior of SUS301L-MT stainless steel laser-arc hybrid welded joint localized zones. Corros. Sci. 164, 108337. doi:10.1016/j.corsci.2019.108337
Ganeshkumar, S., Kumar, A., Maniraj, J., Babu, Y., Ansu, A., Goyal, A., et al. (2023). Exploring the potential of nano technology: a assessment of nano-scale multi-layered-composite coatings for cutting tool performance. Arabian J. Chem. 16, 105173. doi:10.1016/j.arabjc.2023.105173
Gao, S., Li, H., Huang, H., and Kang, R. (2022). Grinding and lapping induced surface integrity of silicon wafers and its effect on chemical mechanical polishing. Appl. Surf. Sci. 599, 153982. doi:10.1016/j.apsusc.2022.153982
Garg, H. K., Sharma, S., Kumar, R., Manna, A., Li, C., Mausam, K., et al. (2022). Multiobjective parametric optimization on the EDM machining of hybrid SiCp/grp/aluminum nanocomposites using non-dominating sorting genetic algorithm (NSGA-II). Fabr. Microstruct. Characterizations” Rev. Adv. Mater. Sci. 61, 1–24. De Gruyter. doi:10.1515/rams-2022-0279
Gong, P., Zhang, Y. B., Wang, C., Cui, X., Li, R., Sharma, S., et al. (2023). Residual stress generation in grinding: mechanism and modeling. J. Mater. Process. Technol. 324, 118262. doi:10.1016/j.jmatprotec.2023.118262
Haja Syeddu Masooth, P., Jayakumar, V., and Bharathiraja, G. (2020). “Experimental investigation on surface roughness in CNC end milling process by uncoated and TiAlN coated carbide end mill under dry conditions,” in Mater Today Proc (Elsevier Ltd), 726–736. doi:10.1016/j.matpr.2019.10.036
Hamdan, A., Sarhan, A. A. D., and Hamdi, M. (2012). An optimization method of the machining parameters in high-speed machining of stainless steel using coated carbide tool for best surface finish. Int. J. Adv. Manuf. Technol. 58, 81–91. doi:10.1007/s00170-011-3392-5
Hu, S., Li, C., Zhou, Z., Liu, B., Zhang, Y., Yang, M., et al. (2023). Nanoparticle-enhanced coolants in machining: mechanism, application, and prospects. Front. Mech. Eng. 18, 53. doi:10.1007/s11465-023-0769-8
Hua, L., Liu, Y., Qian, D., Xie, L., Wang, F., and Wu, M. (2022). Mechanism of void healing in cold rolled aeroengine M50 bearing steel under electroshocking treatment: a combined experimental and simulation study. Mater. Charact. 185, 111736. doi:10.1016/j.matchar.2022.111736
Khan Aqib, M., Mohammed, A., Sharma, S., Muhammad, J., Iqbal, A., and Ning, He (2021). Sustainability-based holistic assessment and determination of optimal resource consumption for energy-efficient machining of hardened steel. J. Clean. Prod. 319, 128674. doi:10.1016/j.jclepro.2021.128674
Kiranakumar, V., Ramakrishnaiah, T., Naveen, S., Khan, M., Gunderi, P., Reddy, S., et al. (2022). A review on electrical and gas-sensing properties of reduced graphene oxide-metal oxide nanocomposites. Biomass Convers. Biorefinery. doi:10.1007/s13399-022-03258-7
Kotaiah, K. R., Srinivas, J., Babu, K. J., and Srinivas, K. (2010). Prediction of optimal cutting states during inward turning: an experimental approach. Mater. Manuf. Process. 25, 432–441. doi:10.1080/10426910903229321
Kumar, J., Sharma, S., Singh, J., Singh, S., and Singh, G. (2022). Optimization of wire-EDM process parameters for Al-Mg-0.6Si-0.35Fe/15%RHA/5%Cu hybrid metal matrix composite using TOPSIS: processing and characterizations. J. Manuf. Mater. Process. 6, 150. doi:10.3390/jmmp6060150
Kumar, M. S., Sathisha, N., Manjnatha, S., Niranjana, S. J., Tamam, N., and Khan, M. I. (2023c). Fatigue surface analysis of AL A356 alloy reinforced hematite metal matrix composites. Biomass Conv. bioref. doi:10.1007/s13399-023-04634-7
Kumar, R., Dwivedi, R., Arya, R., Sonia, P., Yadav, A., Saxena, K., et al. (2023). Current development of carbide free bainitic and retained austenite on wear resistance in high silicon steel. J. Mater. Res. Technol. 24, 9171–9202. doi:10.1016/j.jmrt.2023.05.067
Lam Khanh, N., and Van Cuong, N. (2021). Parameter selection to ensure multi-criteria optimization of the Taguchi method combined with the data envelopment analysis-based ranking method when milling SCM440 steel. Avaialable at: http://www.etasr.com.
Lashin, M. M. A., Ibrahim, M. Z., Khan, M. I., Guedri, K., Saxena, K. K., and Eldin, S. M. (2022). Fuzzy control modeling to optimize the hardness and geometry of laser cladded Fe-based MG single track on stainless steel substrate prepared at different surface roughness. Micromachines 13 (12), 2191. doi:10.3390/mi13122191
Li, L., Zhang, Y., Cui, X., Said, Z., Sharma, S., Liu, M., et al. (2023). Mechanical behavior and modeling of grinding force: a comparative analysis. J. Manuf. Process. 102, 921–954. doi:10.1016/j.jmapro.2023.07.074
Li, M., Guo, Q., Chen, L., Li, L., Hou, H., and Zhao, Y. (2022). Microstructure and properties of graphene nanoplatelets reinforced AZ91D matrix composites prepared by electromagnetic stirring casting. J. Mater. Res. Technol. 21, 4138–4150. doi:10.1016/j.jmrt.2022.11.033
Liang, F., Wang, R., Pang, Q., and Hu, Z. (2023b). Design and optimization of press slider with steel-aluminum composite bionic sandwich structure for energy saving. J. Clean. Prod. 428, 139341. doi:10.1016/j.jclepro.2023.139341
Liang, X., Liu, Z., Cai, W. B., and Ren, X. (2023a). Progressive mapping surface integrity and multi-objective optimizing surface quality of machining Ti-6Al-4V based novel tool failure criterion. CIRP J. Manuf. Sci. Technol. 42, 81–94. doi:10.1016/j.cirpj.2023.01.013
Liao, D., Zhu, S., Keshtegar, B., Qian, G., and Wang, Q. (2020). Probabilistic framework for fatigue life assessment of notched components under size effects. Int. J. Mech. Sci. 181, 105685. doi:10.1016/j.ijmecsci.2020.105685
Liu, M., Li, C., Zhang, Y., Qinglong, A. N., Min, YANG, Teng, G. A. O., et al. (2021). Cryogenic minimum quantity lubrication machining: from mechanism to application. Front. Mech. Eng. 16 (4), 649–697. doi:10.1007/s11465-021-0654-2
Long, X., Lu, C., Su, Y., and Dai, Y. (2023). Machine learning framework for predicting the low cycle fatigue life of lead-free solders. Eng. Fail. Anal. 148, 107228. doi:10.1016/j.engfailanal.2023.107228
Luwei, K., Sinha, J., and Yunusa-Kaltungo, A. (2017). “Optimisation of different vibration acceleration and velocity features for faults diagnosis in rotating machines,” in Paper presented at 2nd International Conference on Maintenance Engineering (IncoME-II), Manchester, United Kingdom, 5/09/17 - 6/09/17.
Mandal, N., Doloi, B., Mondal, B., and Das, R. (2011). Optimization of flank wear using Zirconia Toughened Alumina (ZTA) cutting tool: Taguchi method and Regression analysis. Meas. (Lond) 44, 2149–2155. doi:10.1016/j.measurement.2011.07.022
Marakini, V., Pai, S., Bhat, A., and Bangera, S. (2022), Surface integrity optimization in high speed milling of AZ91 magnesium alloy using TOPSIS considering vibration signals, Mater Today Proc. 52, 02–809. doi:10.1016/j.matpr.2021.10.154
Meng, B., Wang, J., Chen, M., Zhu, S., and Wang, F. (2023). Study on the oxidation behavior of a novel thermal barrier coating system using the nanocrystalline coating as bonding coating on the single-crystal superalloy. Corros. Sci. 225, 111591. doi:10.1016/j.corsci.2023.111591
Mohammed Yahu, R. (2023). Comparison of Cuo nanofluid and conventional coolant for flood cooling in CNC turning of inconel 800 to improve surface finish and machining rate. AIP Conf. Proc. 2822, 020028. doi:10.1063/5.0172867
Nadaf, S. S., and Shinde, M. Y. (2020). Optimization of Process Parameters on CNC milling machine for Mild steel IS 2062:2011 E250 Gr. A with AlTiN coated tool insert in wet condition IOP Conference Series: Materials Science and EngineeringInternational Conference on Mechanical and Energy Technologies (ICMET 2019), New Delhi, India, November 7–8, 2019. (Galgotias College of Engineering and Technology: Greater Noida, U.P., India) 748, 012030. doi:10.1088/1757-899X/748/1/012030
Narayan, M. R., Singh, J., Kumar, V., Sharma, S., Sudhakara, P., Aggarwal, V., et al. (2022). Multi-objective optimization of EDM parameters for Rice husk Ash/Cu/Mg reinforced hybrid Al- 0.7Fe-0.6Si-0.375Cr-0.25Zn metal-matrix nanocomposites for Engineering applications: fabrication, and Morphological Analysis. J. Nanomater 2022, 1–15. doi:10.1155/2022/2188705
Niu, X., Zhu, S., He, J., Liao, D., Correia, J. A. F. O., Berto, F., et al. (2022). Defect tolerant fatigue assessment of AM materials: size effect and probabilistic prospects. Int. J. Fatigue 160, 106884. doi:10.1016/j.ijfatigue.2022.106884
Özel, T., and Karpat, Y. (2005). Predictive modeling of surface roughness and tool wear in hard turning using regression and neural networks. Int. J. Mach. Tools Manuf. 45, 467–479. doi:10.1016/j.ijmachtools.2004.09.007
Palanikumar, K. (2008). Application of Taguchi and response surface methodologies for surface roughness in machining glass fiber reinforced plastics by PCD tooling. Int. J. Adv. Manuf. Technol. 36, 19–27. doi:10.1007/s00170-006-0811-0
Paswan, K., Pramanik, A., Chattopadhyaya, S., Sharma, S., Singh, G., Khan, A. M., et al. (2023). An analysis of machining response parameters, crystalline structures, and surface topography during EDM of die-steel using EDM oil and liquid-based viscous dielectrics: a comparative analysis of machining performance. Arab. J. Sci. Eng. 48, 11941–11957. doi:10.1007/s13369-023-07626-x
Patil, A., Rudrapati, R., and Poonawala, N. S. (2021). Examination and prediction of process parameters for Surface roughness and MRR in VMC-five axis machining of D3 steel by using RSM and MTLBO. Mater. Today Proc. 44, 2748–2753. Part 1. doi:10.1016/j.matpr.2020.12.700
Patil, S., Sudhakar Rao, P., Prabhudev, M. S., Khan, M. Y., and Anjaiah, G. (2022). Optimization of cutting parameters during CNC milling of EN24 steel with Tungsten carbide coated inserts: a critical review. Mater. Today Proc. 62 (2022), 3213–3220. doi:10.1016/j.matpr.2022.04.217
Pramanik, A., Basak, A. K., Prakash, C., Shankar, S., Sharma, S., and Narendranath, S. (2021). Recast layer formation during wire electrical discharge machining of titanium (Ti-Al6-V4) alloy. J. Mater Eng. Perform. 30, 8926–8935. doi:10.1007/s11665-021-06116-1
Prasanthi, P., Kumar, M., Mallampati, S., Madhav, V., Saxena, K., Mohammed, K., et al. (2023). Mechanical properties of carbon fiber reinforced with carbon nanotubes and graphene filled epoxy composites: experimental and numerical investigations. Mater. Res. Express 10, 025308. doi:10.1088/2053-1591/acaef5
Praveen Chowdary, P., and Saravanan, R. (2022). Novel application of SiO2 nanofluid coolant for enhancing machinability over Inconel 706 CNC end milling with conventional coolant. Mater. Today Proc. 69, 1019–1024. Part 3. doi:10.1016/j.matpr.2022.08.099
Praveen Chowdary, P., and Saravanan, R. (2023). Machinability enhancement in cnc end milling of inconel 706 by novel application of Al2O3 nanofluid. AIP Conf. Proc. 2822, 020148. doi:10.1063/5.0172884
Rahman, M. U., Khan, M. I., Haq, F., and Hayat, T. (2019). Mathematical modeling and theoretical analysis of second-grade nanomaterial with entropy optimization. Iran. J. Sci. Technol. Trans. Sci. 43, 2713–2723. doi:10.1007/s40995-019-00749-7
Raj, A., Misra, J. P., Singh, R. P., Singh, G., Sharma, S., and Eldin, S. M. (2022). Performance analysis of WEDM during the machining of Inconel 690 miniature gear using RSM and ANN modeling approaches. Rev. Adv. Mater. Sci. 62. De Gruyter. doi:10.1515/rams-2022-0288
Raju, K. V. M. K., Janardhana, G. R., Kumar, P. N., and Rao, V. D. P. (2011). Optimization of cutting conditions for surface roughness in CNC end milling. Int. J. Precis. Eng. Manuf. 12, 383–391. doi:10.1007/s12541-011-0050-7
Saravanan, R., Sathish, T., Vijayan, V., Rajkumar, S., Sharma, S., Li, C., et al. (2023). Eco-friendly MoS2/waste coconut oil nanofluid for machining of magnesium implants. Rev. Adv. Mater Sci. 62 (1), 20220296. doi:10.1515/rams-2022-0296
Satyanarayana, K., Kumar, V. T., Rathod, R., Shafi, M. D., Chary, S., Alkhayyat, A., et al. (2023). “Optimization of machining parameters of CNC milling operation for material removal rate and surface roughness on en-24 steel using Taguchi method. E3S Web Conf. 391, 01011. doi:10.1051/e3sconf/202339101011
Sayit, E., Aslantas, K., and Çiçek, A. (2009). Tool wear mechanism in interrupted cutting conditions. Mater. Manuf. Process. 24, 476–483. doi:10.1080/10426910802714423
Sehar, B., Waris, M., Gilani, S., Ansari, U., Mushtaq, S., Khan, N., et al. (2022). The impact of laminations on the mechanical strength of carbon-fiber composites for prosthetic foot fabrication. Crystals 12, 1429. doi:10.3390/cryst12101429
Sequeira, A. A. (2012). Effect of cutting parameters on cutting force and surface roughness of aluminium components using face milling process - a Taguchi approach. IOSR J. Mech. Civ. Eng. 3, 07–13. doi:10.9790/1684-0340713
Shahid, M., Javed, H. M. A., Ahmad, M., Qureshi, A., Khan, M., Alnuwaiser, M., et al. (2022). A brief assessment on recent developments in efficient electrocatalytic nitrogen reduction with 2D non-metallic nanomaterials. Nanomater. (Basel) 12, 3413. doi:10.3390/nano12193413
Sharma, S., and Sudhakara, P. (2019). Fabrication and optimization of hybrid AA-6082-T6 alloy/8%Al2O3(Alumina)/2%Grp metal matrix composites using novel BoxBehnken methodology processed by wire-sinking electric discharge machining. Materials Research Express 6, 116594. doi:10.1088/2053-1591/ab4b97
Silveira, M. L., de Oliveira, D. A., dos Santos, A. J., de Faria, P. E., and Abrão, A. M. (2023). Assessment of the surface integrity of AISI H13 tool steel after milling with carbide and cermet inserts. Int. J. Adv. Manuf. Technol. 125, 3135–3148. doi:10.1007/s00170-023-10843-1
Singh, B., Kumar, I., Saxena, K., Mohammed, K., Khan, M., Ben Moussa, S., et al. (2023a). A future prospects and current scenario of aluminium metal matrix composites characteristics. Alex. Eng. J. 76, 1–17. doi:10.1016/j.aej.2023.06.028
Singh, B., Singh Grewal, J., Kumar, R., Sharma, S., Kumar, A., Mohammed, K. A., et al. (2024). Novel study on investigating the mechanical, microstructure morphological, and dry sliding wear characteristics of grey cast iron GG25 with copper additions for valve guides in internal combustion engine. Front. Mater. 10, 1293254. doi:10.3389/fmats.2023.1293254
Singh, G., Aggarwal, V., Singh, S., Singh, B., Sharma, S., Singh, J., et al. (2022). Experimental investigation and performance optimization during machining of hastelloy C-276 using green lubricants. Materials 15 (15), 5451. doi:10.3390/ma15155451
Singh, G., Singh, S., Sharma, S., Singh, J., Chang, Li, Grzegorz, K., et al. (2023b). Performance investigations for sustainability assessment of Hastelloy C-276 under different machining environments. Heliyon 9, e13933. doi:10.1016/j.heliyon.2023.e13933
Su, Y., Shen, Z., Long, X., Chen, C., Qi, L., and Chao, X. (2023). Gaussian filtering method of evaluating the elastic/elasto-plastic properties of sintered nanocomposites with quasi-continuous volume distribution. Mater. Sci. Eng. A 872, 145001. doi:10.1016/j.msea.2023.145001
Sun, J., Li, C., Zhou, Z., Liu, B., Zhang, Y., Yang, M., et al. (2023). Material removal mechanism and force modeling in ultrasonic vibration-assisted micro-grinding biological bone. Chin. J. Mech. Eng. 36, 129. doi:10.1186/s10033-023-00957-8
Suresh, P. V. S., Rao, P. V., and Deshmukh, S. G., A genetic algorithmic approach for optimization of surface roughness prediction model, 2002.
Tang, D., Xiang, G., Guo, J., Cai, J., Yang, T., Wang, J., et al. (2023). On the optimal design of staved water-lubricated bearings driven by tribo-dynamic mechanism. Phys. Fluids 35 (9), 93611. doi:10.1063/5.0165807
Thakre, A. A., et al. (2013). Optimization of milling parameters for minimizing surface roughness using Taguchi’s approach. Int. J. Emerg. Technol. Adv. Eng. https://api.semanticscholar.org/CorpusID:2060445.
Vemanaboina, H., Babu, M., Prerana, I., Gundabattini, E., Yelamasetti, B., Saxena, K., et al. (2023). Evaluation of residual stresses in CO 2 laser beam welding of SS316L weldments using FEA. Mater. Res. Express 10, 016509. doi:10.1088/2053-1591/acb0b5
Wang, H., Wang, F., Qian, D., Chen, F., Dong, Z., and Hua, L. (2023a). Investigation of damage mechanisms related to microstructural features of ferrite-cementite steels via experiments and multiscale simulations. Int. J. Plasticity 170, 103745. doi:10.1016/j.ijplas.2023.103745
Wang, X., Song, Y., Li, C., Zhang, Y. B., Ali, H., Sharma, S., et al. (2023b). Nanofluids application in machining: a comprehensive review. Int. J Adv Man Tech. doi:10.1007/s00170-022-10767-2
Wu, Y., Chen, J., Zhang, L., Ji, J., Wang, Q., and Zhang, S. (2022). Effect of boron on the structural stability, mechanical properties, and electronic structures of γ′-Ni3Al in TLP joints of nickel-based single-crystal alloys. Mater. Today Commun. 31, 103375. doi:10.1016/j.mtcomm.2022.103375
Xavior, M. A., and Adithan, M. (2009). Determining the influence of cutting fluids on tool wear and surface roughness during turning of AISI 304 austenitic stainless steel. J. Mater Process Technol. 209, 900–909. doi:10.1016/j.jmatprotec.2008.02.068
Xu, W., Li, C., Cui, X., Zhang, Y. B., Min, Y., Gao, T., et al. (2023b). Atomization mechanism and machinability evaluation with electrically charged nanolubricant grinding of GH4169. J. Manuf. Process. 106, 480–493. doi:10.1016/j.jmapro.2023.10.037
Xu, W., Li, C., Zhang, Y., Hafiz Muhammad Ali, S. S., Li, R., Yang, M., et al. (2022). Electrostatic atomization minimum quantity lubrication machining: from mechanism to application. Int. J. Extrem Manuf. 4, 042003. doi:10.1088/2631-7990/ac9652
Xu, X., Hao, Y., Dong, R., Hou, H., and Zhao, Y. (2023a). Effect of undercooling on microstructure evolution of Cu based alloys. J. Alloys Compd. 935, 167998. doi:10.1016/j.jallcom.2022.167998
Yahul, M., and Saravanan, R. (2022). “An analysis on CNC machined surface roughness between AA7475 and AA7475/fly ash composite,” in Journal of Physics: Conference Series, Volume 2484, International Conference on Material Science, Mechanics and Technology (ICMMT) 2022, Indore, India, 23/12/2022 - 24/12/2022. doi:10.1088/1742-6596/2484/1/012026
Yang, H., Xu, Z., Shi, Y., Tang, W., Liu, C., yunusa-kaltungo, A., et al. (2023a). Multi-objective optimization designs of phase change material-enhanced building using the integration of the Stacking model and NSGA-III algorithm. J. Energy Storage 68, 107807. doi:10.1016/j.est.2023.107807
Yang, S., Huang, Z., Hu, Q., Zhang, Y., Wang, F., Wang, H., et al. (2022a). Proportional optimization model of multiscale spherical BN for enhancing thermal conductivity. ACS Appl. Electron. Mater. 4 (9), 4659–4667. doi:10.1021/acsaelm.2c00878
Yang, S., Zhang, Y., Sha, Z., Huang, Z., Wang, H., Wang, F., et al. (2022b). Deterministic manipulation of heat flow via three-dimensional-printed thermal meta-materials for multiple protection of critical components. ACS Appl. Mater. Interfaces 14 (34), 39354–39363. doi:10.1021/acsami.2c09602
Yang, W., Jiang, X., Tian, X., Hou, H., and Zhao, Y. (2023c). Phase-field simulation of nano-α′ precipitates under irradiation and dislocations. J. Mater. Res. Technol. 22, 1307–1321. doi:10.1016/j.jmrt.2022.11.165
Yang, Z., Tang, B., Qiu, Y., Wu, J., Wei, W., Huang, X., et al. (2023b). Measurement of transient temperature using laser-induced breakdown spectroscopy (LIBS) with the surface temperature effect. J. Anal. Atomic Spectrom. 38 (10), 1952–1961. doi:10.1039/D3JA00128H
Yunusa-kaltungo, A., Sinha, J., and Nembhard, A. (2015). Use of composite higher order spectra for faults diagnosis of rotating machines with different foundation flexibilities. Measurement 70, 47–61. doi:10.1016/j.measurement.2015.03.041
Zhang, X., Li, C., Zhou, Z., Liu, B., Zhang, Y. B., Min, Y., et al. (2023). Vegetable oil-based nanolubricants in machining: from physicochemical properties to application. Chin. J. Mech. Eng. 36, 76. doi:10.1186/s10033-023-00895-5
Keywords: surface roughness, response surface methodology, tungsten-coated carbide inserts, EN 24 steel, SEM, profilometry
Citation: Patil S, Sathish T, Rao PS, Prabhudev MS, Vijayan V, Rajkumar S, Sharma S, Kumar A, Abbas M and Makki E (2024) Optimization of surface roughness in milling of EN 24 steel with WC-Coated inserts using response surface methodology: analysis using surface integrity microstructural characterizations. Front. Mater. 11:1269608. doi: 10.3389/fmats.2024.1269608
Received: 30 July 2023; Accepted: 09 February 2024;
Published: 07 March 2024.
Edited by:
Yu-Hong Zhao, North University of China, ChinaReviewed by:
Zhiqin Wen, Guilin University of Technology, ChinaXiaolin Tian, North University of China, China
Ramesh Rudrapati, Bule Hora University, Ethiopia
Copyright © 2024 Patil, Sathish, Rao, Prabhudev, Vijayan, Rajkumar, Sharma, Kumar, Abbas and Makki. This is an open-access article distributed under the terms of the Creative Commons Attribution License (CC BY). The use, distribution or reproduction in other forums is permitted, provided the original author(s) and the copyright owner(s) are credited and that the original publication in this journal is cited, in accordance with accepted academic practice. No use, distribution or reproduction is permitted which does not comply with these terms.
*Correspondence: Shubham Sharma, c2h1YmhhbTU0M3NoYXJtYUBnbWFpbC5jb20=, c2h1YmhhbXNoYXJtYWNzaXJjbHJpQGdtYWlsLmNvbQ==; Emad Makki, ZWFtYWtraUB1cXUuZWR1LnNh
†ORCID: Emad Makki, http://orcid.org/0000-0002-2089-9776