 Jirayu Tanprasertsuk1
 Tammy M. Scott1
 Aron K. Barbey2Kathryn Barger3Xiang-Dong Wang3Mary Ann Johnson4Leonard W. Poon5Rohini Vishwanathan3Nirupa R. Matthan1,3Alice H. Lichtenstein1,3
 Guylaine Ferland6
 Elizabeth J. Johnson1*
- 1Gerald J. and Dorothy R. Friedman School of Nutrition Science and Policy, Tufts University, Boston, MA, United States
- 2Department of Psychology, Beckman Institute for Advanced Science and Technology, University of Illinois at Urbana-Champaign, Urbana, IL, United States
- 3Jean Mayer USDA Human Nutrition Research Center on Aging at Tufts University, Boston, MA, United States
- 4Department of Nutrition and Health Sciences, University of Nebraska Lincoln, Lincoln, NE, United States
- 5Institute of Gerontology, College of Public Health, University of Georgia, Athens, GA, United States
- 6Département de Nutrition, Université de Montréal, Montréal, QC, Canada
Background: Healthy dietary patterns are related to better cognitive health in aging populations. While levels of individual nutrients in neural tissues are individually associated with cognitive function, the investigation of nutrient patterns in human brain tissue has not been conducted.
Methods: Brain tissues were acquired from frontal and temporal cortices of 47 centenarians from the Georgia Centenarian Study. Fat-soluble nutrients (carotenoids, vitamins A, E, K, and fatty acids [FA]) were measured and averaged from the two brain regions. Nutrient patterns were constructed using principal component analysis. Cognitive composite scores were constructed from cognitive assessment from the time point closest to death. Dementia status was rated by Global Deterioration Scale (GDS). Pearson's correlation coefficients between NP scores and cognitive composite scores were calculated controlling for sex, education, hypertension, diabetes, and APOE ε4 allele.
Result: Among non-demented subjects (GDS = 1–3, n = 23), a nutrient pattern higher in carotenoids was consistently associated with better performance on global cognition (r = 0.38, p = 0.070), memory (r = 0.38, p = 0.073), language (r = 0.42, p = 0.046), and lower depression (r = −0.40, p = 0.090). The findings were confirmed with univariate analysis.
Conclusion: Both multivariate and univariate analyses demonstrate that brain nutrient pattern explained mainly by carotenoid concentrations is correlated with cognitive function among subjects who had no dementia. Investigation of their synergistic roles on the prevention of age-related cognitive impairment remains to be performed.
Introduction
Advancing age is the number one risk factor of age-related cognitive impairment and dementia, representing a major public health epidemic among older Americans (1). A systematic review of cross-sectional studies and longitudinal cohorts has identified a relation between diet quality and cognitive health in the aging population (2). A healthy diet covers a variety of dietary patterns such as Mediterranean diet (MeDi) (3, 4), Healthy Dietary Index (HDI) diet (5), Healthy Eating Index (HEI) diet (6), Dietary Approaches to Stop Hypertension (DASH) diet (7), and Mediterranean-DASH Intervention for Neurodegenerative Delay (MIND) diet (8). In some studies, dietary patterns are derived a posteriori with cluster analysis, factor analysis (e.g., principal component analysis [PCA]), or reduced rank regression (9–13). Though healthy dietary patterns have been diversely defined, they share common components of high intake of fruits, vegetables, whole grains, nuts, seeds, fish, and limited intake of added sugar, sodium, high-fat dairy products, red, and processed meat (2).
Traditionally, habitual dietary intake has been estimated using subjective recall data derived from food frequency questionnaires (FFQ). This approach, despite its direct translation for establishing dietary recommendations, does not account for recall bias, particularly among subjects with varied cognitive performance, and inter-individual variability in the nutrient absorption and metabolism (14). There has been an attempt to overcome these issues by constructing serum nutrient patterns (NP) as a marker of intake among subjects in the Oregon Brain Aging Study (15), and the Illinois Brain Aging Study (16–18). However, given that cognitive processes originate from the human brain, particularly in neocortices, and that nutrient uptake into the central nervous system (CNS) is strictly regulated at the blood-brain barrier (BBB) (19), we need to expand the scope of investigation further into the CNS for a greater apprehension of nutrition's roles in the aging brain.
While the evidence for relations between diet quality and cognitive function has been largely consistent among observational studies, the evidence from clinical trials of dietary supplements has been mixed (20). When investigating the relationship between nutrition and age-related diseases, the importance of examining nutrition as dietary patterns or NPs have been highlighted (21, 22), as most individuals acquire nutrients predominantly from foods, rather than supplements, throughout their lifespan. From a biochemical and molecular perspective, the etiology of age-related dementia, despite its heterogeneity, shares multiple mechanisms including cardiometabolic risk factors, elevated oxidative stress, neuroinflammation, and impaired AMP-activated kinase signaling (23). All of these factors can potentially be regulated by multiple dietary components. The pathology of age-related cognitive impairment is also different from cognitive symptoms caused by a deficiency of a single nutrient that may manifest during a shorter period of time and may be reversible—such as dementia caused by vitamin B12 or niacin deficiency, and Wernicke-Korsakoff syndrome caused by a genetic predisposition “to thiamin” deficiency (24, 25).
Therefore, the present research study was proposed based on the rationale that many fat-soluble nutrients (carotenoids, vitamins A, E, K, and fatty acids [FA]) are present in human brain (26–31), and that they are a part of dietary patterns and serum NPs previously reported to be associated with better cognitive function in multiple aging cohorts (2, 15, 26, 28, 32, 33). This was accomplished by constructing a posteriori NPs of fat-soluble nutrients measured in brain tissues acquired post-mortem from a subset of centenarians (defined as ≥98 years) who were enrolled in the Georgia Centenarian Study (GCS)—the longest running centenarian study in the U.S. to date (34, 35). Subsequently, the relationship between constructed NPs and cognitive performance at the time point closest to death was cross-sectionally investigated. Findings from this novel study may also provide insights into the role of nutrition in cognition in the oldest old, which may be similar or different from lesser aged older adults.
Materials and Methods
Subject Recruitment and Brain Collection
The design of GCS, objectives, protocols of subject recruitment, and brain collection have been previously described in detail (34, 35). Briefly, the GCS was a population-based study conducted in 44 counties in northern Georgia. The GCS was primarily designed to identify biological, psychological, and social factors contributing to survivorship and successful aging. Brain tissues from frontal (FC) and temporal cortices (TC) were collected from 47 subjects who were a subset of centenarians enrolled in the phase III of the GCS (2001–2007) and gave consent to donate brain tissue upon death. After tissue collection, all samples were coded and stored at −80°C until the measures of nutrient concentration. All protocols were performed with an approval from the University of Georgia Institutional Review Board. Separate approval for using de-identified data for the present analyses was obtained from the Tufts University/Tufts Medical Center Institutional Review Board.
Nutrient Concentration Measures in Brain Tissues
Protocols for brain lipid extraction, separation, quantification, and concentrations have been previously and separately described for carotenoids, vitamin A (retinol), vitamin E (α- and γ-tocopherol [TP]), vitamin K (phylloquinone [PK] and menaquinone-4 [MK-4]), and individual FAs (27, 28, 36–39). In short, separation and quantification of five major dietary carotenoids (lutein, zeaxanthin, cryptoxanthin, β-carotene, and lycopene), retinol, and TPs were performed using high-performance liquid chromatography (HPLC) coupled with a photodiode array detector. The limit of detection (LOD) was 0.2 pmol for carotenoids, 2.0 pmol for retinol, 2.7 pmol for TPs per injection. Only levels of the all-trans isomer of each carotenoid, which is the most predominant isomer in human brain tissues, are reported (26, 40). Separation and detection of PK and MK-4 were performed using HPLC coupled with a fluorescence detector. The LOD was 0.03 pmol for both vitamin K vitamers. Separation and detection of individual FAs were performed using a gas chromatography coupled with a flame ionization detector, and expressed as molar percentage (mol%). Total saturated FAs (SFAs) represent the sum of 10:0, 12:0, 14:0, 15:0, 16:0, 18:0, 20:0, 22:0, and 24:0. Total monounsaturated FAs (MUFAs) represent the sum of 16:1 (n-9), 16:1 (n-7), 18:1 (n-9), 18:1 (n-7), 20:1 (n-9), 22:1 (n-9), and 24:1 (n-9). Total omega-3 polyunsaturated FAs (n-3 PUFAs) represent the sum of 18:3, 18:4, 20:3, 20:5, 22:5, and 22:6. Total omega-6 polyunsaturated FAs (n-6 PUFAs) represent the sum of 18:2, 18:3, 20:2, 20:3, 20:4, 22:2, 22:4, and 22:5. Total trans-FAs represent the sum of 16:1 (n-9), 16:1 (n-7), trans-6-octadecenoic acid (18:1, n-10 to 12), 18:1 (n-9), 18:1 (n-7), trans-9, trans-12- octadecenoic acid (18:2 TT/TCTX), and conjugated linoleic acid (18:2, CLA).
Cognitive Assessment and Cognitive Domain Composite Scores
After enrollment in the GCS, cognitive assessment was performed every 6 months at the subject's residence as reported earlier (34). Cognitive data were obtained from the visit closest to death (<1 year for all subjects). Dementia status was assessed by geriatric psychiatrists using Global Deterioration Scale (GDS) and subjects were grouped based on GDS score. A score of 1–2 on GDS was clinically defined as no dementia; a score of 3 represented mild cognitive impairment; and a score of 4–7 represented increasing severity of dementia from mild to severe (41). Cognitive tests included Mini-Mental State Examination (MMSE, 24–30 = normal cognition; 19–23 = mild; 10–18 = moderate; or ≤ 9 = severe cognitive impairment) (42), Severe Impairment Battery (SIB, < 63 = very severely impaired cognition) (43), Fuld Object Memory Evaluation (FOME) (44), Controlled Oral Word Association Test (COWAT) (45), Wechsler Adult Intelligence Scale Third Edition (WAIS-III) Similarities (46), Behavioral Dyscontrol Scale (BDS) (47), and the Consortium to Establish a Registry for Alzheimer's Disease (CERAD) battery which included Verbal Fluency (VF), Boston Naming Test (BNT), Constructional Praxis (CP), and Word List Memory Test (WLMT) (48, 49). Depression was assessed using Geriatric Depression Scale Short Form (GDSSF) (50), and activities of daily living were assessed using Direct Assessment of Function Status (DAFS) (51). All subtests have been validated and are considered reliable measures of cognition in normal aging and in AD (52).
To calculate cognitive domain composite scores, scores from each cognitive test were normalized using z-scoring as previously reported (53). Composite scores of five cognitive domains (memory, executive function, language, visuospatial function, attention), depression, and activities of daily living were then calculated by averaging the z-scores of tests based on the method adapted from Bowman et al. (15). The calculation method has also previously been reported and shown in Supplementary Table 1. Global cognition composite scores were also derived by combining total cognitive testing z-scores, MMSE, and SIB. Missing test scores were excluded and the denominator changed accordingly for the calculation of composite scores.
Statistical Analysis
Values are presented as mean (SD). All statistical tests were performed in R 3.5.1 with a significance level set at α = 0.05. Findings with p < 0.1 but > 0.05 were reported as borderline significant. Comparisons of subject characteristics between non-demented (GDS 1–3, n = 23) and demented subjects (GDS 4–7, n = 24) were performed using Student's two-sample t-test and Fisher's exact test for continuous and categorical variables, respectively.
NPs were derived from concentrations of carotenoids, vitamins A, E, K, SFAs, MUFAs, n-3 PUFAs, n-6 PUFAs, and trans-FAs averaged from FC and TC (vitamin K only from FC due to limited brain sample availability) using PCA with a function pca in the R package “pcaMethods” (54). Concentrations of all nutrients were log transformed prior to PCA. Nutrient concentration matrix was unit-variance scaled and centered. We chose non-linear iterative partial least squares algorithm to calculate principal components, or NPs in our case, which is an iterative approach for estimating independent principal components by extracting them one at a time (55). This variation of PCA can handle small amount of missing values, which in our case were PK and MK-4 concentrations from two individuals due to insufficient brain tissues for vitamin K analysis. Only NPs with eigenvalue >1 were reported.
To investigate the relationship between brain nutrient concentrations or NPs and cognitive domain composite scores, Pearson's correlation test was performed with an adjustment for covariates sex, education, hypertension, diabetes, and presence of APOE ε4 allele. Additional adjustment for antithrombotic use was performed for vitamin K, and antidepressant use for depression score. Sub-analyses in non-demented (GDS 1–3) were also performed. Heat maps aided the visualization of correlations.
Results
Subject Characteristics
Characteristics of all 47 subjects are reported in Table 1. By design, all subjects were ≥98 years old with an average age at death of 102.2 (2.5) years old. Eighty-nine percent were Caucasian and 89% were female. Subjects who did not finish high school accounted for 51%. Seventy percent were institutionalized at the visit closest to death. Body mass index (BMI) was 22.1 (3.9) kg/m2 on average, excluding one double amputee whose BMI could not be calculated. Approximately half of the subjects had hypertension (53%) while only 3 subjects had diabetes (6%). In terms of medication and supplement uses, while no subjects took cholesterol-lowering medication, the majority of subjects used at least one form of dietary supplements (72%). Twelve subjects, ten of whom had dementia, could not provide data on history of smoking and alcohol use through recall. Among those with available data, 86% never smoked and 60% never used alcohol. Only one subject was an active smoker at death.
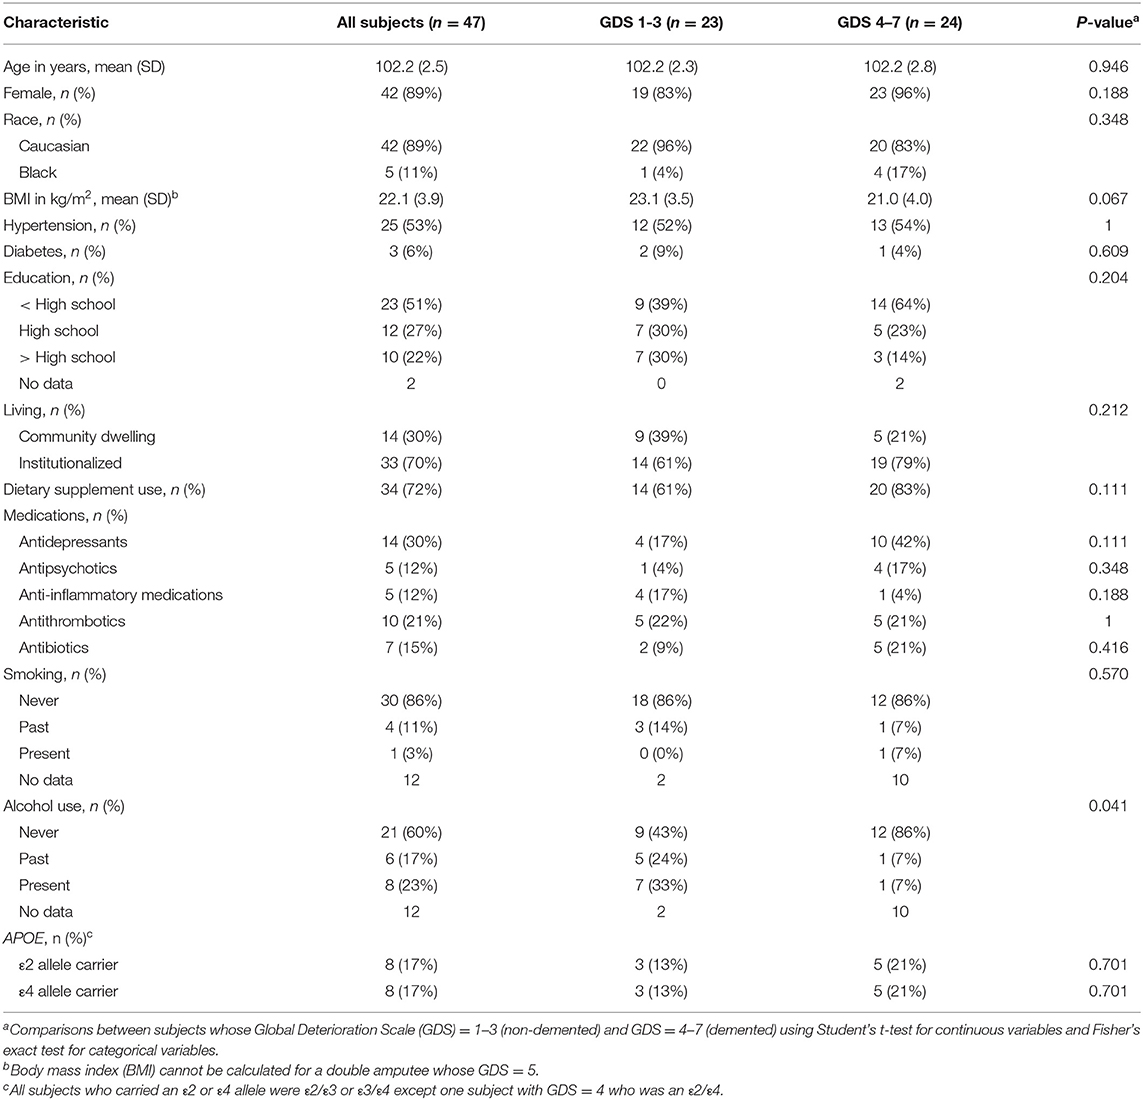
Table 1. Subject characteristics.
Subject characteristics between non-demented (n = 23) and demented (n = 24) subjects, as assessed by the GDS, were not statistically different, except that BMI in non-demented subjects was marginally higher than that in demented subjects [23.1 (3.5) vs. 21.0 (3.5) kg/m2, p = 0.067] (Table 1). Although higher proportion of subjects without dementia reported a history of alcohol use (p = 0.041), the data were only available for only 58% of demented participants.
Nutrient Concentrations in FC and TC, and Establishing NPs
Concentrations of nutrients averaged from the FC and TC are reported in Table 2 (vitamin K only from FC). These data have also been previously reported separately for FC and TC (27, 31, 40). Lutein was the most predominant carotenoid in all FC and TC tissues with a concentration of 79.50 (52.57) pmol/g. On the contrary, lycopene, at an average concentration of 20.41 (21.38) pmol/g, was not detected in both FC and TC in 20 subjects (43% of all subjects). Retinol, which included both free retinol, retinal, and retinyl esters before hydrolyzation during lipid extraction, had a concentration of 691.97 (305.56) pmol/g. Concentrations of α-TP and γ-TP were 66,917 (13,676) and 1,742 (1,018) pmol/g, respectively. While MK-4 was detectable in all brain tissues at 4.96 (2.32) pmol/g, PK was not detected in 17 subjects (38%). The predominant class of FA in the brain samples was SFA, which accounted for 15.36 (2.30) nmol/mg or 47.93 (1.68) mol%. Concentrations of individual FAs are shown in Supplementary Table 2. Docosahexaenoic acid (DHA, 22:6 n-3) and arachidonic acid (AA, 20:4 n-6) were the most predominant n-3 PUFA (11.90 (1.60) mol% or 90.22% of total n-3 PUFAs) and n-6 PUFA (8.54 (0.57) mol% or 66.36% of total n-6 PUFAs), respectively, in all brain tissues. Concentrations of each nutrient were not significantly different among demented and demented subjects. However, total trans-FA concentration was significantly higher among demented subjects (p = 0.020).
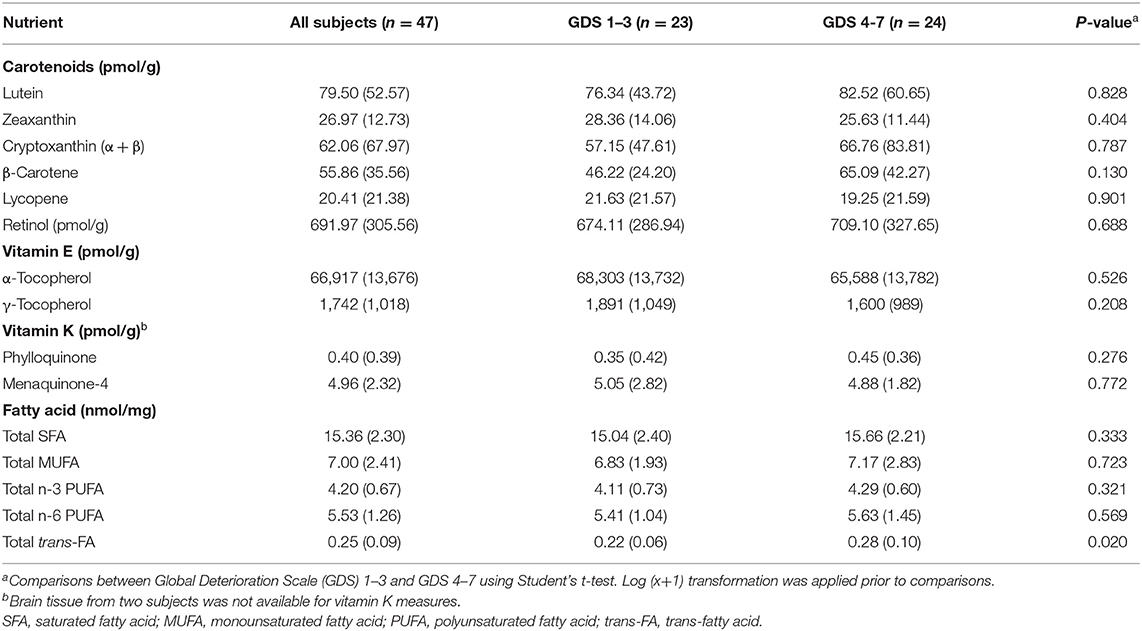
Table 2. Mean (SD) of nutrient concentrations averaged from the frontal and temporal cortices (vitamin K only in the frontal cortex).
As shown in Figure 1, significant correlations were identified among concentrations of carotenoids, and among FAs (blue represents positive and red represents negative correlations). For others that also reached statistical significance, lycopene was also positively correlated with γ-TP (r = 0.32, p = 0.027) and negatively correlated with vitamin A (r = −0.49, p < 0.001), while α-TP was positively correlated with PK (r = 0.46, p = 0.002) and negatively associated with total trans-FAs (r = −0.32, p = 0.030). MK-4, but not PK, was also associated with FA concentrations including total SFA (r = 0.45, p = 0.002), n-3 PUFA (r = 0.52, p < 0.001), and n-6 PUFA (r = 0.34, p = 0.023). These correlations among nutrient concentrations further warranted the investigation of nutrients as NPs.
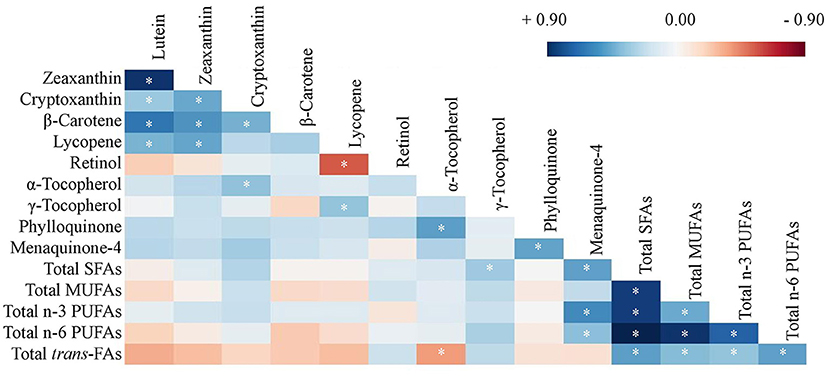
Figure 1. Heat map of Pearson's correlation coefficients of concentrations of carotenoids, retinol, tocopherols, phylloquinone, menaquinone-4, and fatty acids averaged from frontal and temporal cortices (except vitamin K only in the frontal cortex, n = 47, *p < 0.05). Log transformation has been applied to all nutrient concentrations. SFA, saturated fatty acid; MUFA, monounsaturated fatty acid; PUFA, polyunsaturated fatty acid; trans-FA, trans-fatty acid.
Next, PCA was used to derive NPs from brain nutrient concentrations. The first five NPs that explain the highest variance (each of which had an eigenvalue >1.0) among the 47 subjects are described in Table 3. No obvious outlier was detected in a PCA plot (data not shown). NP1 which has the highest variance accounted for 26.20% of the total variance. NP1 is described as higher concentrations of SFAs, MUFAs, and n-3 and n-6 PUFAs (all loading coefficients >0.40). NP2 is described by high concentrations of carotenoids (all loading coefficients ≥0.30), and NP3 is described by high concentrations of retinol, α-TP, and PK (all loading coefficients ≥0.40). The correlations of these nutrients in each NP are as depicted in Figure 1. The first five NPs accounted for 75.92% of the total variance of the original nutrient dataset.
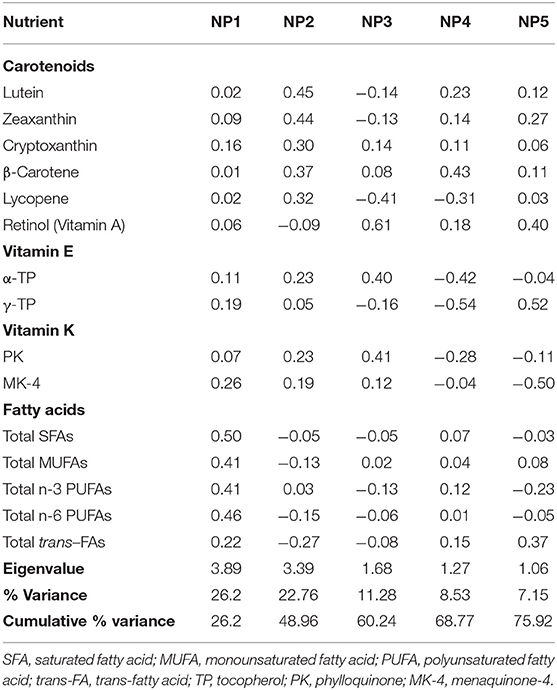
Table 3. Construction of nutrient patterns (NPs), NP structure and variance explained (n = 47).
Composite Scores on Cognitive Domains, Depression, and Activities of Daily Living
The time interval between the cognitive assessment at the time point closest to death and the autopsy was <1 year for all subjects with an average of 156 (93) days for those whose data could be accurately calculated (81%). Subjects with GDS 1–3 had significantly higher MMSE scores than those with GDS 4–7 (p < 0.001). Similarly, SIB score was higher in subjects with GDS 1–3 (p < 0.001). Therefore, GDS effectively separated subjects based on their performance on global cognition as also previously reported in the original GCS cohort (n = 244) (56). Further, the composite scores for cognitive domains, depression, and activities of daily living had been calculated (Supplementary Table 3). Subjects with GDS 1–3 had significantly higher composite scores on all six cognitive domains and activities of daily living, and significantly lower scores on depression (less depression). Of note, while composite scores for other cognitive domains were available for all subjects, visuospatial function score was available for 87% of participants without dementia and 50% of participants with dementia, and attention score was available for 70% of participants without demented and 46% of participants with dementia.
Relationship Between Brain Nutrient Concentrations and Cognition
Scores of the first five NPs were not statistically different between demented and non-demented subjects (data not shown). However, among non-demented subjects, subjects who had mild cognitive impairment (GDS 3, n = 11) had significantly lower NP2 score than that of cognitively intact subjects (GDS 1–2, n = 12, p = 0.002), but not for other NPs. The difference remained statistically significant after an adjustment for sex, education, hypertension, diabetes, and presence of APOE ε4 allele (p = 0.004).
A heat map was constructed to provide Pearson's partial correlation coefficients between NP scores or nutrient concentrations and scores on cognitive domains, depression, and activities of daily living in all subjects (Figure 2A, p-values provided in Supplementary Table 4A). Pearson's partial correlations were adjusted for sex, education, diabetes, hypertension, and presence of APOE ε4 allele. No consistent relationship between NPs and cognitive domain scores that reached statistical significance was observed.
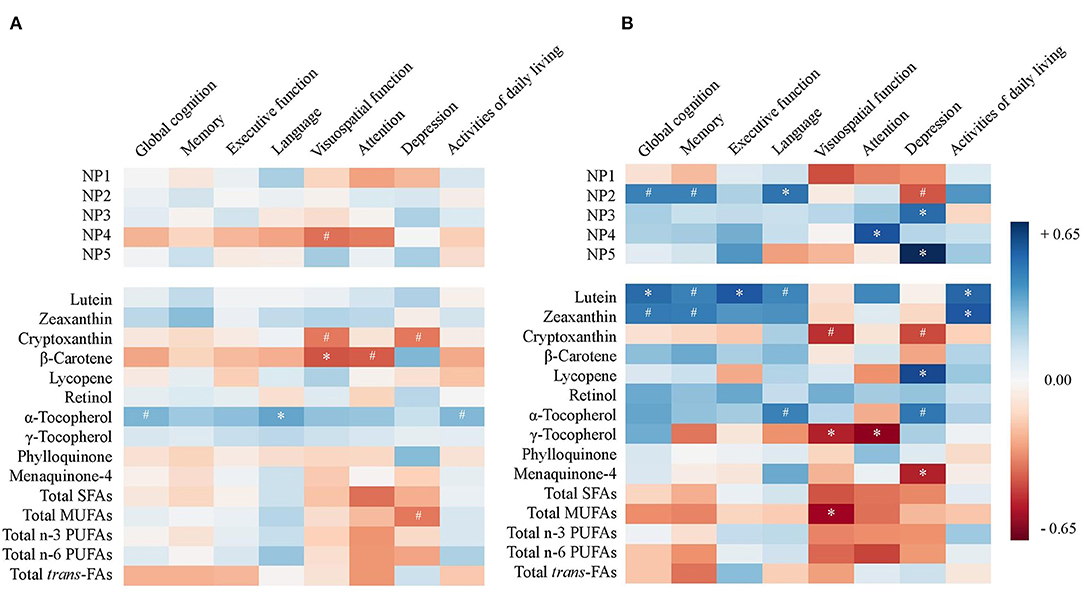
Figure 2. Heat map of Pearson's correlation coefficients between nutrient pattern (NP) scores or nutrient concentrations and scores on cognitive domains, depression, and activities of daily livings in (A) all subjects (n = 47) and (B) non-demented subjects (Global Deterioration Scale = 1–3, n = 23). Correlations are adjusted for sex, education, diabetes, hypertension, and APOE ε4 allele (#p < 0.10, *p < 0.05). SFA, saturated fatty acid; MUFA, monounsaturated fatty acid; PUFA, polyunsaturated fatty acid; trans-FA, trans-fatty acid.
A subset analysis among non-demented subjects (GDS 1–3) was performed and Pearson's coefficients are illustrated in a heat map (Figure 2B, p-values provided in Supplementary Table 4B). In the models adjusted for covariates among the five NPs representing the highest variances, NP2 was consistently associated with higher scores on global cognition (r = 0.38, p = 0.070), memory (r = 0.38, p = 0.073), language (r = 0.42, p = 0.046), and lower depression score (r = −0.40, p = 0.090) (Figure 3). After additional adjustment for antidepressant use, the correlation with lower depression score remained borderline significant (r = −0.35, p = 0.100). Since NP2 is mainly described by carotenoids, significant correlations were also consistently observed between lutein, zeaxanthin, β-carotene and scores on global cognition, memory, language, and depression. Other notable associations included NP3 and NP5 and higher depression. Additional adjustment for antithrombotic use was performed for PK and MK-4 and their correlations with different cognitive domain composite scores remained statistically non-significant (p > 0.05) for all six cognitive domains and activities of daily living, while the correlation between MK-4, but not PK, and depression remained statistically significant (Supplementary Table 4B).
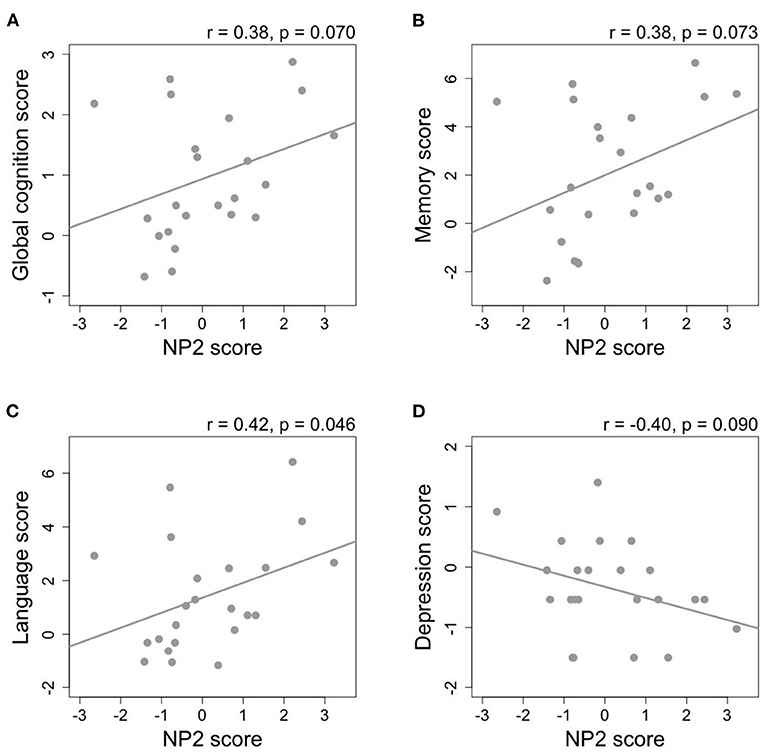
Figure 3. The relationship between nutrient pattern 2 (NP2) score and composite scores of (A) global cognition, (B) memory, (C) language, and (D) depression among non-demented subjects (Global Deterioration Scale = 1–3, n = 23). Pearson's correlation coefficients are adjusted for sex, education, diabetes, hypertension, and APOE ε4 allele.
Discussion
This study documents that brain NP high in carotenoids was consistently associated with better performance on multiple cognitive domains, activities of daily living, and lower depression among non-demented older adults in the GCS. Results also confirm previously established positive relationships between serum and brain concentrations of carotenoids in this group of subjects independent of their cognitive status (27). Given that serum concentrations of carotenoids likely reflect their habitual intake in the oldest old as previously discussed (27), our findings in the present study underscore the timing of intervention with diet high in carotenoid content before the onset of age-related dementia. This is further supported by the fact that nutrient concentrations and NP scores were not different between demented and non-demented subjects. Our exploratory findings also corroborate previous findings where serum levels of carotenoids are positively associated with better cognition in aging subjects (26, 32, 57–60). Specifically, higher serum lutein concentration was reported to be associated with better performance on language (32), which is similar to the correlation between NP2 and language score in this study.
The present analysis investigated concentrations of nutrients in the brain, the organ most relevant to cognition, as compared to previous studies that have established dietary or serum NPs with similar exploratory approaches (10, 11, 13, 15). Although the relationship between better adherence to a priori hypothesized intake patterns (such as MeDi, HDI, HEI, DASH, MIND) and lower risk of cognitive decline have been established (2), a priori hypothesized NPs are difficult with brain concentrations since little is known regarding nutrient uptake across the BBB and nutrient metabolism in neural tissue. For instance, SFAs and MUFAs can be de novo synthesized in the liver and CNS and may not reflect intake levels (61), and among n-3 PUFAs, DHA preferentially accumulates in neural tissue (62, 63). While substitution of SFA and trans-FA intakes with MUFAs and PUFAs decreases risk of age-related cognitive impairment in many prospective cohorts (64), our findings with brain content cannot be directly compared with intake levels of SFAs and MUFAs. It has also been reported that higher SFA content in membranes is usually associated with higher PUFA content to maintain membrane stability (65, 66), which likely explains the high correlation between SFA and unsaturated FA observed in the GCS brain tissues. Similarly, retinol is thought to be either taken up into the brain by STRA6, a retinol-binding protein-receptor detected at the BBB or derived directly from the cleavage of provitamin A carotenoids (β-carotene and β-cryptoxanthin) by the enzyme BCO1 detected in human brain (67, 68). It remains unknown how much each source contributes to vitamin A content in the brain. Moreover, a previous report on vitamin K metabolism in rat cerebellum also suggests that neural MK-4 content is regulated by the enzyme UBIAD1 (69). Overall, findings of nutrient levels in neural tissue need to be cautiously interpreted for dietary recommendations, especially for nutrients that can be derived from other substrates and nutrients whose levels are tightly regulated in the brain. Data on dietary intake in the GCS have been previously reported (70). However, the dietary assessment was subjective and might have overestimated or underestimated food intake, particularly in this population with varying degrees of cognitive performance. As a result, dietary intake data were not incorporated into the present analysis.
Age-related cognitive impairment, notwithstanding mixed clinical pathologies, shares molecular signatures of increased oxidative stress and neuroinflammation (71, 72). Both carotenoids and n-3 PUFAs, especially lutein and DHA both of which are selectively accumulated in the brain, have been proposed to interfere with the progression of cognitive impairment in aging, presumably owing to their antioxidative and anti-inflammatory properties (73, 74). Consistent with previous studies investigating neural concentrations of individual nutrients, a significant relationship was observed with lower carotenoids (mainly lutein and zeaxanthin) among cognitively impaired or demented subjects (26, 75–78). However, as previously discussed by Zamroziewicz and Barbey (22), univariate analytical approach with individual nutrients may be confounded by the effect of NPs and does not address the potentially interactive effects of multiple nutrients on cognitive health. An exploratory trial demonstrates that a combination of lutein and DHA supplements statistically improved performance on memory and learning in cognitively unimpaired elder women after 4 months whereas lutein or DHA supplement alone did not (79). Moreover, most individuals predominantly acquire nutrients from dietary sources that consist of a complex combination of nutrients. While a 6-month intervention with a lutein and zeaxanthin supplement failed to improve cognitive outcomes in subjects with or without Alzheimer's disease (80), a daily intervention with an avocado (a highly bioavailable source of 0.5 mg lutein and zeaxanthin, along with being a good source of potassium, B vitamins, vitamins C, E, K, MUFAs, and other non-essential phytochemicals) for 6 months has shown to improve cognitive performance on the Spatial Working Memory and the Stockings of Cambridge in non-demented subjects with low baseline intake of lutein-rich foods (81, 82). In the present analysis, a multivariate analysis approach (PCA) has been adopted to address correlations among nutrients and inspect the nutrition variable as NPs which reflect how multiple nutrients may synergistically function in the context of cognitive functioning and age-related cognitive impairment. This is an important step in the field of nutritional cognitive neuroscience toward the application of emerging technologies (such as metabolomics and brain magnetic resonance imaging) to systematically identify underlying mechanisms that mediate the effect that a combination of nutrients have on clinical outcomes (22, 32).
We acknowledge that this exploratory study is limited by a relatively small sample size (which is reflected by borderline significant p-values in Supplementary Table 4B) of mostly Caucasian women, and the inability to control for other covariates that may affect cognitive function such as alcohol and smoking history, physical activity, social interactions, and genetics (83). However, nutrient profiles and concentrations in this current analysis are similar to those of other cohorts of older adults (29–31, 84–88). NP1, described mostly by high fat content, was not associated with cognition in this population. Previous studies have reported benefits of diets high in n-3 PUFAs, especially DHA, on cognitive health (33, 89). While it is more appropriate to use absolute concentrations of FAs in the PCA, relative concentrations of FAs (i.e., FA composition) may be more relevant to the biological function of the brain. Additionally, it is unclear if the FA compositions in the brain of this cohort of the oldest old were in the normal range, since altered fatty acid compositions among cognitively impaired or demented subjects were reported (29–31), but no difference were observed between those with and without dementia in this study.
Other nutrients and dietary compounds such as B vitamins, vitamin D, minerals, and polyphenols that may be beneficial to cognitive health were also not examined in this study (90), but propose the opportunity to expand the scope of investigation. Nutrients that are not present in the brain but sharing common dietary sources with carotenoids and n-3 PUFAs, such as fibers in fruits, vegetables, nuts and seeds, may provide additional benefits to the central nervous system by functioning systemically through the regulation of reverse cholesterol transport, gut microbiota, and gut-brain axis signaling (91, 92). Finally, a cross-sectional study does not address a causal and longitudinal relationship between nutrition and cognition. A reverse causation where cognitive impairment leads to changes in nutrient uptake and metabolism—for example through BBB breakdown—is possible (23). However, dietary intervention in human trials and animal studies have indicated a significant impact that nutrition has on cognitive health in aging (93–95).
In summary, this report is the first to adopt a multivariate analysis approach to address the co-existence of nutrients and dietary compounds in the brain when investigating the relationship between nutrition and cognitive function in an aging population. Our findings support beneficial effects of a NP higher in carotenoids potentially derived from a diet rich in fruits and vegetables similar to the MeDi and DASH diets, on lowering the risk of age-related cognitive impairment and dementia previously reported (2, 93, 94). As compared to symptoms of nutritional deficiency which could be caused by an inadequate intake of one single nutrient and manifest within a short period of time, we are aware of the need to assess diet as a dietary pattern or NP in a context of complex outcomes such as age-related cognitive impairment (20–22). The synergistic and cumulative effect of nutrients on a person's risk of chronic diseases have recently been highlighted in the Dietary Guidelines for Americans 2015–2020 and 2020–2025 (96, 97).
Data Availability Statement
The data analyzed in this study is subject to the following licenses/restrictions: The data set is not publicly available but it is available on request from the corresponding author, Elizabeth J. Johnson. Requests to access these datasets should be directed to ZWxpemFiZXRoLmpvaG5zb25AdHVmdHMuZWR1.
Ethics Statement
The studies involving human participants were reviewed and approved by the University of Georgia Institutional Review Board. Separate approval for using de-identified data for the present analyses was obtained from the Tufts University/Tufts Medical Center Institutional Review Board. The patients/participants provided their written informed consent to participate in this study.
Author Contributions
JT, TMS, MAJ, LWP, and EJJ designed the study. MAJ and LWP contributed to the original design of the GCS and collection of biological samples. RV analyzed carotenoid, vitamin A, and vitamin E concentrations in all samples. NRM and AHL analyzed fatty acid concentration in all samples. GF analyzed vitamin K concentrations in all samples. JT performed statistical analysis, wrote the paper, and had primary responsibility for final content. All authors interpreted the data, contributed to the article, and approved the submitted version.
Funding
This work was supported by Abbott Nutrition, DSM Nutritional Products, NIA 1P01-AG17553, USDA 8050-51000-095-01S, and USDA agreement 588-1950-9-001.
Conflict of Interest
The authors declare that the research was conducted in the absence of any commercial or financial relationships that could be construed as a potential conflict of interest.
Supplementary Material
The Supplementary Material for this article can be found online at: https://www.frontiersin.org/articles/10.3389/fnut.2021.704691/full#supplementary-material
References
1. van der Flier WM, Scheltens P. Epidemiology and risk factors of dementia. J Neurol Neurosurg Psychiatry. (2005) 76(Suppl. 5):v2–7. doi: 10.1136/jnnp.2005.082867
2. van de Rest O, Berendsen AA, Haveman-Nies A, de Groot LC. Dietary patterns, cognitive decline, and dementia: a systematic review. Adv Nutr. (2015) 6:154–68. doi: 10.3945/an.114.007617
3. Trichopoulou A, Kouris-Blazos A, Wahlqvist ML, Gnardellis C, Lagiou P, Polychronopoulos E, et al. Diet and overall survival in elderly people. BMJ. (1995) 311:1457–60. doi: 10.1136/bmj.311.7018.1457
4. Zamroziewicz MK, Barbey AK. The mediterranean diet and healthy brain aging: innovations from nutritional cognitive neuroscience. In: Farooqui T, Farooqui AA, editors. Role of the Mediterranean Diet in the Brain and Neurodegenerative Diseases. London: Academic Press (2018). p. 17–33. doi: 10.1016/B978-0-12-811959-4.00002-X
5. Huijbregts P, Feskens E, Räsänen L, Fidanza F, Nissinen A, Menotti A, et al. Dietary pattern and 20 year mortality in elderly men in Finland, Italy, and The Netherlands: longitudinal cohort study. BMJ. (1997) 315:13–7. doi: 10.1136/bmj.315.7099.13
6. Kennedy ET, Ohls J, Carlson S, Fleming K. The Healthy Eating Index: design and applications. J Am Diet Assoc. (1995) 95:1103–8. doi: 10.1016/S0002-8223(95)00300-2
7. Svetkey LP, Sacks FM, Obarzanek E, Vollmer WM, Appel LJ, Lin PH, et al. The DASH Diet, Sodium Intake and Blood Pressure Trial (DASH-sodium): rationale and design. DASH-Sodium Collaborative Research Group. J Am Diet Assoc. (1999) 99:S96–104. doi: 10.1016/S0002-8223(99)00423-X
8. Morris MC, Tangney CC, Wang Y, Sacks FM, Bennett DA, Aggarwal NT. MIND diet associated with reduced incidence of Alzheimer's disease. Alzheimers Dement. (2015) 11:1007–14. doi: 10.1016/j.jalz.2014.11.009
9. Samieri C, Jutand M-A, Féart C, Capuron L, Letenneur L, Barberger-Gateau P. Dietary patterns derived by hybrid clustering method in older people: association with cognition, mood, and self-rated health. J Am Diet Assoc. (2008) 108:1461–71. doi: 10.1016/j.jada.2008.06.437
10. Kesse-Guyot E, Andreeva VA, Jeandel C, Ferry M, Hercberg S, Galan P. A healthy dietary pattern at midlife is associated with subsequent cognitive performance. J Nutr. (2012) 142:909–15. doi: 10.3945/jn.111.156257
11. Berti V, Murray J, Davies M, Spector N, Tsui WH, Li Y, et al. Nutrient patterns and brain biomarkers of Alzheimer's disease in cognitively normal individuals. J Nutr Health Aging. (2015) 19:413–23. doi: 10.1007/s12603-014-0534-0
12. Chan R, Chan D, Woo J. A cross sectional study to examine the association between dietary patterns and cognitive impairment in older Chinese people in Hong Kong. J Nutr Health Aging. (2013) 17:757–65. doi: 10.1007/s12603-013-0348-5
13. Gu Y, Nieves JW, Stern Y, Luchsinger JA, Scarmeas N. Food combination and Alzheimer disease risk: a protective diet. Arch Neurol. (2010) 67:699–706. doi: 10.1001/archneurol.2010.84
14. Bowman GL, Shannon J, Ho E, Traber MG, Frei B, Oken BS, et al. Reliability and validity of food frequency questionnaire and nutrient biomarkers in elders with and without mild cognitive impairment. Alzheimer Dis Assoc Disord. (2011) 25:49–57. doi: 10.1097/WAD.0b013e3181f333d6
15. Bowman GL, Silbert LC, Howieson D, Dodge HH, Traber MG, Frei B, et al. Nutrient biomarker patterns, cognitive function, and MRI measures of brain aging. Neurology. (2012) 78:241–9. doi: 10.1212/WNL.0b013e3182436598
16. Zwilling CE, Talukdar T, Zamroziewicz MK, Barbey AK. Nutrient biomarker patterns, cognitive function, and fMRI measures of network efficiency in the aging brain. Neuroimage. (2019) 188:239–51. doi: 10.1016/j.neuroimage.2018.12.007
17. Zamroziewicz MK, Talukdar MT, Zwilling CE, Barbey AK. Nutritional status, brain network organization, and general intelligence. Neuroimage. (2017) 161:241–50. doi: 10.1016/j.neuroimage.2017.08.043
18. Talukdar T, Zamroziewicz MK, Zwilling CE, Barbey AK. Nutrient biomarkers shape individual differences in functional brain connectivity: Evidence from omega-3 PUFAs. Hum Brain Mapp. (2019) 40:1887–97. doi: 10.1002/hbm.24498
19. Campos-Bedolla P, Walter FR, Veszelka S, Deli MA. Role of the blood-brain barrier in the nutrition of the central nervous system. Arch Med Res. (2014) 45:610–38. doi: 10.1016/j.arcmed.2014.11.018
20. Coley N, Vaurs C, Andrieu S. Nutrition and cognition in aging adults. Clin Geriatr Med. (2015) 31:453–64. doi: 10.1016/j.cger.2015.04.008
21. Jacques PF, Tucker KL. Are dietary patterns useful for understanding the role of diet in chronic disease? Am J Clin Nutr. (2001) 73:1–2. doi: 10.1093/ajcn/73.1.1
22. Zamroziewicz MK, Barbey AK. Nutritional cognitive neuroscience: innovations for healthy brain aging. Front Neurosci. (2016) 10:240. doi: 10.3389/fnins.2016.00240
23. Vauzour D, Camprubi-Robles M, Miquel-Kergoat S, Andres-Lacueva C, Bánáti D, Barberger-Gateau P, et al. Nutrition for the ageing brain: towards evidence for an optimal diet. Ageing Res Rev. (2017) 35:222–40. doi: 10.1016/j.arr.2016.09.010
24. Osimani A, Berger A, Friedman J, Porat-Katz B-S, Abarbanel JM. Neuropsychology of vitamin B12 deficiency in elderly dementia patients and control subjects. J Geriatr Psychiatry Neurol. (2005) 18:33–8. doi: 10.1177/0891988704272308
25. Morris MC, Schneider JA, Tangney CC. Thoughts on B-vitamins and dementia. J Alzheimers Dis. (2006) 9:429–33. doi: 10.3233/JAD-2006-9409
26. Johnson EJ, Vishwanathan R, Johnson MA, Hausman DB, Davey A, Scott TM, et al. Relationship between serum and brain carotenoids, α-Tocopherol, and retinol concentrations and cognitive performance in the oldest old from the georgia centenarian study. J Aging Res. (2013) 2013:951786. doi: 10.1155/2013/951786
27. Tanprasertsuk J, Mohn ES, Matthan NR, Lichtenstein AH, Barger K, Vishwanathan R, et al. Serum carotenoids, tocopherols, Total n-3 polyunsaturated fatty acids, and n-6/n-3 polyunsaturated fatty acid ratio reflect brain concentrations in a cohort of centenarians. J Gerontol A Biol Sci Med Sci. (2019) 74:306–14. doi: 10.1093/gerona/gly125
28. Tanprasertsuk J, Ferland G, Johnson MA, Poon LW, Scott TM, Barbey AK, et al. Concentrations of circulating phylloquinone, but not cerebral menaquinone-4, are positively correlated with a wide range of cognitive measures: exploratory findings in centenarians. J Nutr. (2020) 150:82–90. doi: 10.1093/jn/nxz200
29. Fraser T, Tayler H, Love S. Fatty acid composition of frontal, temporal and parietal neocortex in the normal human brain and in Alzheimer's disease. Neurochem Res. (2010) 35:503–13. doi: 10.1007/s11064-009-0087-5
30. Cunnane SC, Schneider JA, Tangney C, Tremblay-Mercier J, Fortier M, Bennett DA, et al. Plasma and brain fatty acid profiles in mild cognitive impairment and Alzheimer's disease. J Alzheimers Dis. (2012) 29:691–7. doi: 10.3233/JAD-2012-110629
31. Söderberg M, Edlund C, Kristensson K, Dallner G. Fatty acid composition of brain phospholipids in aging and in Alzheimer's disease. Lipids. (1991) 26:421–5. doi: 10.1007/BF02536067
32. Zamroziewicz MK, Paul EJ, Zwilling CE, Johnson EJ, Kuchan MJ, Cohen NJ, et al. Parahippocampal cortex mediates the relationship between lutein and crystallized intelligence in healthy, older adults. Front Aging Neurosci. (2016) 8:379. doi: 10.3389/fnagi.2016.00297
33. Zamroziewicz MK, Paul EJ, Zwilling CE, Barbey AK. Predictors Of Memory In Healthy Aging: Polyunsaturated Fatty Acid Balance And Fornix White Matter Integrity. Aging Dis. (2017) 8:372–83. doi: 10.14336/AD.2017.0501
34. Poon LW, Jazwinski M, Green RC, Woodard JL, Martin P, Rodgers WL, et al. Methodological considerations in studying centenarians: lessons learned from the georgia centenarian studies. Annu Rev Gerontol Geriatr. (2007) 27:231–64.
35. Shaw K, Gearing M, Davey A, Burgess M, Poon LW, Martin P, et al. Successful recruitment of centenarians for post-mortem brain donation: results from the georgia centenarian study. J Biosci Med. (2012) 2:124.
36. Vishwanathan R, Neuringer M, Snodderly DM, Schalch W, Johnson EJ. Macular lutein and zeaxanthin are related to brain lutein and zeaxanthin in primates. Nutr Neurosci. (2013) 16:21–9. doi: 10.1179/1476830512Y.0000000024
37. Carrié I, Bélanger E, Portoukalian J, Rochford J, Ferland G. Lifelong low-phylloquinone intake is associated with cognitive impairments in old rats. J Nutr. (2011) 141:1495–501. doi: 10.3945/jn.110.137638
38. Folch J, Lees M, Sloane Stanley GH. A simple method for the isolation and purification of total lipides from animal tissues. J Biol Chem. (1957) 226:497–509. doi: 10.1016/S0021-9258(18)64849-5
39. Lichtenstein AH, Matthan NR, Jalbert SM, Resteghini NA, Schaefer EJ, Ausman LM. Novel soybean oils with different fatty acid profiles alter cardiovascular disease risk factors in moderately hyperlipidemic subjects. Am J Clin Nutr. (2006) 84:497–504. doi: 10.1093/ajcn/84.3.497
40. Tanprasertsuk J, Li B, Bernstein PS, Vishwanathan R, Johnson MA, Poon L, et al. Relationship between concentrations of lutein and StARD3 among pediatric and geriatric human brain tissue. PLoS ONE. (2016) 11:e0155488. doi: 10.1371/journal.pone.0155488
41. Reisberg B, Ferris SH, de Leon MJ, Crook T. The Global Deterioration Scale for assessment of primary degenerative dementia. Am J Psychiatry. (1982) 139:1136–9. doi: 10.1176/ajp.139.9.1136
42. Folstein MF, Folstein SE, McHugh PR. “Mini-mental state”: a practical method for grading the cognitive state of patients for the clinician. J Psychiatr Res. (1975) 12:189–98. doi: 10.1016/0022-3956(75)90026-6
43. Panisset M, Roudier M, Saxton J, Boller F. Severe impairment battery. a neuropsychological test for severely demented patients. Arch Neurol. (1994) 51:41–5. doi: 10.1001/archneur.1994.00540130067012
45. Benton A, Hamsler K. Multilingual Aphasia Examination. Iowa City, IA: University of Iowa (1997).
46. Wechsler D. Wechsler Adult Intelligence Scale-III. San Antonio, TX,: The Psychological Corporation (1997). doi: 10.1037/t49755-000
47. Grigsby J, Kaye K, Robbins LJ. Reliabilities, norms and factor structure of the behavioral dyscontrol scale. Percept Mot Skills. (1992) 74:883–92. doi: 10.2466/pms.1992.74.3.883
48. Chandler MJ, Lacritz LH, Hynan LS, Barnard HD, Allen G, Deschner M, et al. A total score for the CERAD neuropsychological battery. Neurology. (2005) 65:102–6. doi: 10.1212/01.wnl.0000167607.63000.38
49. Atkinson RC, Shiffrin RM. The control of short-term memory. Sci Am. (1971) 225:82–90. doi: 10.1038/scientificamerican0871-82
50. Sheikh JI, Yesavage JA. Geriatric Depression Scale (GDS): recent evidence and development of a shorter version. Clin Gerontol. (1986) 5:165–73. doi: 10.1300/J018v05n01_09
51. Loewenstein DA, Amigo E, Duara R, Guterman A, Hurwitz D, Berkowitz N, et al. A new scale for the assessment of functional status in Alzheimer's disease and related disorders. J Gerontol. (1989) 44:P114–21. doi: 10.1093/geronj/44.4.P114
52. Welsh-Bohmer KA, Mohs RC. Neuropsychological assessment of Alzheimer's disease. Neurology. (1997) 49:S11–3. doi: 10.1212/WNL.49.3_Suppl_3.S11
53. Tanprasertsuk J, Johnson EJ, Johnson MA, Poon LW, Nelson PT, Davey A, et al. Clinico-neuropathological findings in the oldest old from the georgia centenarian study. J Alzheimers Dis. (2019) 70:35–49. doi: 10.3233/JAD-181110
54. Stacklies W, Redestig H, Scholz M, Walther D, Selbig J. pcaMethods–a bioconductor package providing PCA methods for incomplete data. Bioinformatics. (2007) 23:1164–67. doi: 10.1093/bioinformatics/btm069
55. Wold H. Estimation of principal components and related models by iterative least squares. In: Krishnaiah PR, editor. Multivariate Analysis. New York, NY: Academic Press (1966). p. 391–420.
56. Davey A, Dai T, Woodard JL, Miller LS, Gondo Y, Johnson MA, et al. Profiles of cognitive functioning in a population-based sample of centenarians using factor mixture analysis. Exp Aging Res. (2013) 39:125–44. doi: 10.1080/0361073X.2013.761869
57. Feart C, Letenneur L, Helmer C, Samieri C, Schalch W, Etheve S, et al. Plasma carotenoids are inversely associated with dementia risk in an elderly french cohort. J Gerontol A Biol Sci Med Sci. (2016) 71:683–8. doi: 10.1093/gerona/glv135
58. Kiko T, Nakagawa K, Tsuduki T, Suzuki T, Arai H, Miyazawa T. Significance of lutein in red blood cells of Alzheimer's disease patients. J Alzheimers Dis. (2012) 28:593–600. doi: 10.3233/JAD-2011-111493
59. Nolan JM, Loskutova E, Howard AN, Moran R, Mulcahy R, Stack J, et al. Macular pigment, visual function, and macular disease among subjects with Alzheimer's disease: an exploratory study. J Alzheimers Dis. (2014) 42:1191–202. doi: 10.3233/JAD-140507
60. Mecocci P, Polidori MC, Cherubini A, Ingegni T, Mattioli P, Catani M, et al. Lymphocyte oxidative DNA damage and plasma antioxidants in Alzheimer disease. Arch Neurol. (2002) 59:794–8. doi: 10.1001/archneur.59.5.794
61. Agranoff BW, Benjamins JA, Hajra AK. Brain Lipid Biosynthesis. Lippincott-Raven (1999). Available online at: https://www.ncbi.nlm.nih.gov/books/NBK27970/ (accessed November 2, 2020).
62. Carver JD, Benford VJ, Han B, Cantor AB. The relationship between age and the fatty acid composition of cerebral cortex and erythrocytes in human subjects. Brain Res Bull. (2001) 56:79–85. doi: 10.1016/S0361-9230(01)00551-2
63. Papanikolaou Y, Brooks J, Reider C, Fulgoni VL 3rd. U.S. adults are not meeting recommended levels for fish and omega-3 fatty acid intake: results of an analysis using observational data from NHANES 2003-2008. Nutr J. (2014) 13:31. doi: 10.1186/1475-2891-13-64
64. Morris MC, Tangney CC. Dietary fat composition and dementia risk. Neurobiol Aging. (2014) 35(Suppl. 2):S59–64. doi: 10.1016/j.neurobiolaging.2014.03.038
65. Maulucci G, Cohen O, Daniel B, Sansone A, Petropoulou PI, Filou S, et al. Fatty acid-related modulations of membrane fluidity in cells: detection and implications. Free Radic Res. (2016) 50:S40–50. doi: 10.1080/10715762.2016.1231403
66. Muriana FJ, Vazquez CM, Ruiz-Gutierrez V. Fatty acid composition and properties of the liver microsomal membrane of rats fed diets enriched with cholesterol. J Biochem. (1992) 112:562–7. doi: 10.1093/oxfordjournals.jbchem.a123939
67. Kawaguchi R, Yu J, Honda J, Hu J, Whitelegge J, Ping P, et al. A membrane receptor for retinol binding protein mediates cellular uptake of vitamin A. Science. (2007) 315:820–5. doi: 10.1126/science.1136244
68. Yan W, Jang GF, Haeseleer F, Esumi N, Chang J, Kerrigan M, et al. Cloning and characterization of a human beta,beta-carotene-15,15'-dioxygenase that is highly expressed in the retinal pigment epithelium. Genomics. (2001) 72:193–202. doi: 10.1006/geno.2000.6476
69. Okano T, Shimomura Y, Yamane M, Suhara Y, Kamao M, Sugiura M, et al. Conversion of phylloquinone (Vitamin K1) into menaquinone-4 (Vitamin K2) in mice: two possible routes for menaquinone-4 accumulation in cerebra of mice. J Biol Chem. (2008) 283:11270–79. doi: 10.1074/jbc.M702971200
70. Johnson MA, Davey A, Hausman DB, Park S, Poon LW, Georgia Centenarian Study. Dietary differences between centenarians residing in communities and in skilled nursing facilities: the Georgia Centenarian Study. Age. (2006) 28:333–41. doi: 10.1007/s11357-006-9021-9
71. Perry G, Mondragón-Rodríguez S, Nunomura A, Zhu X, Moreira PI, Smith MA. Oxidative stress and balance in neurodegenerative diseases. In: Dickson DW, Weller RO, editors. Neurodegeneration: The Molecular Pathology of Dementia and Movement Disorders. Oxford: Wiley-Blackwell (2011). p. 10–12. doi: 10.1002/9781444341256.ch3
72. Pasqualetti G, Brooks DJ, Edison P. The role of neuroinflammation in dementias. Curr Neurol Neurosci Rep. (2015) 15:17. doi: 10.1007/s11910-015-0531-7
73. Lieblein-Boff JC, Johnson EJ, Kennedy AD, Lai C-S, Kuchan MJ. Exploratory metabolomic analyses reveal compounds correlated with lutein concentration in frontal cortex, hippocampus, and occipital cortex of human infant brain. PLoS ONE. (2015) 10:e0136904. doi: 10.1371/journal.pone.0136904
74. Devassy JG, Leng S, Gabbs M, Monirujjaman M, Aukema HM. Omega-3 polyunsaturated fatty acids and oxylipins in neuroinflammation and management of Alzheimer disease. Adv Nutr. (2016) 7:905–16. doi: 10.3945/an.116.012187
75. Feeney J, Finucane C, Savva GM, Cronin H, Beatty S, Nolan JM, et al. Low macular pigment optical density is associated with lower cognitive performance in a large, population-based sample of older adults. Neurobiol Aging. (2013) 34:2449–56. doi: 10.1016/j.neurobiolaging.2013.05.007
76. Vishwanathan R, Iannaccone A, Scott TM, Kritchevsky SB, Jennings BJ, Carboni G, et al. Macular pigment optical density is related to cognitive function in older people. Age Ageing. (2014) 43:271–5. doi: 10.1093/ageing/aft210
77. Renzi LM, Dengler MJ, Puente A, Miller LS, Hammond BR Jr. Relationships between macular pigment optical density and cognitive function in unimpaired and mildly cognitively impaired older adults. Neurobiol Aging. (2014) 35:1695–9. doi: 10.1016/j.neurobiolaging.2013.12.024
78. Kelly D, Coen RF, Akuffo KO, Beatty S, Dennison J, Moran R, et al. Cognitive function and its relationship with macular pigment optical density and serum concentrations of its constituent carotenoids. J Alzheimers Dis. (2015) 48:261–77. doi: 10.3233/JAD-150199
79. Johnson EJ, McDonald K, Caldarella SM, Chung H-Y, Troen AM, Snodderly DM. Cognitive findings of an exploratory trial of docosahexaenoic acid and lutein supplementation in older women. Nutr Neurosci. (2008) 11:75–83. doi: 10.1179/147683008X301450
80. Nolan JM, Loskutova E, Howard A, Mulcahy R, Moran R, Stack J, et al. The impact of supplemental macular carotenoids in Alzheimer's disease: a randomized clinical trial. J Alzheimers Dis. (2015) 44:1157–69. doi: 10.3233/JAD-142265
81. Scott TM, Rasmussen HM, Chen O, Johnson EJ. Avocado consumption increases macular pigment density in older adults: a randomized, controlled trial. Nutrients. (2017) 9:919. doi: 10.3390/nu9090919
82. US Department of Agriculture, Agriculture Research Service, Nutrient Data Laboratory. USDA National Nutrient Database for Standard Reference, Legacy. Version Current: April 2018. (2018). Available online at: http://www.ars.usda.gov/ba/bhnrc/ndl (accessed January 9, 2019).
83. Clare L, Wu Y-T, Teale JC, MacLeod C, Matthews F, Brayne C, et al. Potentially modifiable lifestyle factors, cognitive reserve, and cognitive function in later life: a cross-sectional study. PLoS Med. (2017) 14:e1002259. doi: 10.1371/journal.pmed.1002259
84. Craft NE, Haitema TB, Garnett KM, Fitch KA, Dorey CK. Carotenoid, tocopherol, and retinol concentrations in elderly human brain. J Nutr Health Aging. (2004) 8:156–62.
85. de Leeuw FA, Schneider JA, Agrawal S, Leurgans SE, Morris MC. Brain tocopherol levels are associated with lower activated microglia density in elderly human cortex. Alzheimers Dement. (2020) 6:e12021. doi: 10.1002/trc2.12021
86. Fu X, Shea MK, Dolnikowski GG, Patterson WB, Dawson-Hughes B, Holland TM, et al. Vitamin D and Vitamin K concentrations in human brain tissue are influenced by freezer storage time: the memory and aging project. J Nutr. (2021) 151:104–8. doi: 10.1093/jn/nxaa336
87. Thijssen HH, Drittij-Reijnders MJ. Vitamin K status in human tissues: tissue-specific accumulation of phylloquinone and menaquinone-4. Br J Nutr. (1996) 75:121–7. doi: 10.1079/BJN19960115
88. Vishwanathan R, Schalch W, Johnson EJ. Macular pigment carotenoids in the retina and occipital cortex are related in humans. Nutr Neurosci. (2016) 19:95–101. doi: 10.1179/1476830514Y.0000000141
89. Yanai H. Effects of N-3 polyunsaturated fatty acids on dementia. J Clin Med Res. (2017) 9:1–9. doi: 10.14740/jocmr2815w
90. Gómez-Pinilla F. Brain foods: the effects of nutrients on brain function. Nat Rev Neurosci. (2008) 9:568–78. doi: 10.1038/nrn2421
91. Zhu X, Han Y, Du J, Liu R, Jin K, Yi W. Microbiota-gut-brain axis and the central nervous system. Oncotarget. (2017) 8:53829–38. doi: 10.18632/oncotarget.17754
92. Gunness P, Gidley MJ. Mechanisms underlying the cholesterol-lowering properties of soluble dietary fibre polysaccharides. Food Funct. (2010) 1:149–55. doi: 10.1039/c0fo00080a
93. Martínez-Lapiscina EH, Clavero P, Toledo E, Estruch R, Salas-Salvadó J, San Julián B, et al. Mediterranean diet improves cognition: the PREDIMED-NAVARRA randomised trial. J Neurol Neurosurg Psychiatry. (2013) 84:1318–25. doi: 10.1136/jnnp-2012-304792
94. Smith PJ, Blumenthal JA, Babyak MA, Craighead L, Welsh-Bohmer KA, Browndyke JN, et al. Effects of the dietary approaches to stop hypertension diet, exercise, and caloric restriction on neurocognition in overweight adults with high blood pressure. Hypertension. (2010) 55:1331–8. doi: 10.1161/HYPERTENSIONAHA.109.146795
95. Willis LM, Shukitt-Hale B, Joseph JA. Modulation of cognition and behavior in aged animals: role for antioxidant- and essential fatty acid–rich plant foods. Am J Clin Nutr. (2009) 89:1602S−6S. doi: 10.3945/ajcn.2009.26736J
96. U.S. Department of Health Human Services U.S. Department of Agriculture. 2015-2020 Dietary Guidelines for Americans 8th Edition. (2015). Available online at: http://health.gov/dietaryguidelines/2015/guidelines/ (accessed November 2, 2020).
97. U.S. Department of Health Human Services U.S. Department of Agriculture. 2020-2025 Dietary Guidelines for Americans 9th Edition. (2020). Available online at: https://www.dietaryguidelines.gov/resources/2020-2025-dietary-guidelines-online-materials (accessed February 17, 2021).
Keywords: dementia, cognition, carotenoids, vitamin A, vitamin E, vitamin K, fatty acids, centenarian adults
Citation: Tanprasertsuk J, Scott TM, Barbey AK, Barger K, Wang XD, Johnson MA, Poon LW, Vishwanathan R, Matthan NR, Lichtenstein AH, Ferland G and Johnson EJ (2021) Carotenoid-Rich Brain Nutrient Pattern Is Positively Correlated With Higher Cognition and Lower Depression in the Oldest Old With No Dementia. Front. Nutr. 8:704691. doi: 10.3389/fnut.2021.704691
Received: 03 May 2021; Accepted: 31 May 2021;
Published: 29 June 2021.
Edited by:
David Vauzour, University of East Anglia, United KingdomReviewed by:
Justyna Godos, University of Catania, ItalyDonato Angelino, University of Teramo, Italy
Copyright © 2021 Tanprasertsuk, Scott, Barbey, Barger, Wang, Johnson, Poon, Vishwanathan, Matthan, Lichtenstein, Ferland and Johnson. This is an open-access article distributed under the terms of the Creative Commons Attribution License (CC BY). The use, distribution or reproduction in other forums is permitted, provided the original author(s) and the copyright owner(s) are credited and that the original publication in this journal is cited, in accordance with accepted academic practice. No use, distribution or reproduction is permitted which does not comply with these terms.
*Correspondence: Elizabeth J. Johnson, ZWxpemFiZXRoLmpvaG5zb25AdHVmdHMuZWR1