 Wenting Hu
 Ying Zhang
 Huanxian Liu
- 1Department of Neurology, Chengdu Integrated TCM and Western Medicine Hospital, Chengdu, China
- 2Department of Anus and Intestine Surgery, Chengdu Integrated TCM and Western Medicine Hospital, Chengdu, China
- 3Department of Neurology, Medical School of Chinese PLA General Hospital, Beijing, China
- 4Yiyang Retired Cadres Sanatorium of the Hunan Province, Yiyang, China
Background: Previous studies have explored the associations between obesity and Parkinson’s disease (PD), often using body mass index (BMI) as the main metric. However, findings remain inconsistent. Anthropometric indices—quantitative measures of body shape, size, and fat distribution—offer alternative ways to assess adiposity. This study aimed to evaluate the associations between eight anthropometric indices and PD prevalence.
Methods: Data were obtained from the National Health and Nutrition Examination Survey (NHANES), conducted in the U.S. from 1999 to 2020. A total of 41,374 participants aged 20 years and older were included, among whom 354 were diagnosed with PD. Eight anthropometric indices were analyzed: waist-to-weight index (WWI), conicity index (CI), a body shape index (ABSI), body roundness index (BRI), waist-to-height ratio (WHtR), BMI, waist circumference (WC), and weight (WT). Weighted multivariable logistic regression models were used to assess the association between these indices and PD. Restricted cubic spline (RCS) models were employed to examine dose–response relationships. Subgroup and sensitivity analyses were conducted to validate the robustness of the findings.
Results: Significant differences were observed between the study groups, with positive and independent correlations identified between PD and all anthropometric measures, except BMI. After full adjustment, each 1-standard deviation increase in WWI, CI, ABSI, BRI, WHtR, WC, and WT was associated with an elevated PD risk by 34, 42, 36, 18, 21, 25, and 16%, respectively. RCS analysis revealed a linear relationship between CI, ABSI, BRI, WtHR, WC, WT, and PD prevalence, whereas WWI exhibited a nonlinear association. The subgroup and sensitivity analyses confirmed the consistency of these associations.
Conclusion: Higher values of several anthropometric indices, particularly the ABSI, WWI, and CI, were associated with increased PD prevalence. These findings highlight the potential role of fat distribution rather than overall adiposity in PD pathogenesis. Anthropometric measures may be valuable tools for early PD risk identification and targeted prevention strategies.
1 Introduction
Parkinson’s disease (PD) is a progressive neurodegenerative disorder characterized by motor dysfunction, primarily manifesting as resting tremors, rigidity, bradykinesia, and postural instability (1). It is currently the second most common neurodegenerative disease after Alzheimer’s disease, affecting over 11.77 million people worldwide as of 2021 (2). With increasing life expectancy and global population aging, the prevalence of PD is expected to increase, placing a substantial burden on individuals, caregivers, and healthcare systems globally (3–6). Despite advances in symptom management, no therapies currently exist that can halt or reverse the progression of PD (7, 8). Consequently, identifying modifiable risk factors is crucial for improving early detection and prevention strategies (9).
Obesity has been implicated in various chronic diseases, including neurodegenerative disorders. However, the relationship between obesity, typically assessed using body mass index (BMI), and PD risk remains controversial. Although some studies have suggested that a higher BMI may elevate the risk of PD, others have reported no significant association or even an inverse correlation (10–16). These inconsistencies may be attributed to variations in the study populations, methodologies, and specific anthropometric measures used to assess obesity. Although BMI remains widely used in clinical and epidemiological contexts, it is increasingly recognized as a crude indicator that does not distinguish fat mass from lean mass or account for fat distribution (17). Therefore, there is an urgent need for more precise anthropometric indices to better evaluate the relationship between obesity and the risk of PD.
Recently, alternative anthropometric indices, including the body roundness index (BRI) (18, 19), a body shape index (ABSI) (20, 21), conicity index (CI) (22), waist-to-height ratio (WHtR) (23), and waist-to-weight index (WWI) (24) have been proposed to improve the assessment of fat distribution. These indices have been linked to cardiovascular diseases, type 2 diabetes, and metabolic syndrome (25–27), as they account for different patterns of fat accumulation. However, evidence regarding the association between these alternative anthropometric measures and PD risk remains limited.
This study aimed to explore the relationship between eight anthropometric indices (WWI, CI, ABSI, BRI, WHtR, BMI), waist circumference (WC), and weight (WT) and the prevalence of PD using data from the National Health and Nutrition Examination Survey (NHANES) from 1999 to 2020. By investigating these relationships, this study sought to provide new insights into the role of body fat distribution in PD development, offering potential implications for early identification and prevention strategies targeting high-risk populations.
2 Materials and methods
2.1 Data source
This cross-sectional study was conducted using publicly available secondary data from the NHANES, administered by the Centers for Disease Control and Prevention (CDC) between 1999 and 2020.1 The NHANES employs a complex, multistage probability sampling design to obtain a nationally representative sample of the non-institutionalized U.S. population. Data were originally collected by trained CDC personnel through mobile examination centers (MECs), which included structured household interviews, standardized physical examinations, and laboratory assessments. This study adhered to the Strengthening of the Reporting of Observational Studies in Epidemiology (STROBE) guidelines.
2.2 Standard protocol approval, registration, and patient consent
The National Center for Health Statistics Institutional Review Board approved the NHANES protocol, and all participants provided written informed consent for data collection. As this study involved secondary data analysis, additional Institutional Review Board approval was not required. The dataset is publicly available on the NHANES official website: https://www.cdc.gov/nchs/nhanes/index.html.
2.3 Study design and population
The analysis included individuals aged 20 years and older who completed the NHANES survey and had their data available on anthropometric measurements and PD. Several exclusion criteria were applied to ensure the validity of the dataset. Participants were excluded if they had missing data on height, WT, WC, and PD, or lacked data on relevant covariates. Figure 1 illustrates the specific inclusion and exclusion criteria in detail.
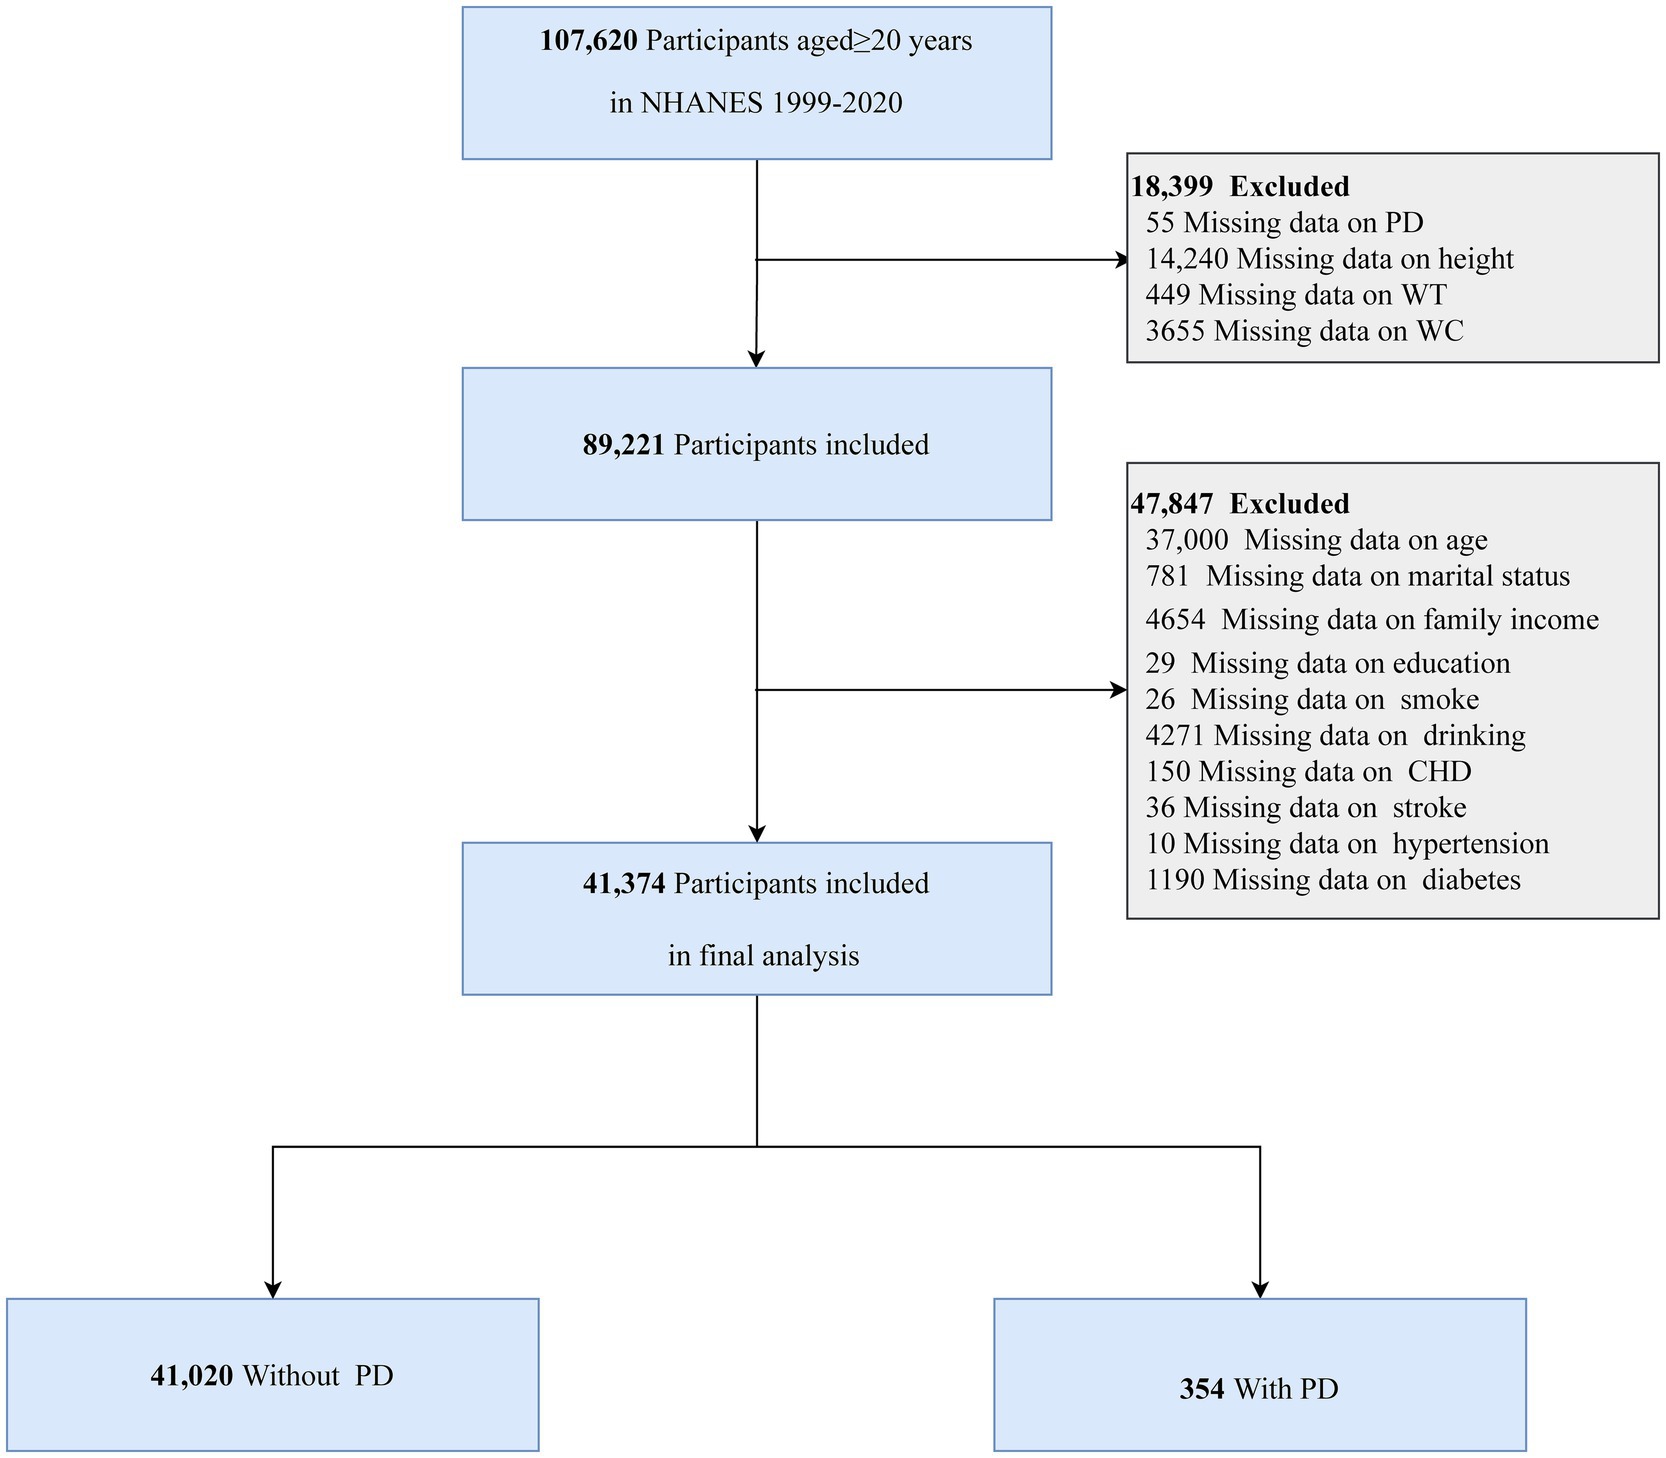
Figure 1. Flowchart of participants in this study.
2.4 Anthropometric index calculation
Trained examiners measured key anthropometric parameters, including height, WC, and WT, using standardized protocols at MEC. WC was measured to the nearest millimeter at the end of normal exhalation while the participant stood upright with feet 25–30 cm apart. The following anthropometric indices were calculated using established formulas (28):
BMI = WT (kg)/height2 (m2)
ABSI = WC (cm)/[BMI2/3 (kg/m2) × height1/2 (m)]
BRI = 364.2–365.5 × {1 − [(WC (cm)/2π)/(0.5 × height (m))]2}0.5
CI = WC (m)/0.109/[WT (kg)/height (cm)]0.5
WWI = WC (cm)/WT0.5 (cm/kg0.5)
WHtR = WC (cm)/height (cm)
2.5 Assessment of PD
PD was identified based on self-reported prescription medication records in NHANES, specifically under the category “Anti-Parkinson Agents.” Only participants actively receiving antiparkinsonian medications were classified as having PD, whereas those without relevant prescriptions were categorized as non-PD. This definition is consistent with the previously established definitions in the literature (29–31).
2.6 Assessment of covariates
Potential confounders were selected based on prior literature and clinical relevance (31–33). These variables were categorized into four main domains: demographic, socioeconomic, lifestyle, and medical history. Details of the specific covariates and their classification criteria are summarized in Supplementary Table 1.
Briefly, demographic variables included age, sex, and race/ethnicity. Socioeconomic factors comprised marital status, poverty-income ratio (PIR), and educational attainment. Lifestyle variables included smoking status (31), alcohol consumption, and physical activity measured in metabolic equivalent of task (MET)-minutes [PA(MET-min/wk)] per week based on previously defined activity levels (34, 35). Medical history included physician-diagnosed coronary heart disease (CHD), stroke, hypertension, hyperlipidemia, and diabetes (all classified as yes/no). Hypertension, hyperlipidemia, and diabetes were defined using standard clinical and laboratory criteria.
2.7 Statistical analyses
Following the NHANES analytical guidelines, survey design variables and appropriate sampling weights were applied to ensure nationally representative estimates. Sampling weights were calculated as follows: 1999–2002: 2/10.6 × 4-year MEC weight, 2003–2016: 1/10.6 × 2-year MEC weight, and 2017–2020: 1.6/10.6 × PRP MEC weight.
The baseline characteristics are presented in Table 1, with continuous variables with a normal distribution reported as mean [standard deviation (SD)] whereas, non-normally distributed variables are presented as medians with interquartile ranges (IQR). Categorical variables were expressed as unweighted numbers (weighted percentages). The Kolmogorov–Smirnov test was applied to assess the normality of the distributions. Group comparisons were performed using the chi-square test for categorical variables, independent sample t-tests for normally distributed continuous variables, and the Mann–Whitney U test for non-normally distributed continuous variables. Given the large sample size, missing data were handled by excluding incomplete records from the analysis. In this study, all anthropometric variables underwent z-score transformation using the formula: z-score = (index-indexmean)/indexsd (Supplementary Table 2).
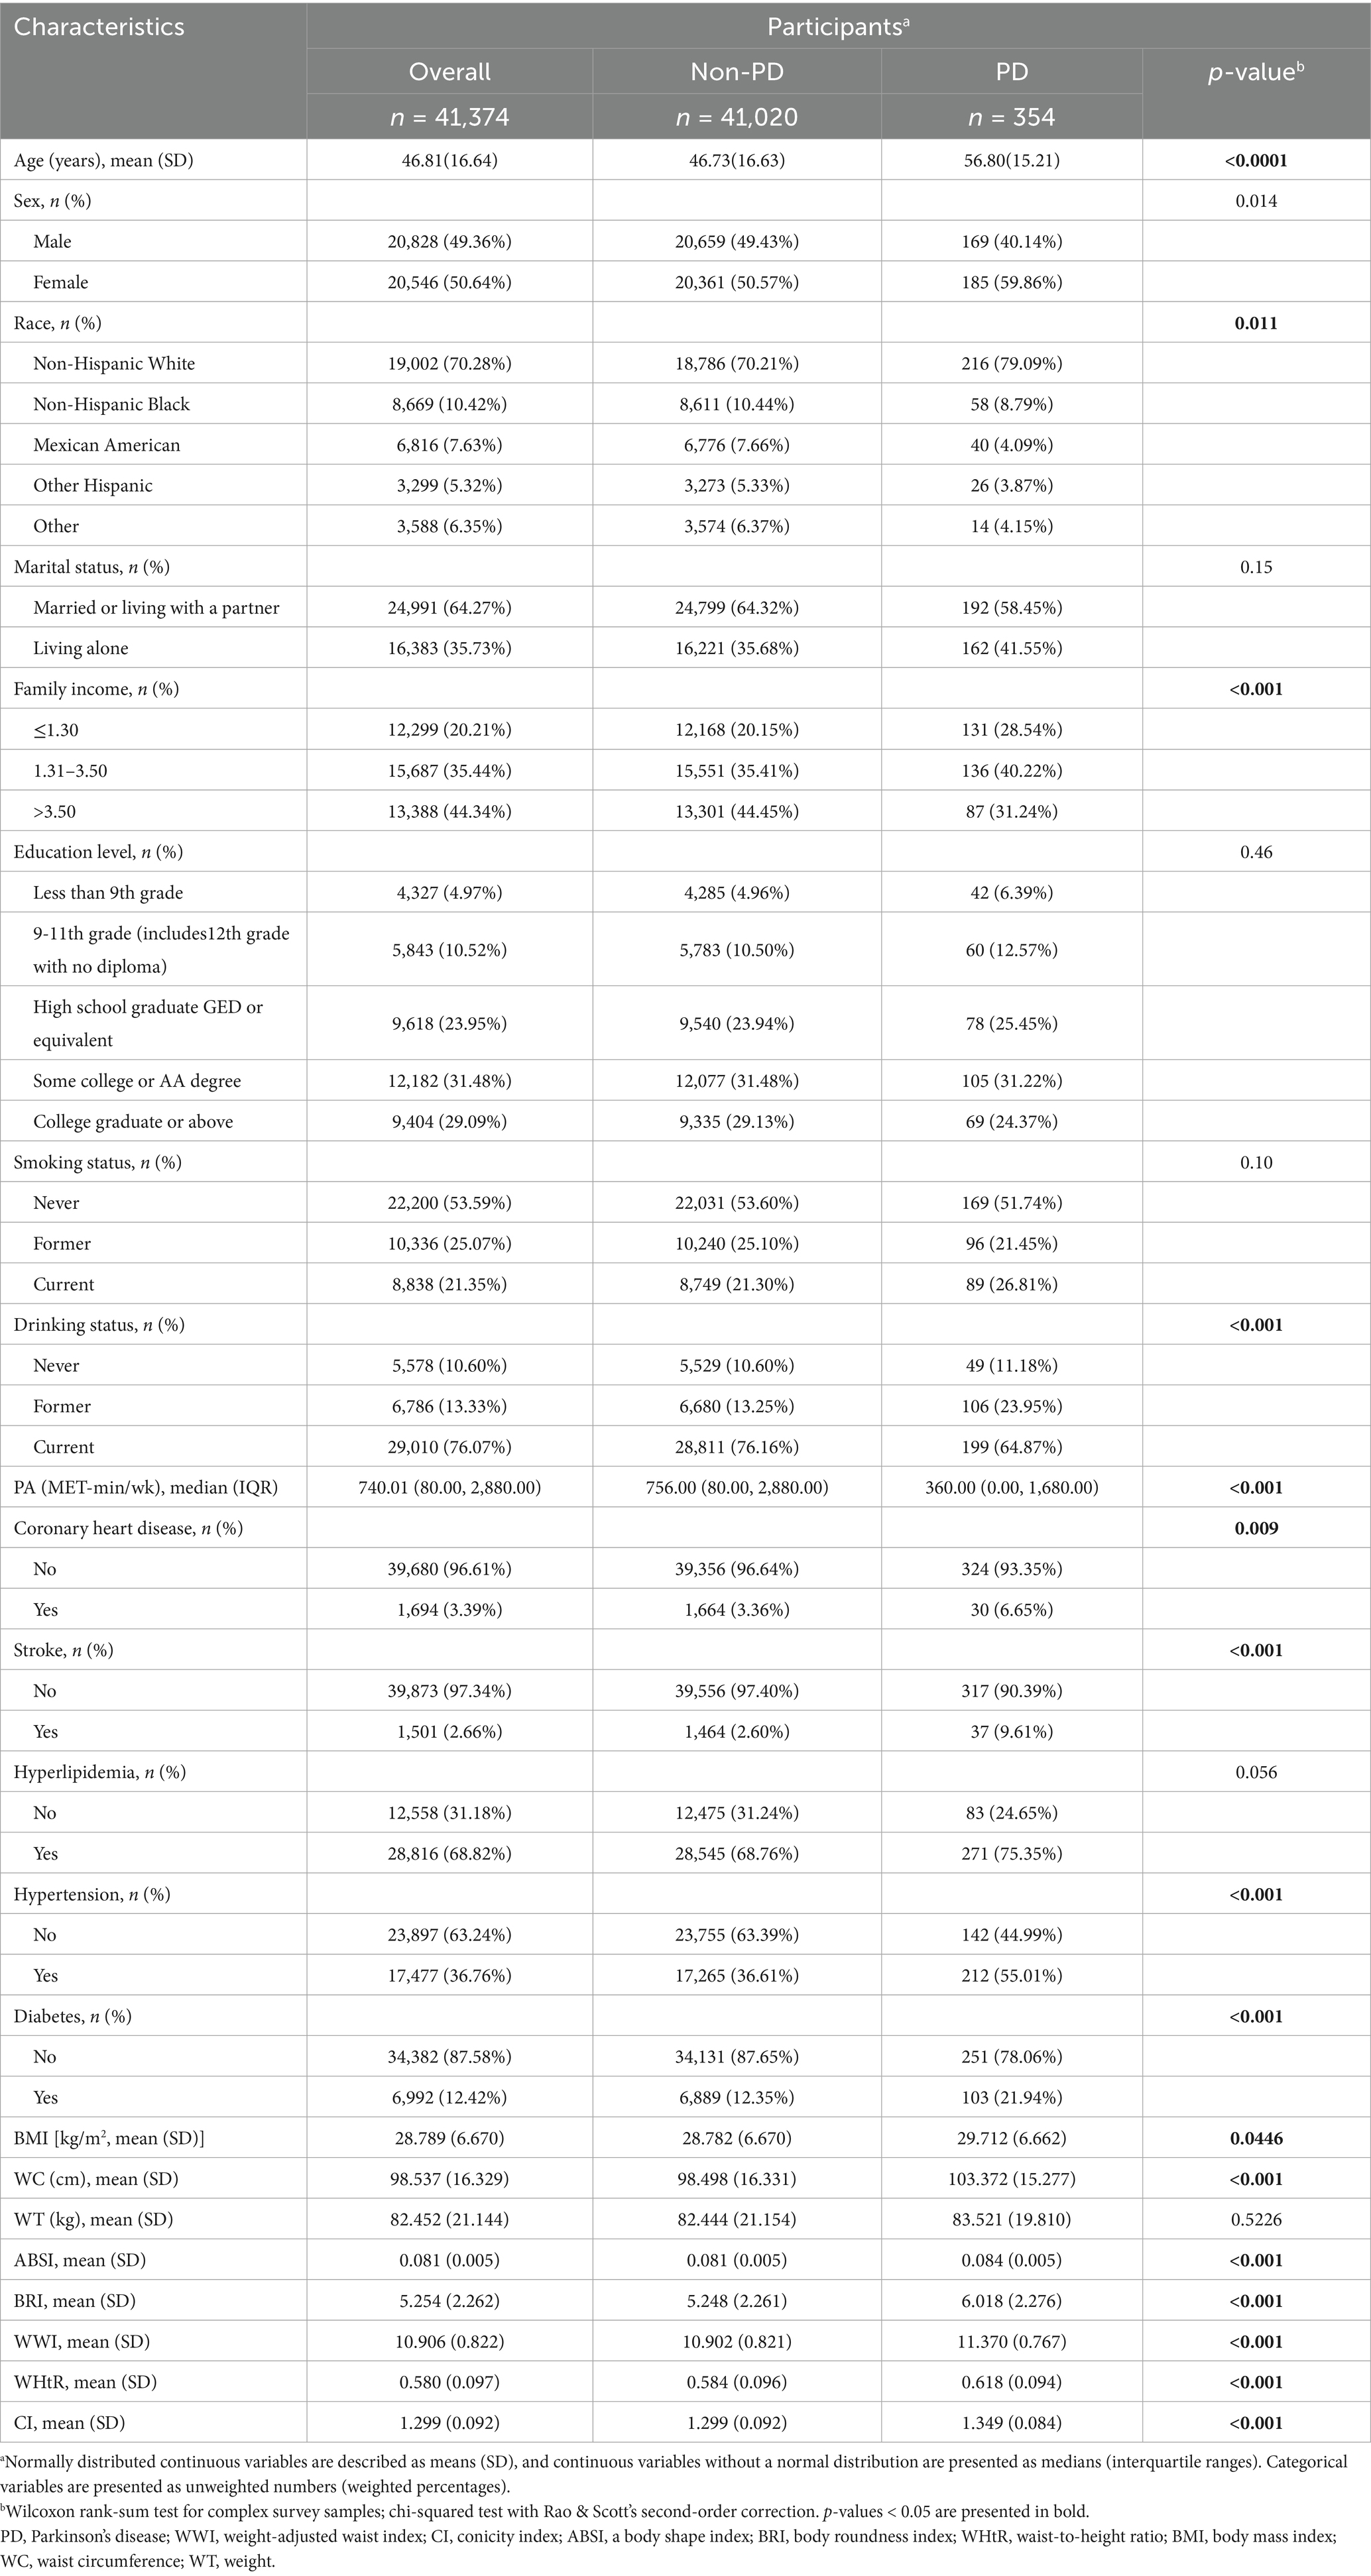
Table 1. Baseline characteristics of participants, weighted.
To explore the associations between anthropometric indices and PD risk, weighted multivariable logistic regression models were constructed to estimate odds ratios (ORs) and 95% confidence intervals (CIs). The models were adjusted as follows: Model 1: unadjusted; Model 2: adjusted for age, sex, and race/ethnicity; Model 3: further adjusted for marital status, family income, educational level, smoking status, alcohol consumption, physical activity, CHD, stroke, hypertension, diabetes, and hyperlipidemia.
A weighted restricted cubic spline (RCS) model with three knots was used to assess the potential dose–response relationships. Additionally, smoothed curve fitting was applied to evaluate the linearity of the associations.
Subgroup analyses and interaction tests were conducted to determine whether associations varied across key demographic and clinical subgroups, including age (<60 vs. ≥60 years), sex (male vs. female), race (non-Hispanic White vs. other), marital status (married/living with a partner vs. living alone), and the presence of hypertension (no vs. yes), diabetes (no vs. yes), and hyperlipidemia (no vs. yes). To ensure robustness, sensitivity analyses were performed by categorizing anthropometric indices into quartiles.
All statistical analyses were performed using R 4.2.2 (http://www.Rproject.org; The R Foundation, Vienna, Austria) and Free Statistics software (version 2.1; Beijing Free Clinical Medical Technology Co., Ltd., Beijing, China). A two-sided p-value <0.05 was considered statistically significant. Data analyses were conducted between December 2024 and March 2025.
3 Results
3.1 Study population
The NHANES survey, conducted from 1999 to 2020, initially included 107,620 individuals aged 20 years or older. A total of 66,246 participants were excluded based on the following criteria: 55 due to missing PD data, 14,240 due to incomplete height measurements, 449 due to missing WT data, 3,655 due to unavailable WC measurements, and 47,847 due to incomplete covariate data. Thus, the final analysis included 41,374 participants (Figure 1).
3.2 Baseline characteristics
Table 1 presents the baseline characteristics of participants with complete data on PD and anthropometric indices. Among the 41,374 individuals analyzed, 354 (0.86%) had PD. Compared to individuals without PD, participants with PD had significantly higher values for most anthropometric indices. Additionally, the PD group demonstrated a significantly lower prevalence of alcohol consumption and regular physical activity than the non-PD group (p < 0.05). Moreover, the PD group had a higher mean age at disease onset and a greater proportion of females. Individuals with PD are also more likely to live alone and report their current smoking status. Notably, the prevalence of comorbid conditions, such as CHD, hypertension, stroke, hyperlipidemia, and diabetes, was significantly higher in the PD group compared to the non-PD group.
3.3 Associations between eight anthropometric measures and PD
Most anthropometric indices were positively correlated with the prevalence of PD (Table 2). In the unadjusted model (Model 1), WWI showed the strongest association per 1-SD increment (OR: 1.76; 95% CI: 1.56–1.99; p < 0.001).
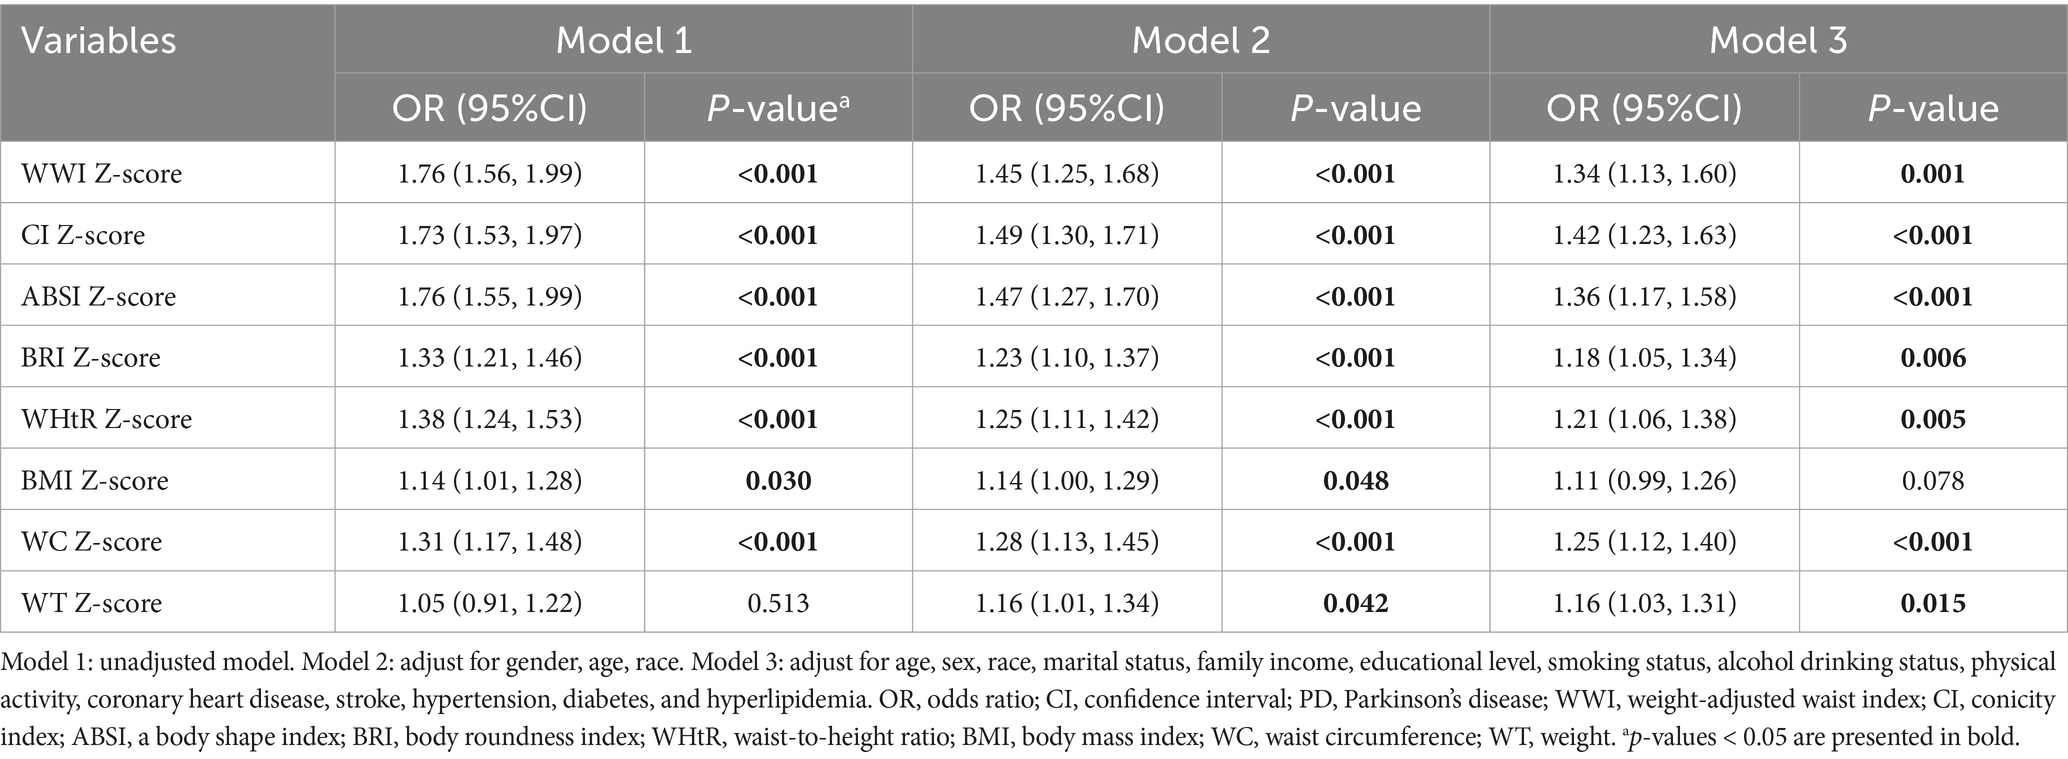
Table 2. Weighted logistic regression analysis of anthropometric indices and PD.
After adjusting for potential confounders, including age, sex, race, marital status, income, education, smoking, alcohol consumption, physical activity, and comorbidities, the associations remained significant for seven anthropometric indices in Model 3: WWI (OR: 1.34; 95% CI: 1.13–1.60; p < 0.001), CI (OR: 1.42; 95% CI: 1.23–1.63; p < 0.001), ABSI (OR: 1.36; 95% CI: 1.17–1.58; p < 0.001), BRI (OR: 1.18; 95% CI: 1.05–1.34; p = 0.006), WHtR (OR: 1.21; 95% CI: 1.06–1.38; p = 0.005), WC (OR: 1.25; 95% CI: 1.12–1.40; p < 0.001), and WT (OR: 1.16; 95% CI: 1.03–1.31; p = 0.015).
Compared to other anthropometric indices, BMI exhibited only a weak association with PD in the unadjusted model and Model 2, and this association became non-significant after full adjustment in Model 3.
3.4 Dose–response relationships based on RCS
An additive generalized model and smoothed curve fitting were applied to examine the relationship between PD prevalence and anthropometric indicators (Figure 2). The analysis revealed a nonlinear association between WWI and PD prevalence (P for nonlinearity = 0.01, Figure 2A), with an inflection point identified at 11.46 cm/√kg (Table 3). In contrast, CI, ABSI, BRI, WHtR, BMI, WC, and WT exhibited a positive linear association with the prevalence of PD (P for nonlinearity > 0.05, Figures 2B–H).
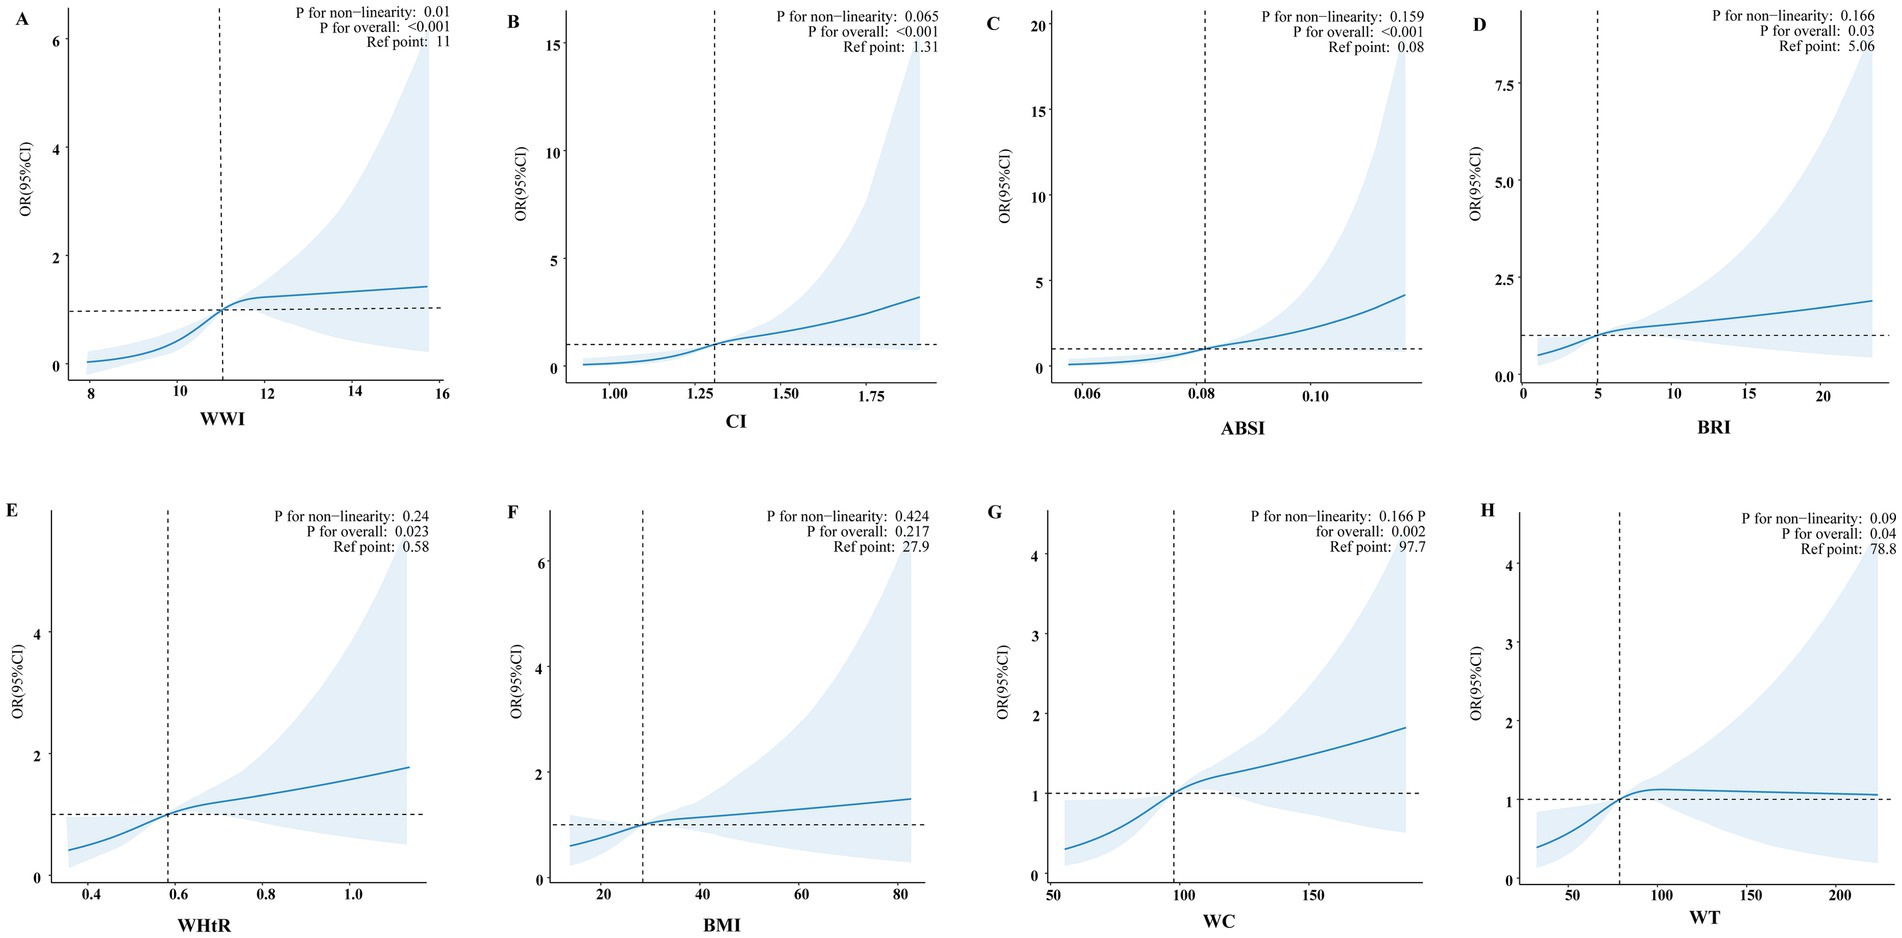
Figure 2. Smooth curve fitting models evaluated the correlation between eight anthropometric indices and PD. Adjusted smooth curve fitting models adjusted for age, sex, race, marital status, family income, educational level, smoking status, alcohol drinking status, physical activity, coronary heart disease, stroke, hypertension, diabetes, and hyperlipidemia. The blue line illustrates the smoothed curve that fits the data points, while the light blue shaded areas indicate the 95% CI around the fit. (A) Smooth curve fitting model of WWI. (B) Smooth curve fitting model of CI. (C) Smooth curve fitting model of ABSI. (D) Smooth curve fitting model of BRI. (E) Smooth curve fitting model of WHtR. (F) Smooth curve fitting model of BMI. (G) Smooth curve fitting model of WC. (H) Smooth curve fitting model of WT.
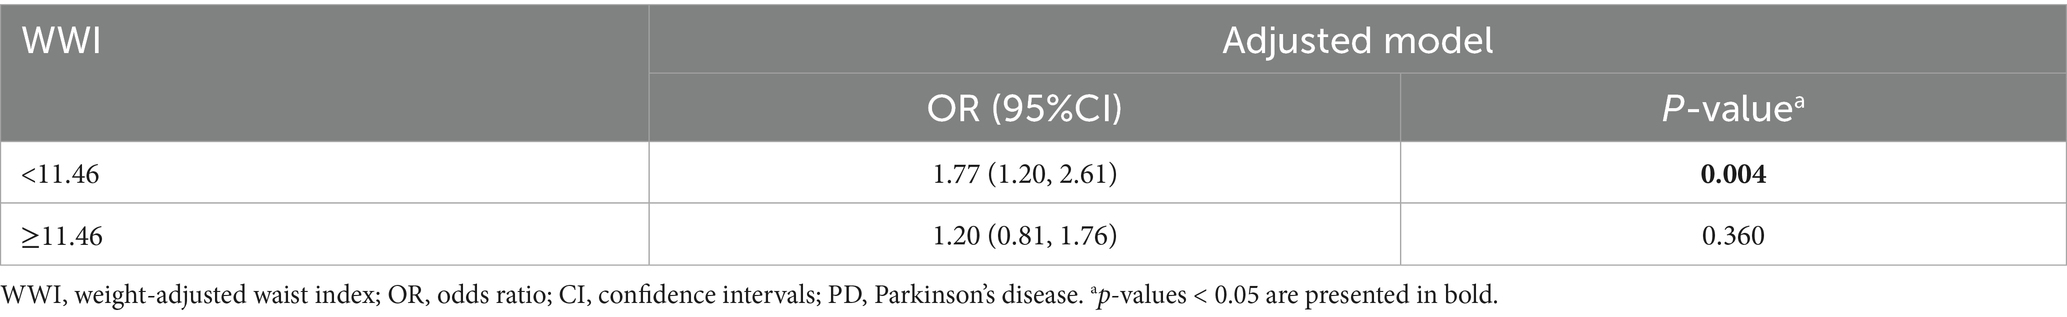
Table 3. Threshold effect analysis of the relationship of WWI with PD.
3.5 Subgroup analyses
Subgroup analyses showed consistent positive associations between several anthropometric indices and PD prevalence. The association between CI and PD is presented in the main manuscript (Figure 3). Additional associations for WWI and ABSI are detailed in Supplementary Figure 1, for BRI and WHtR in Supplementary Figure 2, and for WC and WT in Supplementary Figure 3. Across all stratified analyses (by age, sex, race, marital status, and comorbidities), no significant interaction effects were observed.
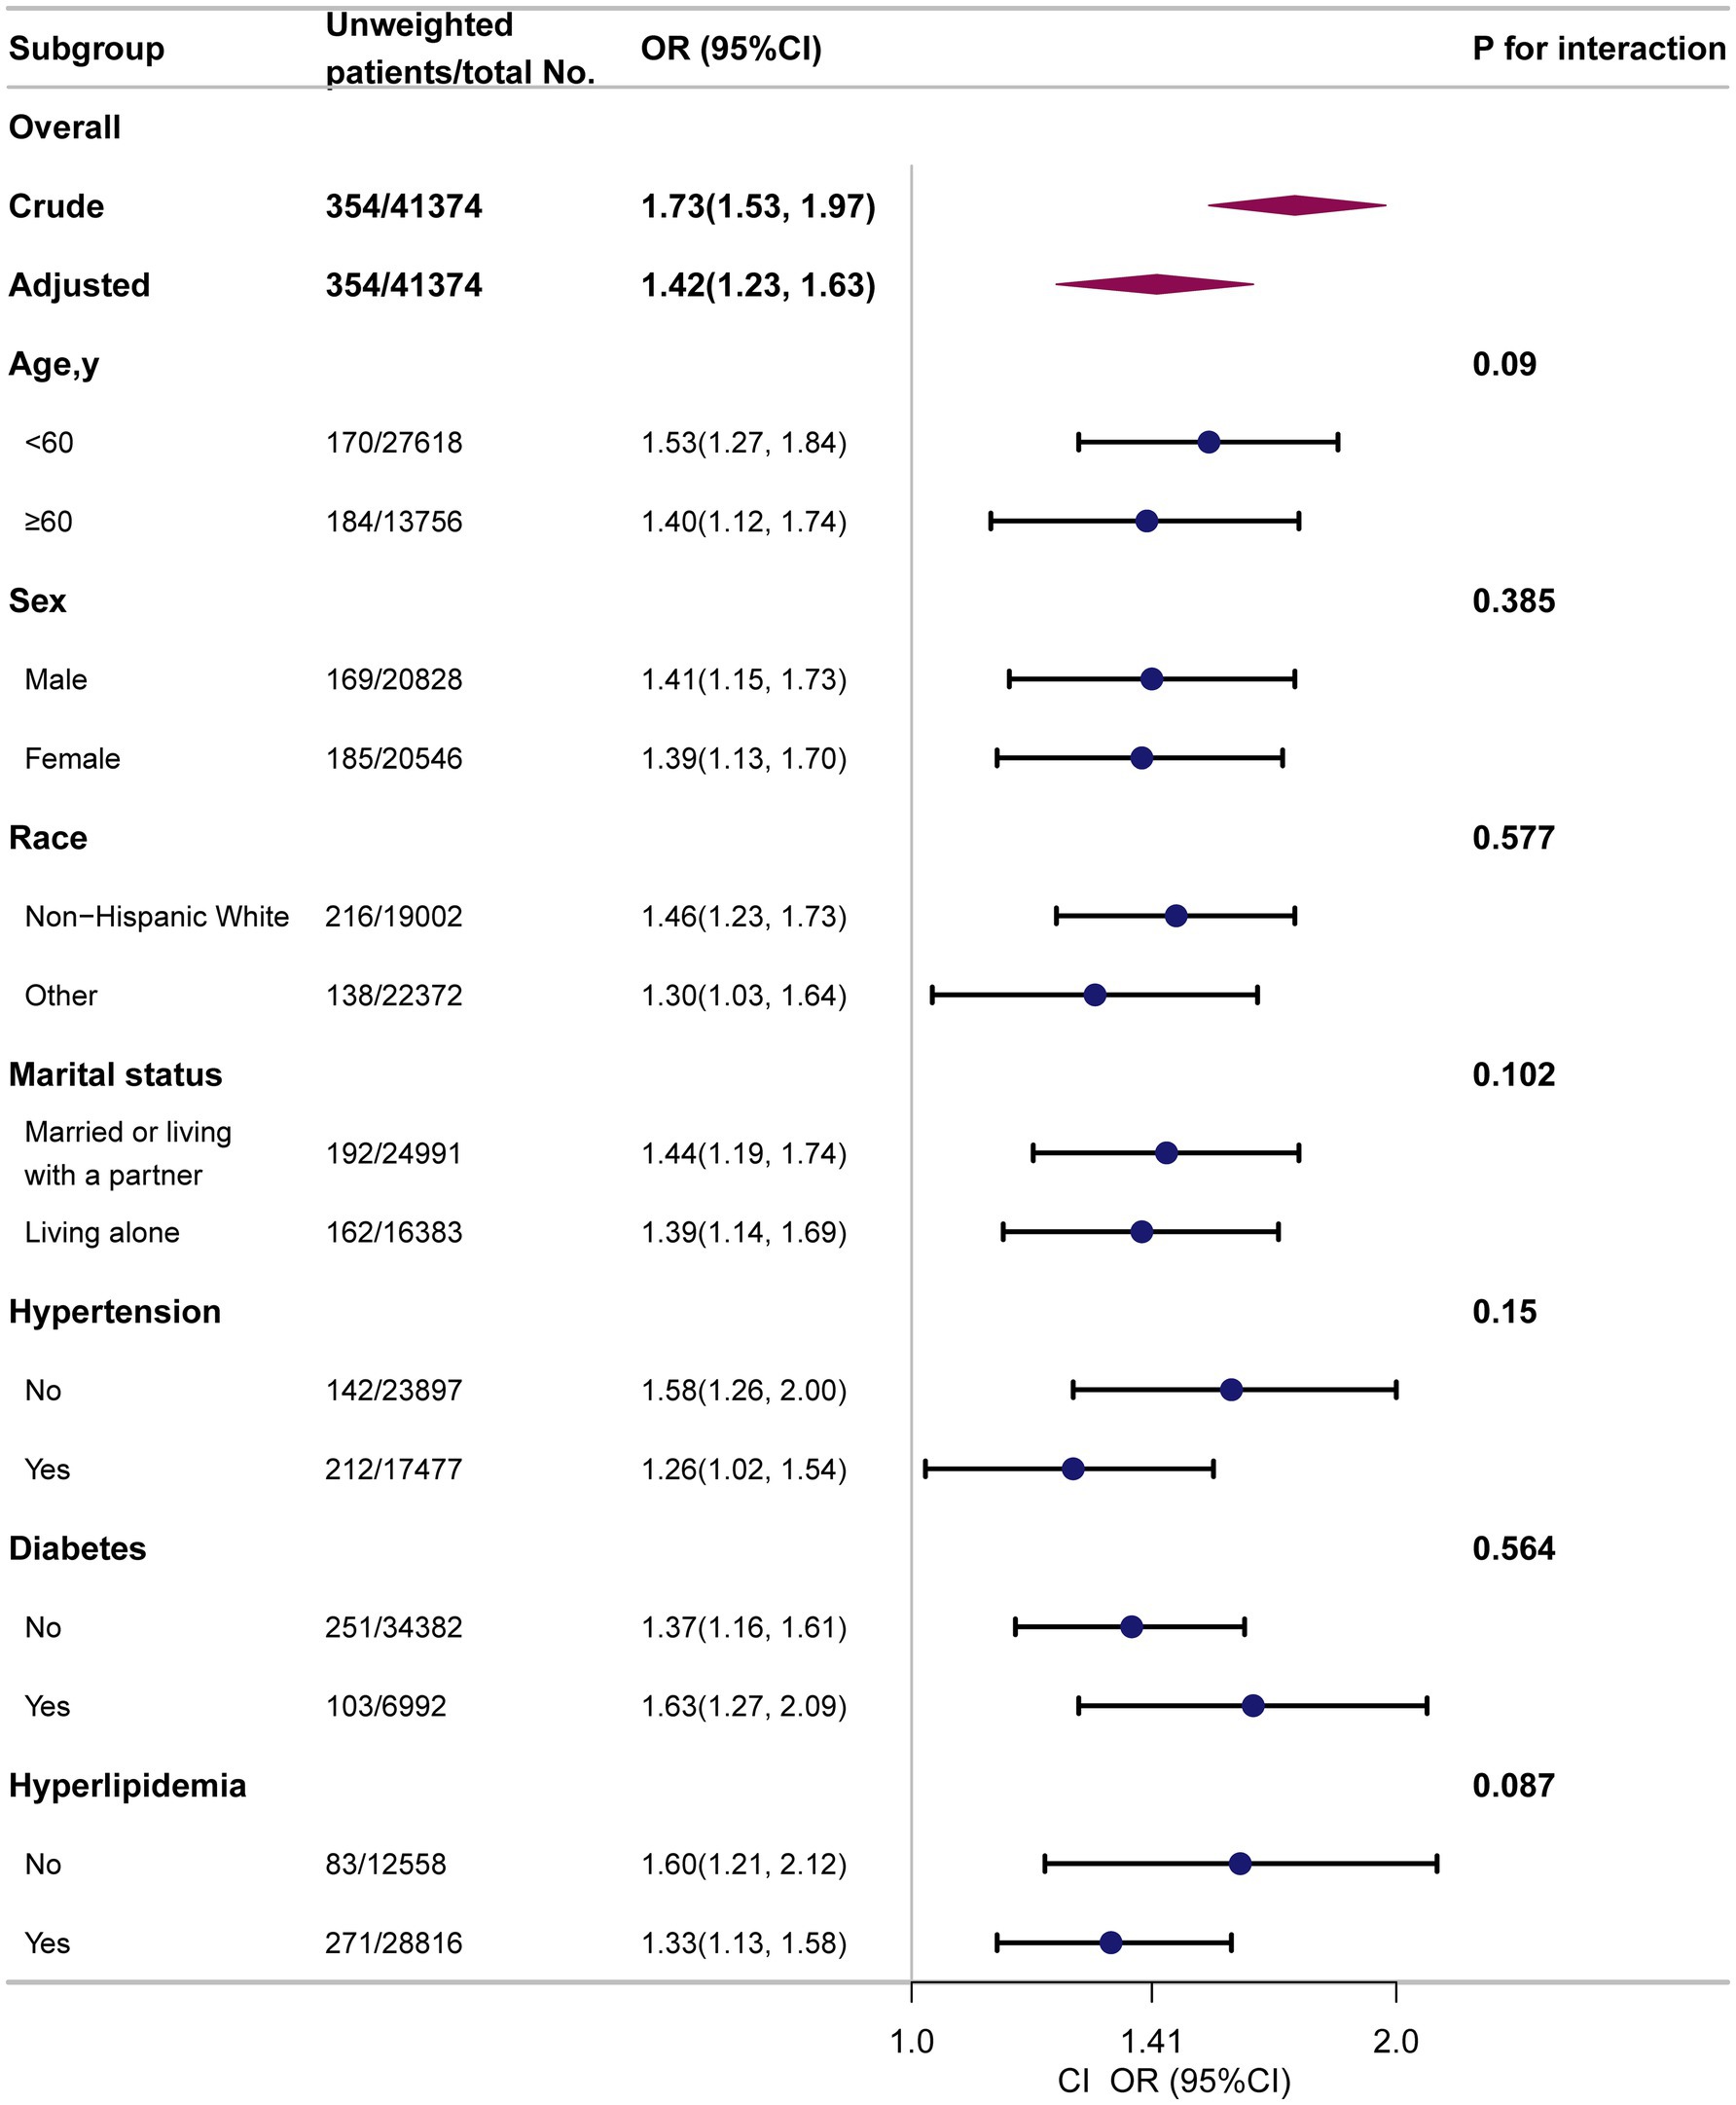
Figure 3. Subgroup analyses to determine the correlation of CI and PD. Except for the stratification factor itself, the stratifications were adjusted for all variables (age, sex, race, marital status, family income, educational level, smoking status, alcohol drinking status, physical activity, coronary heart disease, stroke, hypertension, diabetes, hyperlipidemia).
3.6 Sensitivity analysis
To further assess the robustness of our findings, the anthropometric indices were categorized into quartiles. Participants in the highest quartile of WWI, CI, ABSI, BRI, WHtR, WC, and WT exhibited a significantly higher risk of PD compared to those in the lowest quartile: WWI (OR: 3.22; 95% CI: 1.77–5.85; p < 0.001), CI (OR: 2.74; 95% CI: 1.67–4.49; p < 0.001), ABSI (OR: 2.61; 95% CI: 1.53–4.43; p < 0.001), BRI (OR: 1.74; 95% CI: 1.05–2.88; p = 0.031), WHtR (OR: 1.74; 95% CI: 1.05–2.88; p = 0.031), WC (OR: 2.10; 95% CI: 1.31–3.37; p = 0.002), and WT (OR: 1.74; 95% CI: 1.14–2.66; p = 0.011) (Supplementary Table 3).
When BMI was analyzed as a categorical variable, no significant association with PD was observed across all models.
These findings reinforce the robustness of the observed associations and demonstrate that the associations between central obesity-related indices and PD remain consistent across different statistical modeling approaches.
4 Discussion
In this nationally representative study, seven of the eight anthropometric indices examined were significantly associated with a higher prevalence of PD, with BMI being the only index that did not demonstrate a significant association. These findings highlight the relevance of fat distribution rather than general adiposity in PD pathogenesis. Traditional measures, such as BMI, may underestimate neurodegenerative risk by failing to capture visceral fat accumulation, which is more closely linked to metabolic dysfunction and inflammation (36–39).
Although WC and WHtR are widely accepted indicators of central obesity, other indices evaluated in this study, including WWI, CI, ABSI, and BRI, also reflect central fat deposition. Prior research has established strong correlations between these alternative indices, visceral adiposity and both metabolic and neurological health (37, 40–43). Unlike BMI, these indices account for variations in body composition and fat distribution and have demonstrated superior predictive value in identifying individuals with central obesity. Therefore, the consistent associations observed across these measures provide further support for a shared pathophysiological mechanism linking central obesity and PD.
Our findings align with those of several previous studies that have reported a positive association between abdominal adiposity and PD risk. For instance, a large-scale cohort study in Asia involving 6.9 million individuals with an 8.35-year follow-up reported a significant association between higher WC and increased PD risk (OR = 1.09; 95% CI: 1.07–1.12; p < 0.001) (43). Similarly, a meta-analysis conducted by Fang et al. suggested that being overweight may contribute to increased susceptibility to PD (44). Additionally, a recent NHANES-based study demonstrated that the ABSI was positively associated with PD prevalence, particularly in younger male adults (45). Collectively, these results support the hypothesis that central obesity is a critical component in neurodegenerative risk profiling.
However, our findings differ from those of several previous studies, which reported inverse associations between BMI and PD (11, 14, 15, 16). In our analysis, although BMI showed a weak association with PD in the unadjusted and partially adjusted models, this association became non-significant after full adjustment for demographic, lifestyle, and clinical factors. This attenuation may be attributed to several reasons. First, BMI lacks specificity in distinguishing fat mass from muscle mass and fails to capture fat distribution (42, 46). In contrast, indices such as WWI, CI, and WHtR are more sensitive to the visceral fat content, which is metabolically active and implicated in neuroinflammation. Second, sample heterogeneity across the studies may contribute to the divergent outcomes. Our study included a racially and socioeconomically diverse cohort, whereas other investigations may have included more homogeneous groups. Third, survivorship bias in longitudinal cohorts may obscure the true associations, as individuals with higher BMI may die prematurely from cardiovascular diseases or diabetes before developing PD. Lastly, statistical power and variable-covariate adjustments across studies may influence the detection of associations. These factors underscore the importance of methodological rigor and index selection in studies examining adiposity and the risk of PD.
Several biological mechanisms may explain the observed associations. First, central obesity promotes systemic chronic inflammation. Adipose tissue in individuals with excess visceral fat produces proinflammatory cytokines, such as tumor necrosis factor-alpha (TNF-α), interleukin-6 (IL-6), and C-reactive protein (CRP). These mediators can impair the integrity of the blood–brain barrier (47–50), activate microglial cells, and promote neuroinflammation, which collectively may contribute to dopaminergic neuron degeneration in the substantia nigra, ultimately increasing PD risk (51, 52).
Second, central adiposity is closely linked to insulin resistance (IR), a metabolic state known to contribute to neurodegenerative processes. IR may lead to mitochondrial dysfunction, increase oxidative stress, and promote the aggregation of α-synuclein, a pathological hallmark of PD (51, 53–55). Moreover, IR can disrupt key intracellular signaling pathways, such as polo-like kinase 2 (PLK2), which are involved in neuronal survival and function. These alterations may accelerate the degeneration of dopaminergic neurons and exacerbate disease progression (36, 53, 56, 57). Given that central obesity is a well-established predictor of IR, it may serve as a key metabolic link between obesity and PD (58).
Third, obesity is associated with decreased levels of brain-derived neurotrophic factor (BDNF), a protein essential for neuronal development, plasticity, and survival (59, 60). Decreased levels of BDNF expression have been observed in individuals with obesity and may impair the maintenance and function of dopaminergic neurons. This deficiency in neurotrophic support further contributes to the pathology of PD (61, 62).
These biological mechanisms, including inflammation, IR, and impaired neurotrophic signaling, highlight the biological plausibility of the link between central obesity and PD. A simplified schematic is presented in Supplementary Figure 4, summarizing how central obesity may contribute to PD pathogenesis through three interconnected mechanisms.
From a clinical perspective, these findings have important clinical implications for the early detection and targeted prevention strategies. Alternative anthropometric indices could serve as practical tools for early identification of individuals at increased risk of PD, particularly in populations where BMI fails to reflect the true metabolic burden. These indices can be incorporated into routine screening protocols to inform the development of preventive strategies.
This study has several strengths. First, it was based on a large nationally representative sample, which enhanced the generalizability of the findings. Second, it incorporated standardized anthropometric measurements and employed rigorous statistical adjustments for a wide range of potential confounders. Third, the robustness of the associations was verified using subgroup and sensitivity analyses.
Despite these strengths, several limitations of this study must be acknowledged. As this was a cross-sectional study, causal relationships could not be established. To address this, future research should employ prospective cohort designs to clarify the temporal and potentially causal relationships between central obesity and PD. Second, consistent with previously published research (33, 63, 64), PD identification based on antiparkinsonian medication use may not distinguish PD from other forms of parkinsonism. This could lead to potential misclassification and underestimation of true PD prevalence, particularly among untreated individuals. Future studies should incorporate multiple diagnostic approaches, such as clinical interviews, neurological examinations, and biomarker assessments, to enhance classification accuracy. Additionally, the use of secondary data limited our ability to fully account for all confounding variables, thereby introducing the possibility of residual bias. Lastly, although the NHANES dataset is representative of the U.S. population, these findings may not be generalizable to other geographic or ethnic populations. Future validation studies in more diverse international populations are warranted to confirm and extend these results.
5 Conclusion
This study provided strong evidence that central obesity, as reflected by alternative anthropometric indices such as CI, WHtR, and WWI, is significantly associated with PD prevalence, whereas BMI is not. These results highlight the importance of using alternative anthropometric tools for identifying individuals at an elevated PD risk. Future longitudinal studies should explore whether interventions targeting central obesity reduce the incidence and progression of PD.
Data availability statement
The datasets presented in this study can be found in online repositories. The names of the repository/repositories and accession number(s) can be found at: https://www.cdc.gov/nchs/nhanes/index.html.
Ethics statement
The studies involving humans were approved by the National Center for Health Statistics (NCHS) Review Board. The studies were conducted in accordance with the local legislation and institutional requirements. The participants provided their written informed consent to participate in this study.
Author contributions
WH: Conceptualization, Data curation, Formal analysis, Funding acquisition, Methodology, Software, Validation, Writing – original draft, Writing – review & editing, Project administration. YZ: Data curation, Formal analysis, Methodology, Software, Validation, Writing – original draft. HL: Conceptualization, Data curation, Formal analysis, Investigation, Methodology, Software, Supervision, Validation, Writing – original draft, Writing – review & editing.
Funding
The author(s) declare that no financial support was received for the research and/or publication of this article.
Acknowledgments
The authors sincerely appreciate the NHANES team, researchers, and contributors. Our particular gratitude is reserved for Dr. Jie Liu of the Department of Vascular and Endovascular Surgery at the Chinese (PLA) Hospital. His expertise was pivotal in shaping the study’s design, providing statistical guidance, and offering profound insights that greatly enriched the manuscript.
Conflict of interest
The authors declare that the research was conducted in the absence of any commercial or financial relationships that could be construed as a potential conflict of interest.
Generative AI statement
The author(s) declare that no Gen AI was used in the creation of this manuscript.
Publisher’s note
All claims expressed in this article are solely those of the authors and do not necessarily represent those of their affiliated organizations, or those of the publisher, the editors and the reviewers. Any product that may be evaluated in this article, or claim that may be made by its manufacturer, is not guaranteed or endorsed by the publisher.
Supplementary material
The Supplementary material for this article can be found online at: https://www.frontiersin.org/articles/10.3389/fnut.2025.1621658/full#supplementary-material
Footnotes
References
1. Postuma, RB, Berg, D, Stern, M, Poewe, W, Olanow, CW, Oertel, W, et al. MDS clinical diagnostic criteria for Parkinson’s disease. Mov Disord. (2015) 30:1591–601. doi: 10.1002/mds.26424
2. Luo, Y, Qiao, L, Li, M, Wen, X, Zhang, W, and Li, X. Global, regional, national epidemiology and trends of Parkinson’s disease from 1990 to 2021: findings from the global burden of disease study 2021. Front Aging Neurosci. (2025) 16:1498756. doi: 10.3389/fnagi.2024.1498756/full
3. Tanner, CM, and Ostrem, JL. Parkinson’s disease. N Engl J Med. (2024) 391:442–52. doi: 10.1056/NEJMra2401857
4. Yang, W, Hamilton, JL, Kopil, C, Beck, JC, Tanner, CM, Albin, RL, et al. Current and projected future economic burden of parkinson’s disease in the U.S. NPJ Parkinson’s Dis. (2020) 6:15. doi: 10.1038/s41531-020-0117-1
5. Parkinson disease: a public health approach. Technical brief. 1st ed. Geneva: World Health Organization (2022). 1 p.
6. Our World in Data. Parkinson’s disease prevalence. Available online at: https://ourworldindata.org/grapher/parkinsons-disease-prevalence-ihme (Accessed Jun 3, 2025)
7. Bloem, BR, Okun, MS, and Klein, C. Parkinson’s disease. Lancet. (2021) 397:2284–303. doi: 10.1016/S0140-6736(21)00218-X
8. Jeon, J, Cha, Y, Hong, YJ, Lee, IH, Jang, H, Ko, S, et al. Pre-clinical safety and efficacy of human induced pluripotent stem cell-derived products for autologous cell therapy in Parkinson’s disease. Cell Stem Cell. (2025) 32:343–360.e7. doi: 10.1016/j.stem.2025.01.006
9. Heinzel, S, Berg, D, Gasser, T, Chen, H, Yao, C, and Postuma, RB. Update of the MDS research criteria for prodromal Parkinson’s disease. Mov Disord. (2019) 34:1464–70. doi: 10.1002/mds.27802
10. Martin-Jiménez, CA, Gaitán-Vaca, DM, Echeverria, V, González, J, and Barreto, GE. Relationship between obesity, Alzheimer’s disease, and Parkinson’s disease: an astrocentric view. Mol Neurobiol. (2017) 54:7096–115. doi: 10.1007/s12035-016-0193-8
11. Jeong, SM, Han, K, Kim, D, Rhee, SY, Jang, W, and Shin, DW. Body mass index, diabetes, and the risk of Parkinson’s disease. Mov Disord. (2020) 35:236–44. doi: 10.1002/mds.27922
12. Ragonese, P, D’Amelio, M, Callari, G, Di Benedetto, N, Palmeri, B, Mazzola, MA, et al. Body mass index does not change before Parkinson’s disease onset. Europ J Neurol. (2008) 15:965–8. doi: 10.1111/j.1468-1331.2008.02236.x
13. Logroscino, G, Sesso, HD, Paffenbarger, RS, and Lee, IM. Body mass index and risk of Parkinson’s disease: a prospective cohort study. Am J Epidemiol. (2007) 166:1186–90. doi: 10.1093/aje/kwm211
14. Wang, YL, Wang, YT, Li, JF, Zhang, YZ, Yin, HL, and Han, B. Body mass index and risk of Parkinson’s disease: a dose-response meta-analysis of prospective studies. PLoS One. (2015) 10:e0131778. doi: 10.1371/journal.pone.0131778
15. Rahmani, J, Roudsari, AH, Bawadi, H, Clark, C, Ryan, PM, Salehisahlabadi, A, et al. Body mass index and risk of Parkinson, Alzheimer, dementia, and dementia mortality: a systematic review and dose–response meta-analysis of cohort studies among 5 million participants. Nutr Neurosci. 25:423–31. doi: 10.1080/1028415X.2020.1758888
16. O’Shea, S, Liu, Y, Liu, C, Frank, SA, Shih, LC, and Au, R. Obesity and the development of Parkinson’s disease within the Framingham heart study cohort. Clin Park Relat Disord. (2024) 12:100291. doi: 10.1016/j.prdoa.2024.100291
17. Antonopoulos, AS, Oikonomou, EK, Antoniades, C, and Tousoulis, D. From the BMI paradox to the obesity paradox: the obesity–mortality association in coronary heart disease. Obes Rev. (2016) 17:989–1000. doi: 10.1111/obr.12440
18. Chen, Z, Cheang, I, Zhu, X, Qu, Q, Chen, S, Xing, Y, et al. Associations of body roundness index with cardiovascular disease and mortality among patients with metabolic syndrome. Diabetes Obes Metab. 27:3285–98. doi: 10.1111/dom.16346
19. Thomas, DM, Bredlau, C, Bosy-Westphal, A, Mueller, M, Shen, W, Gallagher, D, et al. Relationships between body roundness with body fat and visceral adipose tissue emerging from a new geometrical model. Obesity. 21:2264–71. doi: 10.1002/oby.20408
20. Mansour, A, Pourhassan, S, Gerami, H, Mohajeri-Tehrani, MR, Salahshour, M, Abbasi, A, et al. Regional fat distribution and hepatic fibrosis and steatosis severity in patients with nonalcoholic fatty liver disease and type 2 diabetes. Obes Sci Pract. (2024) 10:e777. doi: 10.1002/osp4.777
21. Lin, R, Tao, Y, Li, C, Li, F, Li, Z, Hong, X, et al. Central obesity may affect bone development in adolescents: association between abdominal obesity index ABSI and adolescent bone mineral density. BMC Endocr Disord. (2024) 24:81. doi: 10.1186/s12902-024-01600-w
22. Dai, X, Chang, Y, and Hou, Y. Associations between the conicity index and kidney stone disease prevalence and mortality in American adults. Sci Rep. (2025) 15:902. doi: 10.1038/s41598-025-85292-9
23. Martone, AM, Levati, E, Ciciariello, F, Galluzzo, V, Salini, S, Calvani, R, et al. Impact of waist-to-hip and waist-to-height ratios on physical performance: insights from the longevity check-up 8+ project. Aging (Milano). (2025) 17. doi: 10.18632/aging.206260
24. Kim, KJ, Son, S, Kim, KJ, Kim, SG, and Kim, NH. Weight-adjusted waist as an integrated index for fat, muscle and bone health in adults. J Cachexia Sarcopenia Muscle. (2023) 14:2196. doi: 10.1002/jcsm.13302
25. Guo, X, Ding, Q, and Liang, M. Evaluation of eight anthropometric indices for identification of metabolic syndrome in adults with diabetes. Diab Metab Syndr Obes Targets Ther. (2021) 14:1431–43. doi: 10.2147/DMSO.S294244
26. Motamed, N, Perumal, D, Zamani, F, Ashrafi, H, Haghjoo, M, Saeedian, FS, et al. Conicity index and waist-to-hip ratio are superior obesity indices in predicting 10-year cardiovascular risk among men and women. Clin Cardiol. (2015) 38:527–34. doi: 10.1002/clc.22437
27. González-Gil, EM, Peruchet-Noray, L, Sedlmeier, AM, Christakoudi, S, Biessy, C, Navionis, AS, et al. Association of body shape phenotypes and body fat distribution indexes with inflammatory biomarkers in the European prospective investigation into cancer and nutrition (EPIC) and UK biobank. BMC Med. (2024) 22:334. doi: 10.1186/s12916-024-03544-3
28. Zhang, J, Liang, D, Xu, L, Liu, Y, Jiang, S, Han, X, et al. Associations between novel anthropometric indices and the prevalence of gallstones among 6,848 adults: a cross-sectional study. Front Nutr. (2024) 11:1428488. doi: 10.3389/fnut.2024.1428488
29. Ke, L, Zhao, L, Xing, W, and Tang, Q. Association between Parkinson’s disease and cardiovascular disease mortality: a prospective population-based study from NHANES. Lipids Health Dis. (2024) 23:212. doi: 10.1186/s12944-024-02200-2
30. Xu, S, Li, W, and Di, Q. Association of dietary patterns with Parkinson’s disease: a cross-sectional study based on the United States National Health and nutritional examination survey database. Eur Neurol. (2023) 86:63–72. doi: 10.1159/000527537
31. Zhang, L, Yang, S, Liu, X, Wang, C, Tan, G, Wang, X, et al. Association between dietary niacin intake and risk of parkinson’s disease in US adults: cross-sectional analysis of survey data from NHANES 2005-2018. Front Nutr. (2024) 11:1387802. doi: 10.3389/fnut.2024.1387802
32. Cheng, X, Wu, T, Han, L, Sun, T, and Huang, G. Association between added sugars intake and Parkinson’s disease status in U.S. adults: a cross-sectional study from NHANES 1990-2020. Arch Public Health. (2024) 82:225. doi: 10.1186/s13690-024-01445-8
33. Su, J, Liu, L, Wu, D, Wang, R, Wang, Z, Fan, E, et al. Association between serum total bilirubin with Parkinson’s disease among American adults (NHANES 1999 to 2018). Heliyon. (2024) 10:e36053. doi: 10.1016/j.heliyon.2024.e36053
34. Liang, J, Huang, S, Jiang, N, Kakaer, A, Chen, Y, Liu, M, et al. Association between joint physical activity and dietary quality and lower risk of depression symptoms in US adults: cross-sectional NHANES study. JMIR Public Health Surveill. (2023) 9:e45776. doi: 10.2196/45776
35. Chen, L, Cai, M, Li, H, Wang, X, Tian, F, Wu, Y, et al. Risk/benefit tradeoff of habitual physical activity and air pollution on chronic pulmonary obstructive disease: findings from a large prospective cohort study. BMC Med. (2022) 20:70. doi: 10.1186/s12916-022-02274-8
36. Després, JP, Lemieux, I, Bergeron, J, Pibarot, P, Mathieu, P, Larose, E, et al. Abdominal obesity and the metabolic syndrome: contribution to global cardiometabolic risk. Arterioscler Thromb Vasc Biol. (2008) 28:1039–49. doi: 10.1161/ATVBAHA.107.159228
37. Lin, WY. Associations of five obesity indicators with cognitive performance in 30,697 Taiwan biobank participants. BMC Geriatr. (2022) 22:839. doi: 10.1186/s12877-022-03457-x
38. Saltiel, AR, and Olefsky, JM. Inflammatory mechanisms linking obesity and metabolic disease. J Clin Invest. 127:1–4. doi: 10.1172/JCI92035
39. Wu, H, and Ballantyne, CM. Metabolic inflammation and insulin resistance in obesity. Circ Res. (2020) 126:1549–64. doi: 10.1161/CIRCRESAHA.119.315896
40. Ebrahimpour, S, Zakeri, M, and Esmaeili, A. Crosstalk between obesity, diabetes, and Alzheimer’s disease: introducing quercetin as an effective triple herbal medicine. Ageing Res Rev. (2020) 62:101095. doi: 10.1016/j.arr.2020.101095
41. Biolo, G, Girolamo, FGD, Breglia, A, Chiuc, M, Baglio, V, Vinci, P, et al. Inverse relationship between “a body shape index” (ABSI) and fat-free mass in women and men: insights into mechanisms of sarcopenic obesity. Clin Nutr. (2015) 34:323–7. doi: 10.1016/j.clnu.2014.03.015
42. Ahmed, KY, Mondal, UK, Huda, MM, Aychiluhm, SB, Newman, J, Thapa, S, et al. Normal-weight central obesity and cardiometabolic disorders among aboriginal and Torres Strait islander Australians. BMC Med. (2025) 23:106. doi: 10.1186/s12916-025-03942-1
43. Park, KY, Nam, GE, Han, K, Park, HK, and Hwang, HS. Waist circumference and risk of Parkinson’s disease. NPJ Parkinsons Dis. (2022) 8:89. doi: 10.1038/s41531-022-00353-4
44. Chen, J, Guan, Z, Wang, L, Song, G, Ma, B, and Wang, Y. Meta-analysis: overweight, obesity, and Parkinson′s disease. Int J Endocrinol. (2014) 2014:203930. doi: 10.1155/2014/203930
45. Huang, W, Xiao, Y, Zhang, L, and Liu, H. Association between a body shape index and Parkinson’s disease: a large cross-sectional study from NHANES. Heliyon. (2024) 10:e26557. doi: 10.1016/j.heliyon.2024.e26557
46. Schneider, HJ, Friedrich, N, Klotsche, J, Pieper, L, Nauck, M, John, U, et al. The predictive value of different measures of obesity for incident cardiovascular events and mortality. J Clin Endocrinol Metab. (2010) 95:1777–85. doi: 10.1210/jc.2009-1584
47. Williams-Gray, CH, Wijeyekoon, R, Yarnall, AJ, Lawson, RA, Breen, DP, Evans, JR, et al. Serum immune markers and disease progression in an incident Parkinson’s disease cohort (ICICLE-PD). Mov Disord. (2016) 31:995–1003. doi: 10.1002/mds.26563
48. Zhao, J, Wu, Z, Cai, F, Yu, X, and Song, Z. Higher systemic immune-inflammation index is associated with increased risk of Parkinson’s disease in adults: a nationwide population-based study. Front Aging Neurosci. (2025) 17:1529197. doi: 10.3389/fnagi.2025.1529197
49. Qu, Y, Li, J, Qin, Q, Wang, D, Zhao, J, An, K, et al. A systematic review and meta-analysis of inflammatory biomarkers in Parkinson’s disease. NPJ Parkinsons Dis. (2023) 9:1–14. doi: 10.1038/s41531-023-00449-5
50. Lumeng, CN, and Saltiel, AR. Inflammatory links between obesity and metabolic disease. J Clin Invest. (2011) 121:2111–7. doi: 10.1172/JCI57132
51. Insulin resistance and Parkinson’s disease: a new target for disease modification? Prog Neurobiol. (2016):145–6. doi: 10.1016/j.pneurobio.2016.10.001
52. Marzookian, K, Aliakbari, F, Hourfar, H, Sabouni, F, Otzen, DE, and Morshedi, D. The neuroprotective effect of human umbilical cord MSCs-derived secretome against α-synuclein aggregates on the blood-brain barrier. Int J Biol Macromol. (2025) 304:140387. doi: 10.1016/j.ijbiomac.2025.140387
53. Zagare, A, Hemedan, A, Almeida, C, Frangenberg, D, Gomez-Giro, G, Antony, P, et al. Insulin resistance is a modifying factor for Parkinson’s disease. Mov Disord. 40:67–76. doi: 10.1002/mds.30039
54. Hong, CT, Chen, KY, Wang, W, Chiu, JY, Wu, D, Chao, TY, et al. Insulin resistance promotes Parkinson’s disease through aberrant expression of α-synuclein, mitochondrial dysfunction, and deregulation of the polo-like kinase 2 signaling. Cells. (2020) 9:740. doi: 10.3390/cells9030740
55. Tan, S, Chi, H, Wang, P, Zhao, R, Zhang, Q, Gao, Z, et al. Protein tyrosine phosphatase receptor type O serves as a key regulator of insulin resistance-induced α-synuclein aggregation in Parkinson’s disease. Cell Mol Life Sci. (2024) 81:403. doi: 10.1007/s00018-024-05436-4
56. Hong, CT, Chen, JH, and Hu, CJ. Role of glucagon-like peptide-1 receptor agonists in Alzheimer’s disease and Parkinson’s disease. J Biomed Sci. (2024) 31:102. doi: 10.1186/s12929-024-01090-x
57. S Roriz-Filho, J, Sá-Roriz, TM, Rosset, I, Camozzato, AL, Santos, AC, MLF, C, et al. (Pre)diabetes, brain aging, and cognition. Biochim Biophys Acta. (2009) 1792:432–43. doi: 10.1016/j.bbadis.2008.12.003
58. Li, A, Liu, Y, Liu, Q, Peng, Y, Liang, Q, Tao, Y, et al. Waist-to-height ratio and body roundness index: superior predictors of insulin resistance in Chinese adults and take gender and age into consideration. Front Nutr. (2024) 11:1480707. doi: 10.3389/fnut.2024.1480707
59. Lommatzsch, M, Zingler, D, Schuhbaeck, K, Schloetcke, K, Zingler, C, Schuff-Werner, P, et al. The impact of age, weight and gender on BDNF levels in human platelets and plasma. Neurobiol Aging. (2005) 26:115–23. doi: 10.1016/j.neurobiolaging.2004.03.002
60. Karczewska-Kupczewska, M, Kowalska, I, Nikołajuk, A, Adamska, A, Zielińska, M, Kamińska, N, et al. Circulating brain-derived neurotrophic factor concentration is downregulated by intralipid/heparin infusion or high-fat meal in young healthy male subjects. Diabetes Care. (2012) 35:358–62. doi: 10.2337/dc11-1295
61. Howells, DW, Porritt, MJ, Wong, JYF, Batchelor, PE, Kalnins, R, Hughes, AJ, et al. Reduced BDNF mRNA expression in the parkinson’s disease substantia nigra. Exp Neurol. (2000) 166:127–35. doi: 10.1006/exnr.2000.7483
62. Levivier, M, Przedborski, S, Bencsics, C, and Kang, UJ. Intrastriatal implantation of fibroblasts genetically engineered to produce brain-derived neurotrophic factor prevents degeneration of dopaminergic neurons in a rat model of Parkinson’s disease. J Neurosci. (1995) 15:7810–20. doi: 10.1523/JNEUROSCI.15-12-07810.1995
63. Zeng, Z, Cen, Y, Wang, L, and Luo, X. Association between dietary inflammatory index and Parkinson’s disease from National Health and nutrition examination survey (2003–2018): a cross-sectional study. Front Neurosci. (2023) 17:1203979. doi: 10.3389/fnins.2023.1203979
64. Liu, Y, Zhou, X, Chen, C, Li, X, Pan, T, Liu, Z, et al. Association between osteoarthritis with Parkinson’s disease in the US (NHANES 2011–2020). Front Neurosci. (2024) 18:1393740. doi: 10.3389/fnins.2024.1393740
Glossary
NHANES - National Health and Nutrition Examination Survey
PD - Parkinson’s disease
WC - waist circumference
WT - weight
WWI - weight-adjusted waist index
CI - conicity index
ABSI - a body shape index
BRI - body roundness index
WHtR - waist-to-height ratio
BMI - body mass index
CDC - Centers for Disease Control and Prevention
MEC - mobile examination centers
STROBE - Strengthening the Reporting of Observational Studies in Epidemiology
NCHS - National Center for Health Statistics
MET - metabolic equivalent of task
CHD - coronary heart disease
IRB - Institutional Review Board
PIR - poverty income ratio
TG - triglycerides
LDL-C - low-density lipoprotein cholesterol
HDL-C - high-density lipoprotein cholesterol
SD - standard deviation
IQR - interquartile ranges
OR - odds ratio
CI - confidence interval
RCS - restricted cubic spline
TNF-α - tumor necrosis factor-alpha
IL-6 - interleukin-6
CRP - C-reactive protein
BBB - blood–brain barrier
PLK2 - Polo-Like Kinase 2
SNCA - α-synuclein
BDNF - brain-derived neurotrophic factor
Keywords: anthropometric indices, Parkinson’s disease, cross-sectional study, central obesity, NHANES
Citation: Hu W, Zhang Y and Liu H (2025) Associations between eight anthropometric indices and Parkinson’s disease: a nationwide population-based study. Front. Nutr. 12:1621658. doi: 10.3389/fnut.2025.1621658
Edited by:
Haibo Li, Fujian Medical University, ChinaReviewed by:
Khairiah Razali, International Islamic University Malaysia, MalaysiaLingaraj Anawal, BVVS Hanagal Shri Kumareshwar College of Pharmacy, India
Tian Cao, Harvard Medical School, United States
Paula García Milla, Universidad Autónoma de Chile, Chile
Copyright © 2025 Hu, Zhang and Liu. This is an open-access article distributed under the terms of the Creative Commons Attribution License (CC BY). The use, distribution or reproduction in other forums is permitted, provided the original author(s) and the copyright owner(s) are credited and that the original publication in this journal is cited, in accordance with accepted academic practice. No use, distribution or reproduction is permitted which does not comply with these terms.
*Correspondence: Huanxian Liu, aHVhbnhpYW5fbGl1QDEyNi5jb20=