 Irina V. Biktasheva
 Richard A. Anderson
 Arun V. Holden
 Eleftheria Pervolaraki
 Fen Cai Wen1
- 1Department of Computer Science, University of Liverpool, Liverpool, United Kingdom
- 2CEMPS, University of Exeter, Exeter, United Kingdom
- 3MRC Centre for Reproductive Health, University of Edinburgh, Edinburgh, United Kingdom
- 4School of Biomedical Sciences, University of Leeds, Leeds, United Kingdom
The effect of human fetal heart geometry and anisotropy on anatomy induced drift and self-termination of cardiac re-entry is studied here in MRI based 2D slice and 3D whole heart computer simulations. Isotropic and anisotropic models of 20 weeks of gestational age human fetal heart obtained from 100 μm voxel diffusion tensor MRI data sets were used in the computer simulations. The fiber orientation angles of the heart were obtained from the orientation of the DT-MRI primary eigenvectors. In a spatially homogeneous electrophysiological monodomain model with the DT-MRI based heart geometries, cardiac re-entry was initiated at a prescribed location in a 2D slice, and in the 3D whole heart anatomy models. Excitation was described by simplified FitzHugh-Nagumo kinetics. In a slice of the heart, with propagation velocity twice as fast along the fibers than across the fibers, DT-MRI based fiber anisotropy changes the re-entry dynamics from pinned to an anatomical re-entry. In the 3D whole heart models, the fiber anisotropy changes cardiac re-entry dynamics from a persistent re-entry to the re-entry self-termination. The self-termination time depends on the re-entry's initial position. In all the simulations with the DT-MRI based cardiac geometry, the anisotropy of the myocardial tissue shortens the time to re-entry self-termination several folds. The numerical simulations depend on the validity of the DT-MRI data set used. The ventricular wall showed the characteristic transmural rotation of the helix angle of the developed mammalian heart, while the fiber orientation in the atria was irregular.
1. Introduction
Since the over a century ago hypothesis that cardiac re-entry underlies cardiac arrhythmias [1, 2], and the much later confirmation of the hypothesis in cardiac tissue experiment [3, 4], the re-entry (aka spiral wave in 2D, cardiac excitation vortex in 3D), its origin and its role in sustained arrhythmias and fibrillation, as well as a possibility of its effective control and defibrillation, have been an object of extensive theoretical study and modeling [5–20]. From experiment, it is an established point of view that cardiac arrhythmias are due to a complex combination of electrophysiological [21–23], structural [24–27], and anatomical [28, 29] factors which sustain cardiac re-entry [30–33].
The specific effect of the heart anisotropy and anatomy on cardiac re-entry dynamics is well appreciated [34–37], and has been studied in simplified mathematical and computer models [14–16, 38, 39]. The anisotropic discontinuities in the heart muscle have been commonly seen as a substrate for rise of cardiac re-entry due to the abrupt change in conduction velocity and wavefront curvature [14, 40, 41]. On the other hand, extensive mapping of cardiac myocyte orientation in mammalian hearts has shown that the transmural fiber arrangement, including the range of transmural change in fiber angle in ventricular wall, was consistent within a species, and varied between species [42, p. 173]. So that the anisotropic discontinuities observed in healthy hearts, and shown to be consistent within a species, might have been suspected to facilitate initiation of arrhythmias.
With the recent advance in DT-MRI technology and in High Performance Computing (HPC), the DT-MRI data sets, including anatomy and myofiber structure, can now be directly incorporated into anatomically realistic computer simulations [34, 43, 44], so that the anisotropy of the tissue in the in silico model can be switched on and off for the comparison between the isotropic and anisotropic conduction, in order to see the specific anatomy effects, as well as the interplay between the anatomy and anisotropy of an individual heart.
In this paper, we present DT-MRI based anatomically and myofiber structure realistic computer simulation study of cardiac re-entry dynamics in the in silico model of human fetal heart. The raw DT-MRI data [45] was segmented into the tissue/non-tissue pixels based on the MRI luminosity threshold, followed by the calculation of the fiber angles at each voxel from the diffusion-weighted DT-MRI images. The DT-MRI yields 3 eigenvalues, the primary (largest) eigenvalue was used to define local fiber orientations in the simulation study.
The main objectives are to clarify: (i) whether the anatomical settings of the fetal heart might support a positive filament tension re-entry, and (ii) what would it be the role of the heart anisotropy in that case. Here we demonstrate that anisotropy of the fetal heart rather facilitates self-termination of cardiac re-entry. In a 2D slice of the heart, the fiber anisotropy might change dynamics of the re-entry from pinned to anatomical re-entry. In the full 3D DT-MRI based model, depending on the location of re-entry initiation, the isotropic geometry of the heart might sustain perpetual re-entry even with a positive filament tension kinetics. While the same positive filament tension re-entry initiated at the same location of the fetal heart with the fiber anisotropy self-terminates within a fraction of the rotation period. Time of re-entry self-termination depends on the re-entry initial position. Anisotropy of the real heart speeds up re-entry self-termination. The geometry and anisotropy of the heart together ensure the fastest self-termination of cardiac re-entry.
The novel significance of our findings is that we demonstrate that the heart anisotropy might have rather anti-arrhythmic function as it facilitates fast self-termination of cardiac re-entry. A general role of fiber anisotropy in the genesis and sustenance of arrhythmias could be addressed by numerics even on idealized and simplified geometries with different spatial distributions of anisotropy. The biomedical question addressed in the manuscript is whether self-terminating ventricular arrhythmias can occur in a developing fetal heart, as has inferred from fECG data in Benson et al. [46].
2. Materials and Methods
2.1. DT-MRI Data Sets
Tissue acquisition followed medical termination of pregnancy with written and informed consent, and Ethical approval from Lothian Research Ethics Committee (reference 08/S1101/1). Temporary storage of the tissue for imaging was in premises licensed under the UK 2004 Human Tissues Act.
The DT-MRI data set used in this study was of a 143 days gestational age (DGA) human fetal heart described in Pervolaraki et al. [45]. It was selected as by 143 days the smooth, transmural 120° transmural rotation in helix fiber angle is well established [45, 47, 48]. The heart was immersed in formalin shortly after dissection, and imaged in fomblin after two weeks in formalin.
MRI acquisition was performed in a Bruker Biospin (Ettlingen, Germany) 9.4 Tesla vertical NMR/S System with a 22 mm imaging coil for Hydrogen (1 H). A three-dimensional diffusion weighted spin echo sequence was carried out at 20°C with 0.1 mm2 resolution, echo time = 15 ms, repetition time = 500 ms, with 6 averages and a b-value of 1, 000 s/mm2. In each scan, diffusion weighted images were obtained in 12 directions. The average scan time was 24 h.
2.2. DT-MRI Based Anatomy Model
Figure 1 shows a cross section of the 143 days of gestational age (DGA) fetal heart, with the already formed intramural myolaminar structure, and yet a bit irregular surface epicardial, endocardial, and septal fibers, see also Figure 4 in Pervolaraki et al. [45, p. 5] for the color-encoded fractional anisotropy (FA) and all the three components of the fiber angles in the human fetal heart. While in an adult heart, pinning of cardiac re-entry to endocardium structures such as pectinate muscles junction with crystae terminalis had been previously reported [31, 33, 49]. The DT-MRI based fetal heart model offered a unique opportunity to see whether the 20 weeks of gestation age intramural heart structure was capable to support cardiac re-entry, because at that fetal development stage it would not be possible yet for the re-entry to pin to the endocardium fine features, for these anatomical structures were yet to be developed later.
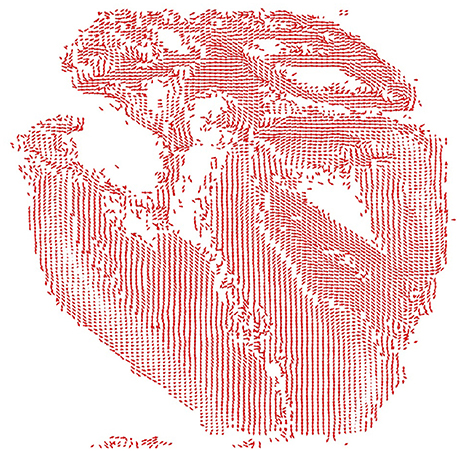
Figure 1. The 143 DGA human fetal heart [45]. BeatBox [44] geometry .bbg format visualization with projections of the unit vectors of the local fiber orientation onto the cross-section plane: a smooth intramural fiber distribution has developed, with some surface irregular fibers from earlier developmental stages, as seen in Figure 4 [45, p. 5].
The DT-MRI data sets of the 128 × 128 × 128 voxels size, with voxel resolution of ~100 μm, of 143 days of gestational age (DGA) human fetal heart [45], were converted into the BeatBox [44] regular Cartesian mesh .bbg geometry format, containing the DT-MRI Cartesian coordinates of the heart tissue points together with the corresponding components of the diffusion tensor primary eigenvectors [44]. The .bbg file is an ASCII text file, each line in which describes a point in a regular mesh in the following format:
Here x, y, z are integer Cartesian coordinates of a DT-MRI voxel, status is a flag with a nonzero-value for a tissue point, and fiber_x, fiber_y, fiber_z are x-, y- and z-components of the fiber orientation vector at that point. To reduce the size of the .bbg files, only the tissue points, that is points with non-zero status need to be specified, because the BeatBox solver will ignore the void points with zero status in any case. Although the original DT-MRI images data sets had 128 × 128 × 128 voxels size, the actual dimensions of the fetal heart minimum bounding box were 67 × 91 × 128, with 181070 tissue points.
The raw DT-MRI anatomy data [45] were segmented into the “tissue”/“not tissue” pixels discretion based on the MRI luminosity threshold, with the Cartesian fiber angles at each voxel obtained from the diffusion-weighted DT-MRI images. Only this basic segmentaion of the raw DT-MRI anatomy data [45] was taken into account in the computer simulation of cardiac re-entry dynamics, so we shall refer to it as the raw DT-MRI based anatomy model.
Any raw MRI and micro-CT image data show tiny bits of the preparation tissue, which usually get into the image together with the heart at the preparation stage. In the case of the raw DT-MRI image of the fetal heart [45], there happened to be a tiny bit of tissue at the bottom of the MRI image, adjacent to the apex of the fetal heart, see Figure 1, and the original Figure 2(a), last panel, in Pervolaraki et al. [45, p. 3]. In order to see whether this tiny “leftover” piece of the heart tissue is capable to affect the outcome of a re-entry simulation, we edited the MRI images in order to remove the “leftover” piece, and then considered a comparison of the re-entry simulation in the two 3D DT-MRI based heart models: (i) raw DT-MRI based anatomy model, and (ii) “edited” DT-MRI based anatomy model without the tiny “leftover” piece of the heart tissue.
In case of the 2D model of a slice of the heart, in order to construct the 2D diffusivity tensor, the fibers vectors were projected into the plane of the slice of the heart.
2.3. Cardiac Tissue Model
To investigate the effects of anatomy on cardiac re-entry dynamics we used monodomain tissue model with non-flux boundary conditions
where , is the position vector, is the FitzHugh-Nagumo [50] kinetics column-vector
with the parameter values α = 0.3, β = 0.71, γ = 0.5, which in an infinite excitable medium support a rigidly rotating vortex with positive filament tension [51]. The simplified FHN model was intentionally chosen for this study in order to fully eliminate the possible effects of a realistic cell excitation kinetics, such as e.g., meander [50], alternans [52], negative filament tension [51], etc., and in order to enhance and highlight the pure effects of the heart anatomy and anisotropy on the cardiac re-entry outcome. , where Q = diag(1, 0) = is the matrix of the relative diffusion coefficients for u and υ components, and is the u component diffusion tensor, which has only two different eigenvalues: the bigger, simple eigenvalue P∥ corresponding to the direction along the tissue fibers, and the smaller, double eigenvalue P⊥, corresponding to the directions across the fibers, so that
where is the unit vector of the fiber direction; is the vector normal to the tissue boundary G. In the isotropic simulation, P∥ and P⊥ values were fixed at P∥ = P⊥ = 1 [corresponding 1D conduction velocity 1.89, in the dimensionless units of Equations (1, 2)]. In the anisotropic simulations, P∥ and P⊥ values were fixed at P∥ = 2, P⊥ = 0.5 (corresponding conduction velocities 2.68 and 1.34 respectively). All the conduction velocities have been computed for the period waves with the frequency of the free spiral wave in the model, i.e., 11.36. With the isotropic diffusivity (P∥ = P⊥ = 1) equal to the geometric mean between the faster and the slower anisotropic diffusivities (P∥ = 2, P⊥ = 1/2), the isotropic conduction velocity 1.89 was almost exactly the same as the geometric mean ≈1.895 of the faster and slower (2.68 and 1.34 respectively) anisotropic conduction velocities, chosen in order to minimize the maximal relative difference between the isotropic and anisotropic propagation speeds.
All the computer simulations presented here were done using the BeatBox [44] software package with the explicit time-step Euler scheme, on the Cartesian regular grid with space step discretization Δx = 0.1, time step discretization Δt = 0.001; 5-point stencil for isotropic, and 9-point stencil for anisotropic Laplacian approximation in 2D simulations; 7-point stencil for isotropic, and 27-point stencil for anisotropic Laplacian approximation in 3D simulations. The re-entry was initiated by the phase distribution method [53]: in the 2D simulations, at a prescribed location of the cross section of the DT-MRI based anatomical model shown in Figure 1; in the 3D simulations, at a prescribed location of the full DT-MRI based whole heart anatomical model.
The FHN model Equations (1, 2) is not biophysically detailed and is formulated in dimensionless units. So, for illustrative purposes only, if we took the FHN time unit to be 1t.u. = 40ms this would give the APD90 of 125.6ms which is within the range reported e.g., by Zhu et al. [54]. The spiral wave period is then 454ms: at our chosen kinetics parameters, the spirals in FHN model have a big core. With the space step discretization Δx = 0.1 in FHN simulations, whereas the real grid resolution is 100 μm = 0.1mm, hence we would have the FHN space unit 1s.u. = 1mm. The (geometric mean) diffusivity of 1s.u.2/t.u. therefore works out as 0.025mm2/ms, and the corresponding conduction velocity of 1.89s.u./t.u. is 0.04725mm/ms. That gives a spiral wavelength of ≈21.45 mm. The conduction velocity thus obtained is within the range reported in Pervolaraki et al. [45], whereas the diffusivity is about four times smaller than the one used in Pervolaraki et al. [55]. We must stress here that, since the FHN kinetics is not biophysically detailed, one should not expect anything more than an order-of-magnitude correspondence with reality.
3. Results
3.1. 2D MRI-Based “Slice” Simulations
In the 2D simulations, Figure 2, a counter-clockwise re-entry was initiated by the phase distribution method [53], with the initial center of rotation placed at the prescribed location x0 = 40, y0 = 60 in the 2D cross section of the DT-MRI based anatomical model shown in Figure 1.
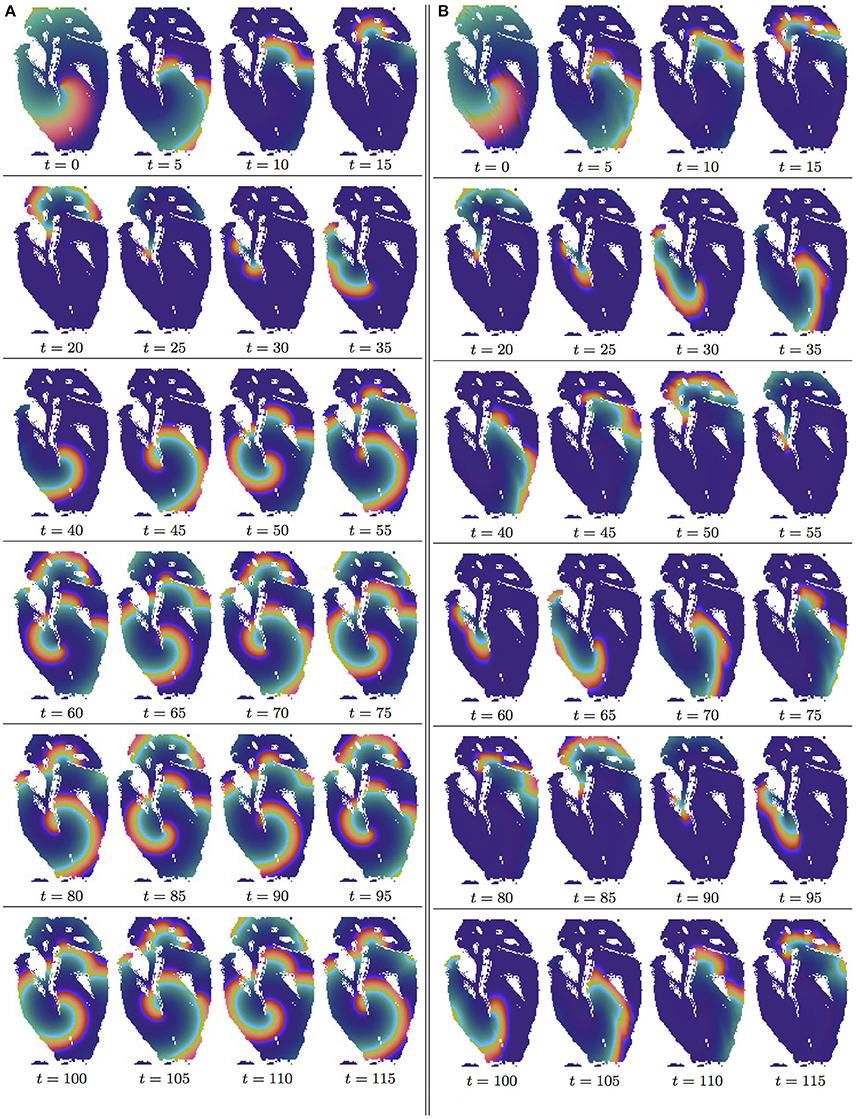
Figure 2. Anisotropy effect in the 2D slice simulations, time shown under each panel in time units of Equations (1, 2). (A) Isotropic conduction: after the transient first rotation around the septum cuneiform opening, the slow excitation re-entry pins to the sharp low end of the opening in the fetal heart (See Supplementary Video 1). (B) Anisotropic conduction: after the fast transient first rotation around the septum cuneiform opening, the anisotropy of the fetal heart turns the initial spiral wave into the fast anatomical re-entry around the septum cuneiform opening (See Supplementary Video 2).
In the Figures 2A,B, it can be seen that in both isotropic and anisotropic 2D simulations, at t = 0, there was identical location of the initial re-entry rotation center: roughly in the middle of the slice, in the vicinity of the septum cuneiform opening.
Figure 2A shows isotropic dynamics of the re-entry, that is with the fiber orientation data “turned OFF,” so that only the geometry of the isotropic homogeneous slice affects the re-entry. While in an infinite medium the chosen FHN parameter values α = 0.3, β = 0.71, γ = 0.5 produce rigidly rotating spiral [50], the boundaries of the fetal heart slice model cause the drift of the re-entry. The re-entry does not terminate because of the reflection from the inexcitable boundaries [12], but after the transient first rotation around the septum cuneiform opening, the tip of the re-entry firmly pins (at t = 35) to the sharp lower end of the cuneiform opening, see Figure 2A.
Figure 2B shows anisotropic dynamics of the re-entry, that is with the fiber orientation data “turned ON,” so that both the geometry and the anisotropy of the otherwise homogeneous slice of the heart affect the dynamics of the re-entry, causing its drift. In the anisotropic slice, the re-entry also does not terminate at the inexcitable boundaries, but after a faster than in the previous isotropic case transient, compare the time units labels in the Figures 2A,B, the anisotropy of the medium turns the initial spiral wave into the fast anatomical re-entry around the septum cuneiform opening, see Figure 2B.
3.2. 3D Whole Heart MRI-Based Simulations
3.2.1. Raw DT-MRI Anatomy Model
In the 3D whole heart raw DT-MRI based simulations shown in the Figures 3, 4, a counter-clockwise excitation vortex was initiated by the phase distribution method [53], with the initial position of the transmural vortex filament (yellow line) at the prescribed location along the x axis at y0 = 40, z0 = 60. It can be seen in Figure 3 isotropic, and Figure 4 anisotropic 3D simulations that, at t = 0, there was identical initial location of the filament of the excitation vortex: that is transmurally, roughly in the middle through the ventricles of the heart.
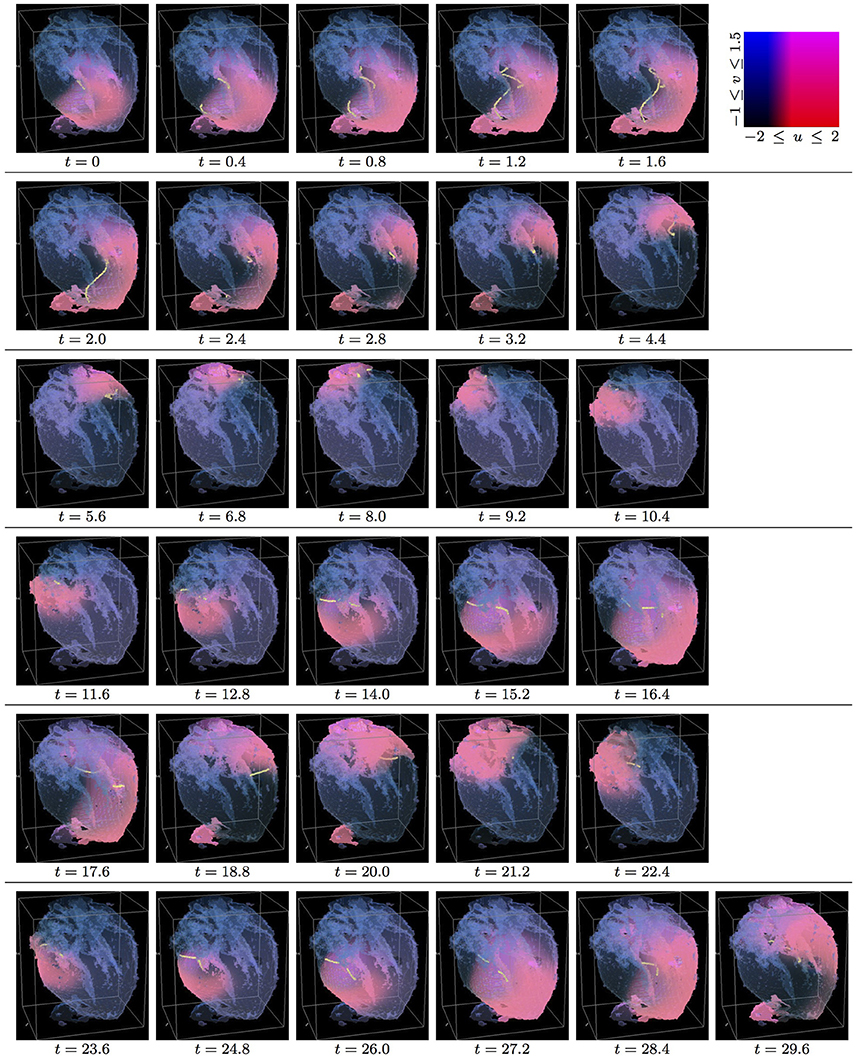
Figure 3. Isotropic whole heart simulation. The translucent fetal heart is shown in blue, excitation front shown in red (see the color box in this figure), the yellow lines are the instant organizing filaments of the excitation vortices; time shown under each panel in time units of Equations (1, 2). After a short transient the organizing filament of the initial vortex breaks into the two short pieces each of which finds its own synchronous perpetual pathway, resulting in the perpetual cardiac re-entry in the fetal heart (See Supplementary Video 3).
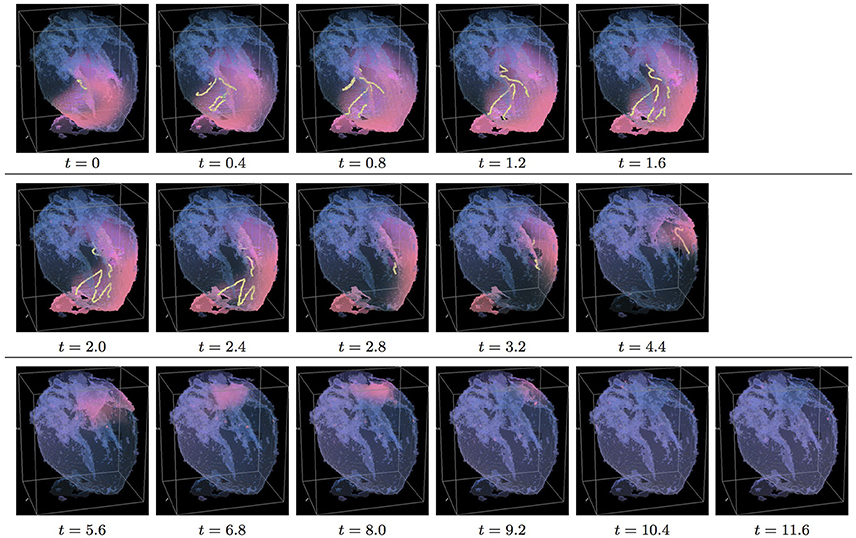
Figure 4. Anisotropic whole heart simulation. The translucent fetal heart is shown in blue, excitation front shown in red (see the color box in Figure 3), the yellow lines are the instant organizing filaments of the excitation vortices; time shown under each panel in time units of Equations (1, 2). The anisotropy of the heart causes the fast transient distortion of the organizing filament of the initial excitation vortex and drift toward the inexcitable boundary of the heart, ultimately resulting in the very fast self termination of the excitation vortex (See Supplementary Video 4).
Figure 3 shows the isotropic dynamics of the excitation vortex, that is with the fiber orientation data “turned OFF,” so that only the geometry of the otherwise isotropic homogeneous fetal heart affects dynamics of the vortex. At the chosen parameter values α = 0.3, β = 0.71, γ = 0.5, the FHN vortex has positive filament tension [51], and, depending on topology of an isotropic homogeneous medium, either collapses or straightens up between parallel boundaries. In the isotropic simulations of the fetal heart, boundaries of the heart cause the vortex to drift and collapse. However, there exist initial locations of the excitation vortex, which although result in the drift of the vortex, still do not lead to the expected collapse of the vortex with positive filament tension. One of such outcomes is shown in the Figure 3. Here, following the geometry of the heart, after a very short transient, the initial vortex filament breaks into the two major pieces, each of which finds its own synchronous pathway in the “isotropic” fetal heart, resulting in the seemingly perpetual cardiac re-entry, which failed to self-terminate within the extended simulation time t = 30. Figure 11 gives the summary of the simulation detail, where the maximum instant number of the filaments in the simulation was 9 at t = 1.0, the maximum instant total length of the filaments was 127.1 at t = 1.6; while the time average number of the filaments in the simulation was 3.4, and the time average total length of the filaments was 29.3. The time course of the instant number of filaments (blue dashed line) is shown in Figure 12A, and the time course of the instant total length of the filaments (blue dashed line) is shown in Figure 12B. It can be seen that, after a very fast transient increase in both the number of filaments and the total length of the filaments, these fail to disappear, and keep oscillating around above zero constants.
Figure 4 shows anisotropic dynamics of the excitation vortex, that is with the fiber orientation data “turned ON,” so that both the geometry and the anisotropy of the otherwise homogeneous model of the fetal heart affect dynamics of the vortex. Here, the anisotropy of the heart causes fast transient distortion of the filament, and drift toward the inexcitable boundary of the heart, followed by the very fast self-termination of the vortex by t = 5.3. The time course of the instant number of filaments (pink dotted line) is shown in Figure 12A, and the time course of the instant total length of the filaments (pink dotted line) is shown in Figure 12B. It can be seen that, after a very fast transient increase in both the number of the filaments and the total length of the filaments, all the filaments rapidly disappear. The maximum instant number of the filaments was 13 at t = 0.8, that is higher and achieved faster than in the isotropic conduction. The maximum instant total length of the filaments was 179.7 at t = 1.8, again much higher than in the isotropic conduction. The time average number of the filaments in the simulation was 6.5, twice higher than in the isotropic conduction, and the time average total length of the filaments was 91.2, three times higher than in the isotropic conduction, see the summary of the simulation detail in Figure 11.
In the 3D whole heart raw DT-MRI based simulations shown in the Figures 3, 4 a counter-clockwise excitation vortex was initiated by the phase distribution method [53], with the initial position of the transmural vortex filament (yellow line) at the prescribed location along the y axis at x0 = 40, z0 = 60, that is perpendicular to the initial orientation of the vortex filament shown in Figures 3, 4. It can be seen in Figure 5 isotropic, and in Figure 6 anisotropic 3D simulations, that at t = 0, there was identical initial location of the filament of the excitation vortex: that is transmurally, roughly in the middle through the ventricles of the fetal heart, and perpendicular to the initial orientation of the vortex filament shown in Figures 3, 4.
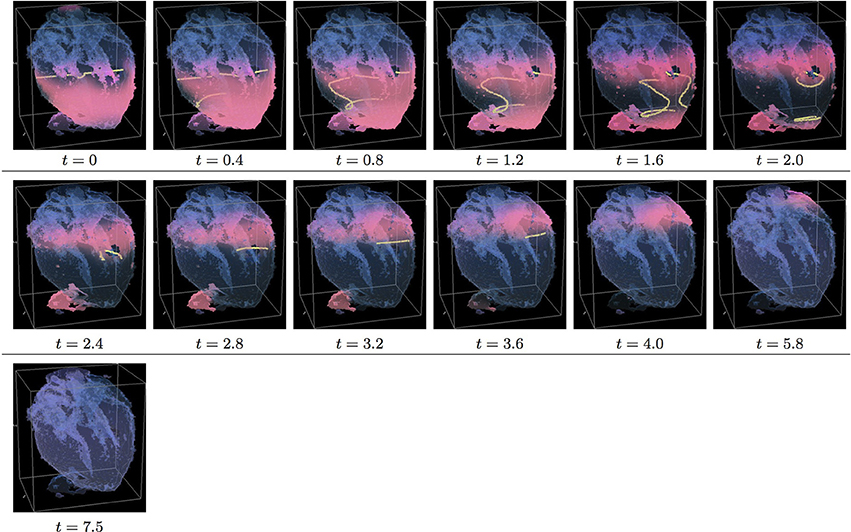
Figure 5. Isotropic whole heart simulation. The translucent fetal heart is shown in blue, excitation front shown in red (see the color box in Figure 3), the yellow lines are the instant organizing filaments of the excitation vortices; time shown under each panel in time units of Equations (1, 2). After a short transient the organizing filament of the initial vortex breaks into the two pieces each of which fast terminates: one at the base and another at the apex of the heart (See Supplementary Video 5).
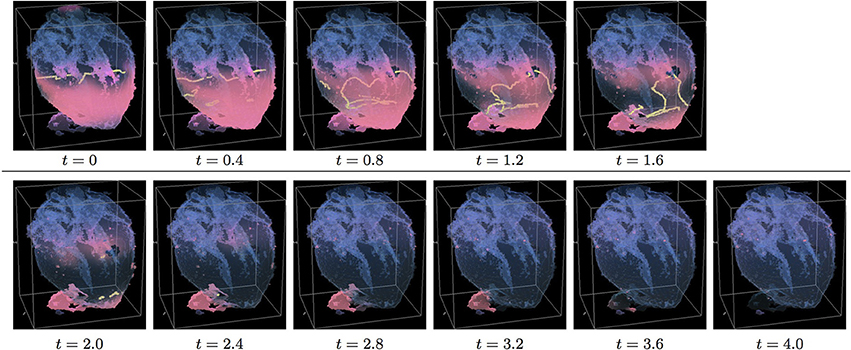
Figure 6. Anisotropic whole heart simulation. The translucent fetal heart is shown in blue, excitation front shown in red (see the color box in Figure 3), the yellow lines are the instant organizing filaments of the excitation vortices; time shown under each panel in time units of Equations (1, 2). The anisotropy of the heart causes the fast transient distortion of the organizing filament of the initial excitation vortex, followed by the fast drift and self-termination at the apex of the heart (See Supplementary Video 6).
Figure 5 shows the isotropic dynamics of the excitation vortex, that is with the fiber orientation data “turned OFF,” so that only the geometry of the otherwise isotropic homogeneous fetal heart affects dynamics of the vortex. Here, contrary to the expectation for the positive filament tension vortex to always contract, the organizing filament first transiently extends intramurally along the tissue walls, before the final break up into the two ring-like pieces, each of which then quickly contracts and terminates at the opposite base and apex regions of the heart by t = 4. The time course of the instant number of filaments (blue dashed line) is shown in Figure 12C, and the time course of the instant total length of the filaments (blue dashed line) is shown in Figure 12D. It can be seen that, after a very fast transient increase in both the number of the filaments and the total length of the filaments, all the filaments rapidly disappear. The maximum instant number of the filaments was 12 at t = 1.4, with the maximum instant total length of the filaments 188.0 achieved at t = 1.5. The time average number of the filaments in the simulation was 4.7, and the time average total length of the filaments was 80.5, see the summary of the simulation detail in Figure 11. It can be seen that in this isotropic conduction simulation, with just a different location/orientation of the initial vortex filament, the time average total length of the vortex filaments was two and a half times higher than in the failed to self-terminate isotropic conduction simulation shown in Figure 3.
Figure 6 shows anisotropic dynamics of the excitation vortex, that is with the fiber orientation data “turned ON,” so that both the geometry and the anisotropy of the otherwise homogeneous model of the heart affect dynamics of the vortex leading to its really fast termination at the apex of the heart by t = 2.6. The time course of the instant number of filaments (pink dotted line) is shown in Figure 12C, and the time course of the instant total length of the filaments (pink dotted line) is shown in Figure 12D. It can be seen that, after a very fast transient increase in both the number of the filaments and the total length of the filaments, all the filaments rapidly disappear. The maximum instant number of the filaments was 17 at t = 0.5, that is higher and achieved faster than in the corresponding isotropic conduction shown in Figure 5. The maximum instant total length of the filaments was 278.6 at t = 0.9, again much higher than in the corresponding isotropic conduction. The time average number of the filaments in the simulation was 9.5, twice higher than in the isotropic conduction, and the time average total length of the filaments was 152.6, also twice higher than in the isotropic conduction, see the summary of the simulation detail in Figure 11.
It can be seen in the raw DT-MRI model simulations shown in Figures 3–6, that although the organizing filament of the vortex could not get through into the accidental “leftover” piece of tissue adjacent to the apical region, the piece still got activated, and could have served as an artificial “capacitor” affecting dynamics of the re-entry. In order to check whether this might be the case, we edited the original raw DT-MRI model by removing in the MRI the foreign “leftover” piece, and repeated the whole heart isotropic and anisotropic simulations from the same two orthogonal initial locations of the re-entry, similar to the shown in Figures 3–6.
3.2.2. “Edited” DT-MRI Anatomy Model
In the 3D whole heart “edited” MRI model simulations shown in the Figures 7, 8, a counter-clockwise excitation vortex was initiated by the phase distribution method [53], with the initial position of the transmural vortex filament (yellow line) at the prescribed location along the x axis at y0 = 40, z0 = 60. It can be seen in Figure 7 isotropic, and in Figure 8 anisotropic 3D simulations, that, at t = 0, there was identical initial location of the filament of the excitation vortex: that is transmurally, roughly in the middle through the ventricles of the fetal heart, similar to the initial location of the vortex filament in the raw DT-MRI simulations shown in Figures 3, 4.
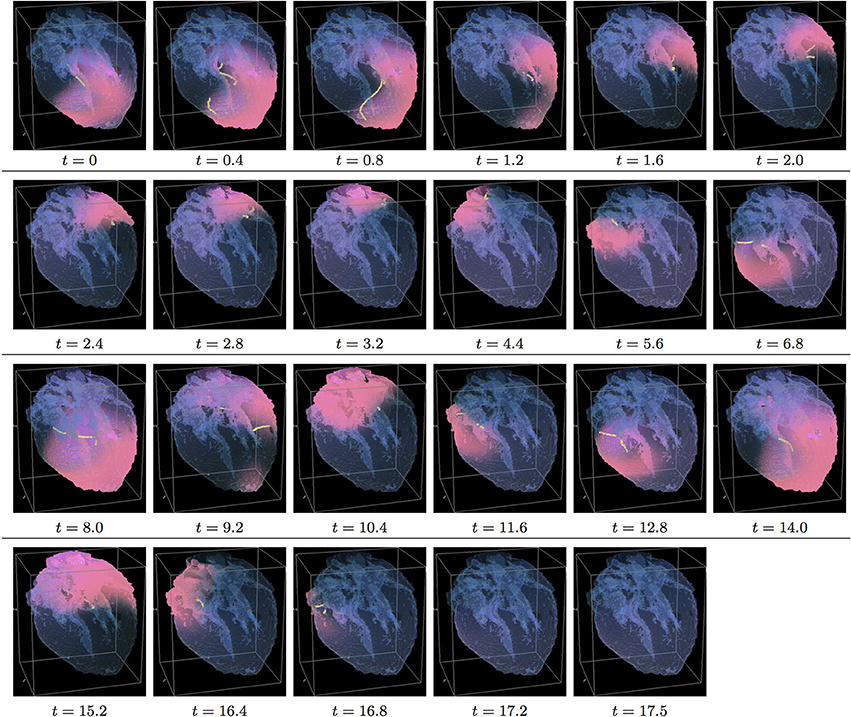
Figure 7. Isotropic “edited” whole heart simulation. The translucent fetal heart is shown in blue, excitation front shown in red (see the color box in Figure 3), the yellow lines are the instant organizing filaments of the excitation vortices; time shown under each panel in time units of Equations (1, 2). After a short transient the organizing filament of the initial vortex breaks into the two short pieces each of which finds its own synchronous pathway, resulting after a few rotations in the synchronous termination of the filaments in the base of the fetal heart (See Supplementary Video 7).
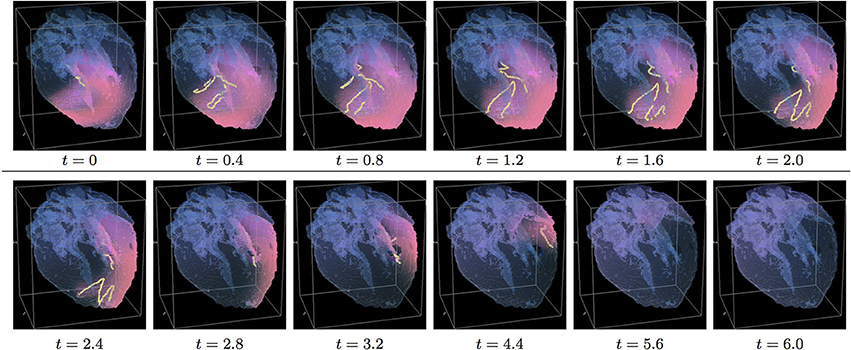
Figure 8. Anisotropic “edited” whole heart simulation. The translucent fetal heart is shown in blue, excitation front shown in red (see the color box in Figure 3), the yellow lines are the instant organizing filaments of the excitation vortices; time shown under each panel in time units of Equations (1, 2). The anisotropy of the heart causes the significant transient distortion of the organizing filament of the initial vortex, followed by its fast drift toward the apex and the ultimate termination before completing a single rotation (See Supplementary Video 8).
Figure 7 shows isotropic dynamics of the vortex, that is with the fiber orientation data “turned OFF,” so that only the geometry of the otherwise isotropic homogeneous fetal heart affects dynamics of the vortex. Here, following the geometry of the heart, the initial filament also breaks into the two major pieces, each of which also finds its own synchronous pathway similar to the beginning of the raw DT-MRI simulation shown in Figure 3. However, this time, after just a few rotations, the two re-entries find their end in their almost synchronous termination in the base region of the heart by t = 16.9. The time course of the instant number of filaments (green dashed line) is shown in Figure 12A, and the time course of the instant total length of the filaments (green dashed line) is shown in Figure 12B. It can be seen that, after a very fast transient increase in both the number of the filaments and the total length of the filaments, all the filaments rapidly disappear. The maximum instant number of the filaments was 9 at t = 0.2. The maximum instant total length of the filaments was 122.3 at t = 0.7. The time average number of the filaments in the simulation was 3.2, and the time average total length of the filaments was 28.7, see the summary of the simulation detail in Figure 11. It can be seen that, in the “edited” MRI isotropic simulation in Figure 7, the maximum instant and the time average number of the filaments, as well as the maximum instant and the time average total length of the filaments, were practically the same as in the corresponding raw MRI isotropic simulation with the failed to self-terminate re-entry shown in Figure 3. The only quantitative difference between the two isotropic simulations, i.e., the perpetual re-entry in Figure 3 vs. the self-termination in Figure 7, was that, in the “edited” MRI isotropic simulation, without the “leftover” piece of tissue adjacent to the apex of the heart, the maximum instant number of the filaments, and the maximum instant total length of the filaments were achieved much faster: by t = 0.2 and t = 0.7 correspondingly.
Figure 8 shows anisotropic dynamics of the vortex, that is with the fiber orientation data “turned ON,” so that both the geometry and the anisotropy of the otherwise homogeneous model of the heart affect dynamics of the vortex. Here, the anisotropy of the heart also causes significant transient distortion of the initial filament, followed by the fast drift toward the apex, with the ultimate termination at the AV border before a completion of a single rotation, very similar to the corresponding raw DT-MRI anisotropic simulation shown in Figure 4. However, in the “edited” MRI model without the “leftover” piece adjacent to the apex, repolarization of the heart is faster than it was in the presence of the “incidental capacitor” effect in the corresponding raw DT-MRI simulation shown in Figure 4. The time course of the instant number of filaments (red solid line) is shown in Figure 12A, and the time course of the instant total length of the filaments (red solid line) is shown in Figure 12B. It can be seen that, after a very fast transient increase in both the number of the filaments and the total length of the filaments, all the filaments rapidly disappear by t = 4.8. The maximum instant number of the filaments was 17 at t = 0.4, that is higher than in the corresponding raw anisotropic conduction shown in Figure 4, and twice higher than in the corresponding “edited” isotropic conduction shown in Figure 7. The maximum instant total length of the filaments was 180.3 at t = 0.7, similar to the corresponding raw anisotropic conduction shown in Figure 4, and much higher than in the corresponding “edited” isotropic conduction shown in Figure 7. The time average number of the filaments in the simulation was 6.3, similar to the corresponding raw anisotropic conduction shown in Figure 4, and twice higher than in the corresponding “edited” isotropic conduction shown in Figure 7. The time average total length of the filaments was 95.4, similar to the corresponding raw anisotropic conduction shown in Figure 4, and three times higher than in the corresponding raw isotropic conduction shown in Figure 4. Time to the maximum number of the filaments (t = 0.4), and time to the maximum total length of the filaments (t = 0.7), were similar to the corresponding “edited” isotropic conduction shown in Figure 7, and twice faster than in the corresponding raw anisotropic conduction shown in Figure 4, see the summary of the simulation detail in Figure 11. So, that the anisotropy of the heart increased the number and the total length of the filaments, and shortened the time to self-termination by folds, while the “incidental capacitor” effect of the “leftover” piece adjacent to the apex slowed down the process.
In the 3D whole heart “edited” MRI simulations shown in Figures 9, 10, a counter-clockwise excitation vortex was initiated by the phase distribution method [53], with the initial position of the transmural filament (yellow line) at the prescribed location along the y axis at x0 = 40, z0 = 60. It can be seen in Figure 9 isotropic, and in Figure 10 anisotropic 3D simulations, that at t = 0, there was the identical initial location of the filament: that is transmurally, roughly in the middle through the ventricles of the heart, perpendicular to the filament initial location in the “edited” MRI simulations shown in Figures 7, 8, and similar to the initial location of the filament in the raw DT-MRI simulations shown in Figures 5, 6.
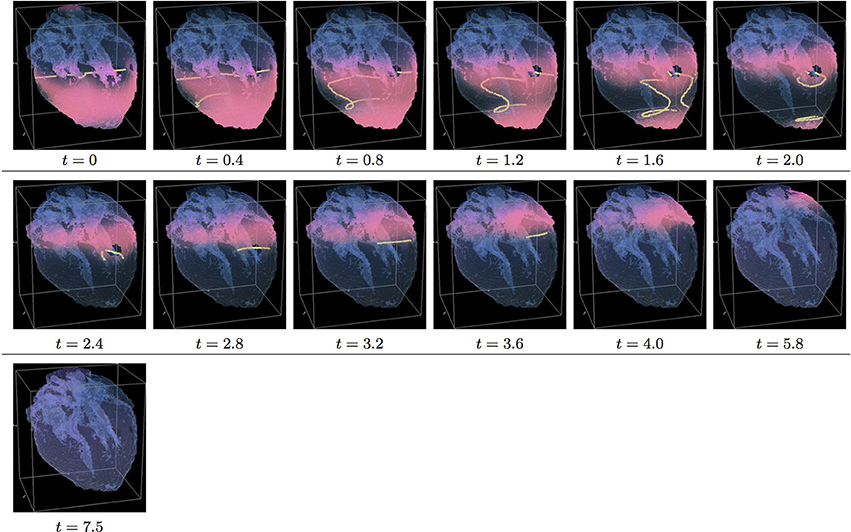
Figure 9. Isotropic “edited” whole heart simulation. The translucent fetal heart is shown in blue, excitation front shown in red (see the color box in Figure 3), the yellow lines are the instant organizing filaments of the excitation vortices; time shown under each panel in time units of Equations (1, 2). After a short transient the organizing filament of the initial vortex breaks into the two pieces each of which fast terminates: one at the base and another at the apex of the heart (See Supplementary Video 9).
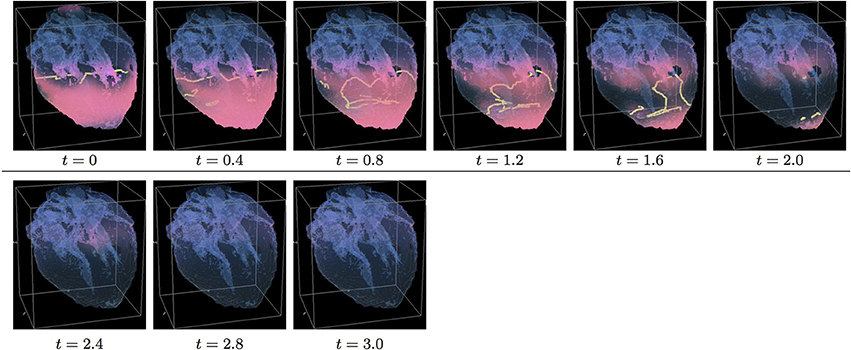
Figure 10. Anisotropic “edited” whole heart simulation. The translucent fetal heart is shown in blue, excitation front shown in red (see the color box in Figure 3), the yellow lines are the instant organizing filaments of the excitation vortices; time shown under each panel in time units of Equations (1, 2). The anisotropy of the heart causes the fast significant transient distortion of the organizing filament of the initial excitation vortex, followed by the fast drift toward the apex and ultimate termination before the first rotation has ever started (See Supplementary Video 10).
Figure 9 shows “edited” MRI isotropic dynamics of the vortex, that is with the fiber orientation data “turned OFF,” so that only the geometry of the otherwise isotropic homogeneous fetal heart affects the vortex. Here, again contrary to the expectation for a positive filament tension vortex to always contract, the organizing filament first transiently extends intramurally before breaking up into the two ring-like pieces, each of which quickly contracts and terminates at the opposite base and apex regions of the heart, identical to what was seen in the raw DT-MRI simulation shown in Figure 5. The time course of the instant number of filaments (green dashed line) is shown in Figure 12C, and the time course of the instant total length of the filaments (green dashed line) is shown in Figure 12D. It can be seen that, after a very fast transient increase both in the number of the filaments and in the total length of the filaments, all the filaments rapidly disappear by t = 4.0. The maximum instant number of the filaments was 12 at t = 0.5. The maximum instant total length of the filaments was 190.7 at t = 1.5. The time average number of the filaments in the simulation was 4.7, and the time average total length of the filaments was 82.9, see the summary of the simulation detail in Figure 11. So, from the comparison with the corresponding raw MRI isotropic simulation shown in Figure 5, it seems that, for that particular initial location of the filament, the “leftover” tissue did not play any role in the re-entry self-termination time.
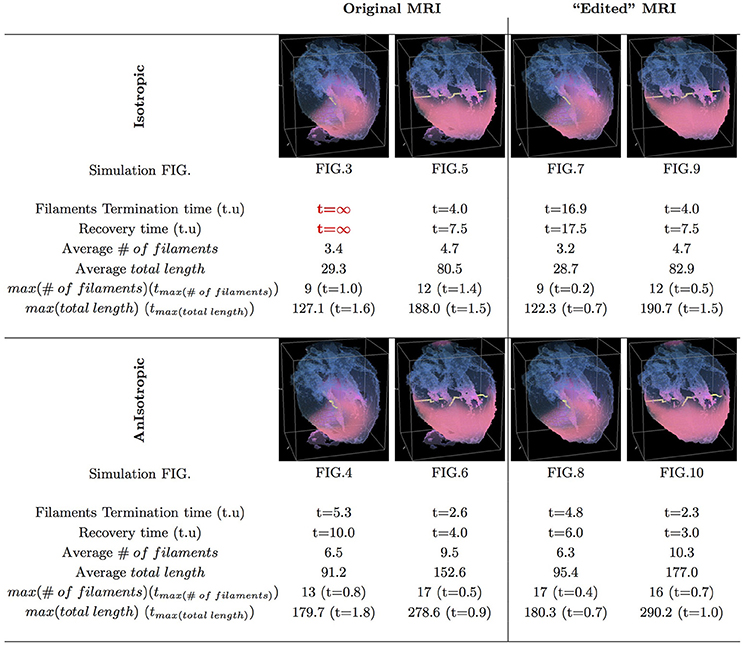
Figure 11. Whole heart simulation: re-entry termination times. The translucent fetal heart is shown in blue, excitation front shown in red (see the color box in Figure 3), the yellow lines are the instant organizing filaments of the excitation vortices. Re-entry self-termination time in time units of Equations (1, 2) is shown under each simulation Figures 3–10 initiation panel. Comparison of the respective isotropic (top row) vs. anisotropic (bottom row) simulations shows that, regardless of with or without the “leftover” piece, anisotropy results in faster termination of re-entry, and at least twice shorter recovery time. Respective comparison of the original MRI with the corresponding “edited out leftover” simulations shows that the leftover “incidental capacitor” effect, depending of the re-entry location/orientation with respect to the “incidental capacitor” own location/orientation, might significantly prolongate cardiac re-entry life time. The bigger number and the total length of the filaments tend to correlate with the faster termination of re-entry, though these fail to identify persistent re-entry in Figure 3 simulation.
Figure 10 shows anisotropic dynamics of the vortex, that is with the fiber orientation data “turned ON,” so that both the geometry and the anisotropy of the otherwise homogeneous model of the heart affect the vortex, which, in the absence of the “incidental capacitor” effect of the “leftover” piece, results in the fastest possible termination of the re-entry at the apex of the heart by t = 2.3, before the vortex first rotation ever started. The re-entry termination time here is more than twice shorter than in both the raw MRI isotropic simulation shown in Figure 5, and in the “edited” isotropic simulations shown in Figure 9; shorter than in the corresponding simulation with the “incidental capacitor” effect shown in the Figure 6, and times shorter than in any of the simulations of the re-entry with the perpendicular initial location of the filament shown in the Figures 3, 4, 7, 8. So, that the main reasons for the re-entry fastest self-termination seem to be the initial location of the filament and the anisotropy of the heart.
In Figure 11, we have summarized the results of the raw MRI simulations shown in Figures 3–6, and the “edited” MRI simulations shown in Figures 7–10. The re-entry termination time, in the time units of Equations (1, 2), is shown under each respected whole heart model initiation cite panel. It can be seen that the anisotropy of the heart causes at least twice faster termination of re-entry. It also can be seen that indeed the “leftover” piece of tissue connected to the apical region of the heart in the raw DT-MRI model served as an artificial “capacitor” affecting the re-entry dynamics, and significantly prolongated the life time of re-entry initiated at the particular location/orientation respective to the “capacitor”.
Finally, the 3D anatomically realistic simulations of the fetal heart show that the anisotropy of the heart causes the fast transient increase in the number and the total length of the filaments, see Figure 12, with the typical fast drift toward the apex area of the heart, and re-entry self-termination, see also the movies in the Supplementary Material section.
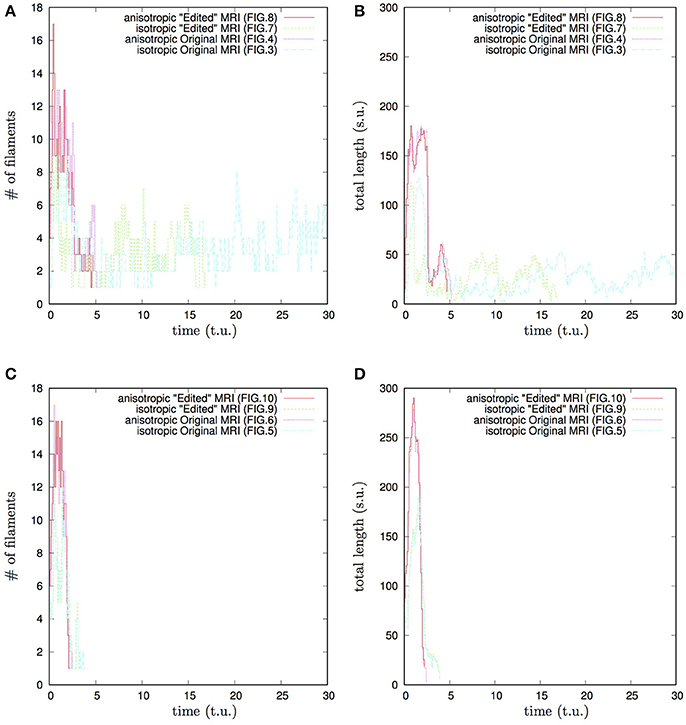
Figure 12. Whole heart simulation: time course of the number of filaments #, and of the total length of the filaments, time and the total length of the filaments shown in the time and space units of Equations (1, 2). Initial position of the vortex filament along the x axis, Figures 3, 4, 7, 8 simulations: (A) time course of the number of filaments #; (B) time course of the total length of the filaments. Initial position of the vortex filament along the y axis, Figures 5, 6, 9, 10 simulations: (C) time course of the number of filaments #; (D) time course of the total length of the filaments. Anisotropy increases the transient number and the transient total length of the filaments. The bigger transient number and the total length of the filaments tend to correlate with the faster termination of re-entry. The biggest transient total lengths of the filaments was in case of the re-entry initiated along the y axis, (D), which ensured its fastest termination. It can be seen from Figures 5, 6, 9, 10, that the initial position of the filament along the y axis allowed it to grow intramurally, thus maximally increasing the transient total length of the filaments, and speeding up their termination.
4. Discussion
Although the r ole of heart anatomy and anisotropy in the origin and sustainability of cardiac arrhythmias has been appreciated for a long time, there is limited experimental evidence to clarify detail of the heart anatomy effect on persistent cardiac arrhythmias and fibrillation. In particular, the theoretically plausible hypothesis that the anisotropic discontinuities in the heart might be a source of rise for cardiac re-entry due to the abrupt change in conduction velocity and wavefront curvature [14, 40, 41] was in controversy with the observation that the transmural fiber arrangement, including the range of transmural change in fiber angle in ventricular wall, although varied between species [42, p. 173], was consistent within a species. So that the question was that, if the pro-arrhythmic mechanism of cardiac re-entry initiation by the anisotropic discontinuities in a heart [14, 40, 41] was correct, what would then have been a reason for the consistent structure [42, p. 173] of the anisotropic discontinuities in healthy mammalian hearts. The combination of the High Performance Computing with the high-resolution DT-MRI based anatomy models of the heart allows anatomically realistic in silico testing of the effects of individual heart anatomy and anisotropy on the cardiac re-entry dynamics [34, 43, 44, 49, 56]. In this paper, for the first time, we present the anatomy and myofiber structure realistic computer simulation study of the cardiac re-entry dynamics in the DT-MRI based model of the human fetal heart [45].
The human fetal heart single anisotropic geometry dataset used in these simulations needs to be a typical and accurate representation of the cardiac structure and tissue architecture, with a spatial resolution suitable for numerical solution of the excitation equations. For a smoothly changing anisotropic geometry the imaged dataset may be interpolated to provide sufficient spatial resolution. DT-MRI has provided 17–200 cubic voxel datasets of human fetal heart [45, 48, 57, 58]. Finite difference numerical solutions of propagation in biophysically detailed models of adult cardiac tissue need ~100 μm space steps in a Cartesian coordinate system. During fetal development the structure of the heart changes, the ventricular wall is compactified and trabeculated, and the size of the heart increases. Any atlas of the developing human fetal heart would need to come from longitudinal studies (which are impractical and potentially unethical), or from a large number of hearts obtained and imaged at different gestational ages. Here, all simulations are done on a single cardiac geometry that was selected as the transmural changes in fiber helix angle had developed. The results illustrated are specific for this particular anisotropic cardiac geometry, which is critically determined by how it was imaged and reconstructed. The fiber orientation angles of the heart were obtained from the orientation of the DT-MRI primary eigenvectors. Propagation velocity was twice as fast along the fibers than across the fibers. In all the simulations on this DT-MRI based cardiac geometry, the anisotropy of the myocardial tissue shortens the duration of re-entry by several fold. The numerical simulations depend on the validity of the DT-MRI dataset used. The ventricular wall showed the characteristic transmural rotation of the helix angle of the developed mammalian heart, while the fiber orientation in the atria was irregular. We expect the results be subsequently verified on other anatomy data, including different technique data e.g., MRI vs. DT-MRI vs. micro-CT vs. serial section histology, etc.
The comparative isotropic vs. anisotropic simulation of the otherwise homogeneous model of the fetal heart shows that, in the 2D slice of the heart, the fiber anisotropy might change the re-entry dynamics from the re-entry pinned at the sharp end of the septum cuneiform opening, Figure 2A, into the fast anatomical re-entry around the opening, Figure 2B. Note that, despite of the only basic segmentation of the MRI model into the tissue/not tissue points, and the ventricles not being isolated from the atria, because of the 2D re-entry pinning to either the sharp end of the septum opening, as in the isotropic simulation shown in Figure 2A, or to the whole septum opening, as in the case of anatomical re-entry in the anisotropic simulation shown in Figure 2B, the tip of the re-entry never penetrated from the ventricles into the atria.
Although, from the cardiac physiology point of view, the only basic segmentation of the raw DT-MRI data [45] into the tissue/non-tissue pixels might be seen as a major limitation of the study, from the non-linear science point of view, the use of the raw MRI data, as an example of a nature provided medium to study a re-entry dynamics, gives an important insight into the pure anatomy induced drift in an otherwise homogeneous 2D medium, and into the possibility of pinning of the re-entry not to a major blood vessel but to a sharp end of an anatomical opening [20]; and into that a real fiber anisotropy is capable to turn the pinned re-entry into an anatomical one. Importantly though, the 2D simulations in Figure 2 are an important step to highlight the role and the necessity of the whole heart structure in the re-entry dynamics and self-termination.
In the 3D DT-MRI based isotropic model of the fetal heart, depending on the initial location/orientation of the re-entry organizing filament, the geometry of the fetal heart might sustain perpetual cardiac re-entry even with a positive filament tension, see Figures 3, 12A,B. However, if the same positive filament tension vortex is initiated at the exactly same location/orientation in the anisotropic DT-MRI based model, the fiber structure of the fetal heart facilitates fast self-termination of cardiac re-entry, see Figures 4, 12A,B.
From the respective comparison of the “isotropic vs. anisotropic” simulations in Figure 3 vs. Figure 4, and Figure 7 vs. Figure 8, it can be seen that, whereas the re-entry organizing filaments were capable to penetrate from the ventricles to atria in the isotropic simulations shown in Figures 3, 7, the abrupt change in the fiber angles between the atria and the ventricles, which one can see in Figure 1, did not allow the organizing filaments to penetrate from ventricles into atria in the anisotropic simulations shown in Figures 4, 8, so that the anisotropy of ventricles could complete the speedy elimination of the re-entry within a single rotation.
The comparison of re-entry termination times in the whole heart raw DT-MRI simulations shown in Figures 3–6, with the corresponding “edited” MRI simulations shown in Figures 7–10 showed that, although the filament of cardiac re-entry never got through into the tiny piece of the “leftover” tissue adjacent to the apex of the heart in the raw DT-MRI, the “not heart” excitable tissue served as an accidental “capacitor,” significantly prolongating the life time of cardiac re-entry initiated at a particular location/orientation respective to the “leftover” piece location/orientation. The comparison of the re-entry termination times in Figures 11, 12 shows that the higher maximum number of the filaments and the bigger total length of the filaments tend to correlate with the faster termination of re-entry. However, the usual transient increase in both the number of the filaments and in the total length of the filaments, still failed to identify and terminate the persistent re-entry shown in Figures 3, 12A,B.
The “isotropic vs. anisotropic” comparison of self-termination time, both in the raw and in the “edited” MRI whole heart simulations, confirmed that, regardless of with or without the “leftover” piece adjacent to the apex, anisotropy of the heart shortens re-entry self-termination time several folds, see Figures 11, 12. Figure 12 shows that anisotropy increases the maximum number and the maximum total length of the filaments. The bigger maximum number and the maximum total length of the filaments tend to correlate with the faster termination of re-entry. The biggest transient total lengths of the filaments was in the anisotropic case of re-entry initiated along the y axis, see the corresponding dotted pink and solid red lines in Figure 12D, which ensured the re-entry fastest termination. It can be seen from Figures 5, 6, 9, 10, that the initial position of the filament along the y axis allowed the filament to grow intramurally, thus maximally increasing the transient total length of the filaments, and shortening their termination time.
The comparison of the “edited” MRI simulations of thus completely isolated heart shown in Figures 7–10, with the raw DT-MRI simulations shown in Figures 3–6, provide an important new insight into cardiac re-entry dynamics. Namely, that an excitable tissue accidentally adjacent to the heart might serve a capacitor capable to extend re-entry self-termination time, see for the respective comparison Figure 3 vs. Figure 7, Figure 4 vs. Figure 8, Figure 5 vs. Figure 9, and Figure 6 vs. Figure 10, summarized in Figures 11, 12. The latter suggests a possible new mechanism for a persistent cardiac re-entry. That is if, apart from the major blood vessels normally adjacent to the heart in vivo, and affecting cardiac re-entry dynamics, there were also an accidental “touching” of the heart by an adjacent excitable tissue, for example, due to a change of posture in the night [59], the “incidental capacitor” effect could have extended re-entry self-termination time, up to the failure to self-terminate. The “incidental capacitor” hypothesis could be an additional explanation to the circadian rhythm [60], for the elusive and difficult to reproduce longer arrhythmia episodes reported in the night ECGs as opposed to the on average shorter arrhythmias in the day time ECGs. Although the raw DT-MRI simulations with the “leftover” piece of tissue might have been seen a limitation of the study, the real heart in vivo does not exist in complete isolation from the main blood vessels and other neighboring tissues. So, we believe that our “incidental” leftover tissue results only once more confirm the importance and the necessity of taking into account of the real anatomical settings and surrounding of the heart for the full appreciation of cardiac re-entry dynamics.
The BeatBoxDT-MRI based in silico comparative study confirms the heart anatomy and anisotropy functional effect on cardiac re-entry self-termination as opposed to its sustainability, pinning to anatomical features, transformation from pinned to anatomical re-entry, while the anisotropy of the tissue facilitates re-entry self-termination.
One of the limitations of the present study is the use of the simplified FitzHugh-Nagumo [50] excitation model, chosen for this study in order to eliminate the effects of realistic cell excitation kinetics, such as e.g., meander [50], alternans [52], negative filament tension [51], etc., and enhance and highlight the pure effects of the heart anatomy and anisotropy on the re-entry. The realistic cell excitation models should be used in the future studies, in order to clarify specific interplay of the cell kinetics with the heart anatomy and anisotropy.
As it can be seen from Figure 1[for the color-encoded fractional anisotropy (FA) and for the color-encoded all the three components of the fiber angles see also Figure 4 in Pervolaraki et al. [45, p. 5]], formation of the fetal heart fiber structure at the epicardium and endocardium is not completed yet, so that only the already formed intramural laminar myofibers affect dynamics of the re-entry. Although the use of the not fully formed fetal heart can be seen as a limitation of the study, on the other hand, the irregular epicardium and endocardium fibers seem to prevent a re-entry from pinning to the fine endocardium features, which were yet to be developed [45] later on. We appreciate that the anatomy and fiber structure differences in the fetal and in a fully formed adult heart might alter the re-entry dynamics, such as in e.g., the reported case of re-entry pinning to the junction of pectinate muscles with crystae terminalis in adult human atrium [31, 33, 49]. That is, although it is possible to initiate a cardiac re-entry in the tiny 1.4g (at 143 DGA) fetal heart [45], the already formed intramural laminar anisotropy of the fetal heart facilitates the re-entry self-termination, Figure 11. With the hindsight of the present study, in an adult heart, because of the pinning opportunities provided by the endocardium anatomical features [31, 33, 49], there must exist additional mechanisms to facilitate cardiac re-entry self-termination [61].
The most serious limitation of the study is that only the basic segmentation of the raw DT-MRI data [45] into the tissue/non-tissue pixels based on the MRI luminosity threshold, and only the primary eigenvalues of fibers orientation, were taken into account in the BeatBox [44] computer simulations of cardiac re-entry dynamics. Further levels of DT-MRI segmentation, in order to take into account e.g., the heart collagen skeleton, isolation of ventricles from atria, etc., will inevitably change the outcome of the re-entry, by adding the electrically impermeable barriers to cardiac re-entry. Currently, this further segmentation is added into DT-MRI based models via complex rule based image post-processing [62, 63], which brings in artificial assumptions, as well as limits the number of available segmented data sets. From the non-linear science point of view we pursued in this initial study, the rationale was to use the raw DT-MRI as an example of a nature provided medium to study a re-entry dynamics. In the future, the multichannel computer tomography might offer automatic tissue segmentation, so that multi-level segmented DT-MRI based models become more available, and be used in the BeatBox [44] anatomically and biophysically realistic simulations.
Finally, we believe that a simple “mechanistic” explanation, although often craved for, might be rather inadequate/premature here, and will require better theoretical understanding of the demonstrated potential effect of the heart anatomy and anisotropy on cardiac re-entry dynamics, for it is not a particular feature, or a sequence of features, but rather the whole complex of the shape, anisotropy, and position of the heart within the body, which affects the re-entry dynamics in a particular way, and which seems to have evolved in order to ensure the fastest self-termination of cardiac re-entry. If our hypothesis is correct, it might explain the difficulties with reproducibility of the arrhythmia in vivo and in an isolated heart. A general role of fiber anisotropy in the genesis and sustenance of arrhythmias could be and has been addressed by numerics on idealized and simplified geometries with different spatial distributions of anisotropy [14]. The biomedical question addressed in the manuscript is whether self-terminating ventricular arrhythmias can occur in a developing fetal heart, as has inferred from fECG data in Benson et al. [46]. The most important novel finding of the paper is that, contrary to what currently seems to be a commonly accepted view of the pro-arrhythmic nature of cardiac anisotropy, the point of view based on the mainly theoretical and simplified anatomy models studies, for the first time ever, and for the first time in a real whole heart DT-MRI based model, we have demonstrated that anisotropy of the heart might have rather anti-arrhythmic effect, as it facilitates the fastest self-termination of cardiac re-entry.
5. Resource Identification Initiative
BeatBox, RRID:SCR_015780.
Author Contributions
IB, AH, EP, and FW contributed conception and design of the study; RA, AH, and EP contributed the human fetal heart DT-MRI data sets; IB and FW converted the DT-MRI data sets into BeatBoxgeometry format and ran the simulations; IB performed visualization of the simulations and analysis, and wrote the first draft of the manuscript. FW approved submission of the paper. IB, RA, AH, and EP contributed to manuscript revision, read and approved the submitted version.
Funding
We acknowledge the support of the UK Medical Research Council grant G1100357 for the human fetal heart DT-MRI data sets. We also wish to acknowledge the support of the BeatBox software development project by EPSRC (UK) grants EP/I029664 and EP/P008690/1.
Conflict of Interest Statement
The authors declare that the research was conducted in the absence of any commercial or financial relationships that could be construed as a potential conflict of interest.
Acknowledgments
We thank all the developers of the BeatBox HPC Simulation Environment for Biophysically and Anatomically Realistic Cardiac Electrophysiology. We are grateful to Professor V. N. Biktashev for much appreciated advice and discussion.
Supplementary Material
The Supplementary Material for this article can be found online at: https://www.frontiersin.org/articles/10.3389/fphy.2018.00015/full#supplementary-material
Supplementary Video 1. 2D slice simulation, Isotropic Conduction: slow excitation re-entry pins to the sharp end of the septum cuneiform opening in the fetal heart.
Supplementary Video 2. 2D slice simulation, Anisotropic Conduction: anisotropy of the fetal heart turns initial spiral wave into fast anatomical re-entry around the septum cuneiform opening.
Supplementary Video 3. Isotropic whole heart simulation. After a short transient of the vortex initiated along the x-axis, the organizing filament breaks into the two short pieces each of which finds its own synchronous perpetual pathway, resulting in the perpetual cardiac re-entry in the fetal heart.
Supplementary Video 4. Anisotropic whole heart simulation. The anisotropy of the heart causes the fast transient distortion of the organizing filament of the vortex initiated along the x-axis, and drift toward the inexcitable boundary of the heart, resulting in the very fast self-termination of the excitation vortex.
Supplementary Video 5. Isotropic whole heart simulation. After a short transient of the vortex initiated along the y-axis, the organizing filament breaks into two pieces each of which fast terminates: one at the base and another at the apex of the heart.
Supplementary Video 6. Anisotropic whole heart simulation. The anisotropy of the heart causes the fast transient distortion of the organizing filament of the vortex initiated along the y-axis, followed by the fast drift and self-termination at the apex of the heart.
Supplementary Video 7. Isotropic “edited” whole heart simulation. After a short transient of the vortex initiated along the x-axis, the organizing filament breaks into two short pieces, each of which finds its own synchronous pathway, resulting after a few rotations in the synchronous termination of the filaments in the base of the fetal heart.
Supplementary Video 8. Anisotropic “edited” whole heart simulation. The anisotropy of the heart causes the significant transient distortion of the organizing filament of the vortex initiated along the x-axis, followed by its fast drift toward the apex, and the ultimate termination before completing a single rotation.
Supplementary Video 9. Isotropic “edited” whole heart simulation. After a short transient of the vortex initiated along the y-axis, the organizing filament breaks into two pieces, each of which fast terminates: one at the base and another at the apex of the heart.
Supplementary Video 10. Anisotropic “edited” whole heart simulation. The anisotropy of the heart causes the fast significant transient distortion of the organizing filament of the vortex initiated along the y-axis, followed by the fast drift toward the apex and termination before the first rotation has ever started.
References
1. Mines GR. On dynamic equilibrium in the heart. J Physiol. (1913) 46:349–83. doi: 10.1113/jphysiol.1913.sp001596
2. Garey WE. The nature of fibrillatory contraction of the heart – its relation to tissue mass and form. Am J Physiol. (1914) 33:397–414. doi: 10.1152/ajplegacy.1914.33.3.397
3. Allessie MA, Bonke FIM, Schopman FJ. Circus movement in rabbit atrial muscle as a mechanism of tachycardia. Circ Res. (1973) 32:54–62. doi: 10.1161/01.RES.33.1.54
4. Pertsov AM, Davidenko JM, Salomonsz R, Baxter JWT. Spiral waves of excitation underlie reentrant activity in isolated cardiac muscle. Circ Res. (1993) 72:631–50. doi: 10.1161/01.RES.72.3.631
5. Wiener N, Rosenblueth A. The mathematical formulation of the problem of conduction of impulses in a network of connected excitable elements, specifically in cardiac muscle. Arch Inst Cardiologia de Mexico. (1946) 16:205–65.
6. Balakhovsky IS. Some regimes of excitation movement in an ideal excitable tissue. Biofizika (1965) 9:1–63.
8. Panfilov AV, Rudenko AN, Pertsov AM. Twisted scroll waves in active 3-dimensional media. Doklady AN SSSR. (1984) 279:1000–2. doi: 10.1007/978-3-642-70210-5_18
9. Davydov VA, Zykov VS, Mikhailov AS, Brazhnik PK. Drift and resonance of spiral waves in active media. Radiofizika (1988) 31:574–82.
10. Keener JP. The dynamics of three-dimensionsional scroll waves in excitable media. Physica D. (1988) 31:269–76. doi: 10.1016/0167-2789(88)90080-2
11. Ermakova EA, Pertsov AM, Shnol EE. On the interaction of vortices in 2-dimensional active media. Physica D. (1989) 40:185–95. doi: 10.1016/0167-2789(89)90062-6
12. Biktashev VN, Holden AV. Design principles of a low-voltage cardiac defibrillator based on the effect of feed-back resonant drift. J Theor Biol. (1994) 169:101–13. doi: 10.1006/jtbi.1994.1132
13. Biktashev VN. A three-dimensional autowave turbulence. Int J Bifurcation Chaos (1998) 8:677–84. doi: 10.1142/S0218127498000474
14. Fenton F, Karma A. Vortex dynamics in three-dimensional continuous myocardium with fiber rotation: filament instability and fibrillation. Chaos (1998) 8:20–47. doi: 10.1063/1.166311
15. Pertsov AM, Wellner M, Vinson M, Jalife J. Topological constraint on scroll wave pinning. Phys Rev Lett. (2000) 84:2738–41. doi: 10.1103/PhysRevLett.84.2738
16. Wellner M, Berenfeld O, Jalife J, Pertsov AM. Minimal principle for rotor filaments. Proc Natl Acad Sci USA. (2002) 99:8015–8. doi: 10.1073/pnas.112026199
17. Biktasheva IV, Biktashev VN. Wave-particle dualism of spiral waves dynamics. Phys Rev E (2003) 67:026221. doi: 10.1103/PhysRevE.67.026221
18. Biktashev VN, Barkley D, Biktasheva IV. Orbital motion of spiral waves in excitable media. Phys Rev Lett. (2010) 104:058302. doi: 10.1103/PhysRevLett.104.058302
19. Biktashev VN, Biktasheva IV, Sarvazyan NA. Evolution of spiral and scroll waves of excitation in a mathematical model of ischaemic border zone. PLoS ONE (2011) 6:e24388. doi: 10.1371/journal.pone.0024388
20. Biktasheva IV, Dierckx H, Biktashev VN. Drift of scroll waves in thin layers caused by thickness features: asymptotic theory and numerical simulations. Phys Rev Lett. (2015) 114:068302. doi: 10.1103/PhysRevLett.114.068302
21. Bosch RF, Nattel S. Cellular electrophysiology of atrial fibrillation. Cardiovasc. Res. (2002) 54:259–69. doi: 10.1016/S0008-6363(01)00529-6
22. Workman AJ, Kane KA, Rankin AC. Cellular bases for human atrial fibrillation. Heart Rhythm (2008) 5:S1–6. doi: 10.1016/j.hrthm.2008.01.016
23. Kushiyama Y, Honjo H, Niwa R, Takanari H, Yamazaki M, Takemoto Y, et al. Partial I-K1 blockade destabilizes spiral wave rotation center without inducing wave breakup and facilitates termination of reentrant arrhythmias in ventricles. Am J Physiol Heart Circul Physiol. (2016) 311:H750–75. doi: 10.1152/ajpheart.00228.2016
24. Pellman J, Lyon RC, Sheikh F. Extracellular matrix remodeling in atrial fibrosis: mechanisms and implications in atrial fibrillation. J Mol Cell Cardiol. (2010) 48:461–7. doi: 10.1016/j.yjmcc.2009.09.001
25. Eckstein J, Maesen B, Linz D, Zeemering S, van Hunnik A, Verheule S, et al. Time course and mechanisms of endo-epicardial electrical dissociation during atrial fibrillation in the goat. Cardiovasc Res. (2011) 89:816–24. doi: 10.1093/cvr/cvq336
26. Takemoto Y, Takanari H, Honjo H, Ueda N, Harada M, Kato S, et al. Inhibition of intercellular coupling stabilizes spiral-wave reentry, whereas enhancement of the coupling destabilizes the reentry in favor of early termination. Am J Physiol Heart Circ Physiol. (2012) 303:H578–86. doi: 10.1152/ajpheart.00355.2012
27. Eckstein J, Zeemering S, Linz D, Maesen B, Verheule S, van Hunnik A, et al. Transmural conduction is the predominant mechanism of breakthrough during atrial fibrillation: evidence from simultaneous endo-epicardial high-density activation mapping. Circ Arrhyth Electrophysiol. (2013) 6:334–41. doi: 10.1161/CIRCEP.113.000342
28. MacEdo PG, Kapa S, Mears JA, Fratianni A, Asirvatham SJ. Correlative anatomy for the electrophysiologist: ablation for atrial fibrillation. Part II: regional anatomy of the atria and relevance to damage of adjacent structures during AF ablation. J Cardiovasc Electrophysiol. (2010) 21:829–36.
29. Anselmino M, Blandino A, Beninati S, Rovera C, Boffano C, Belletti M, et al. Morphologic analysis of left atrial anatomy by magnetic resonance angiography in patients with atrial fibrillation: a large single center experience. J Cardiovasc Electrophysiol. (2011) 22:1–7. doi: 10.1111/j.1540-8167.2010.01853.x
30. Gray RA, Pertsov AM, Jalife J. Incomplete reentry and epicardial breakthrough patterns during atrial fibrillation in the sheep heart. Circulation (1996) 94:2649–61. doi: 10.1161/01.CIR.94.10.2649
31. Wu TJ, Yashima M, Xie F, Athill CA, Kim YH, Fishbein MC, et al. Role of pectinate muscle bundles in the generation and maintenance of intra-atrial reentry. Potential implications for the mechanism of conversion between atrial fibrillation and atrial flutter. Circ Res. (1998) 83:448–62. doi: 10.1161/01.RES.83.4.448
32. Nattel S. New ideas about atrial fibrillation 50 years on. Nature (2002) 415:219–26. doi: 10.1038/415219a
33. Yamazaki M, Mironov S, Taravant C, Brec J, Vaquero LM, Bandaru K, et al. Heterogeneous atrial wall thickness and stretch promote scroll waves anchoring during atrial fibrillation. Cardiovasc Res. (2012) 94:48–57. doi: 10.1093/cvr/cvr357
34. Bishop MJ, Plank G, Burton RAB, Schneider JE, Gavaghan DJ, Grau V, et al. Development of an anatomically detailed MRI-derived rabbit ventricular model and assessment of its impact on simulations of electrophysiological function. Am J Physiol Heart Circ Physiol. (2010) 298:H699–718. doi: 10.1152/ajpheart.00606.2009
35. Bishop MJ, Vigmond E, Plank G. Cardiac bidomain bath-loading effects during arrhythmias: interaction with anatomical heterogeneity. Biophys J. (2011) 101:2871–81. doi: 10.1016/j.bpj.2011.10.052
36. Bishop MJ, Plank G. The role of fine-scale anatomical structure in the dynamics of reentry in computational models of the rabbit ventricles. J Physiol. (2012) 590:4515–35. doi: 10.1113/jphysiol.2012.229062
37. Fukumoto K, Habibi M, Ipek SEG, Khurram IM, Zimmerman SL, Zipunnikov V, et al. Association of left atrial local conduction velocity with late gadolinium enhancement on cardiac magnetic resonance in patients with atrial fibrillation. Circ Arrhyt Electrophysiol. (2016) 9:e002897. doi: 10.1161/CIRCEP.115.002897
38. Rodriguez B, Eason JC, Trayanova N. Differences between left and right ventricular anatomy determine the types of reentrant circuits induced by an external electric shock. A rabbit heart simulation study. Prog Biophys Mol Biol. (2006) 90:399–413. doi: 10.1016/j.pbiomolbio.2005.06.008
39. Dierckx H, Brisard E, Verschelde H, Panfilov AV. Drift laws for spiral waves on curved anisotropic surfaces. Phys Rev E (2013) 88:012908. doi: 10.1103/PhysRevE.88.012908
40. Spach M. Mechanisms of the dynamics of reentry in a fibrillating myocardium - Developing a genes-to-rotors paradigm. Circ Res. (2001) 88:753–5. doi: 10.1161/hh0801.090538
41. Smaill BH, LeGrice IJ, Hooks DA, Pullan AJ, Caldwell BJ, Hunter PJ. Cardiac structure and electrical activation: models and measurement. Clin Exp Pharmacol Physiol. (2004) 31:913–9. doi: 10.1111/j.1440-1681.2004.04131.x
42. Hunter PJ, Smaill BH, Nielsen PMF, Le Grice IJ. A mathematical model of cardiac anatomy. In: Holden AV, Panfilov AV, editors. Computational Biology of the Heart. Chichester: Wiley (1997). p. 171–215.
43. Vigmond E, Vadakkumpadan F, Gurev V, Arevalo H, Deo M, Plank G, et al. Towards predictive modelling of the electrophysiology of the heart. Exp Physiol. (2009) 94:563–77. doi: 10.1113/expphysiol.2008.044073
44. Antonioletti M, Biktashev VN, Jackson A, Kharche SR, Stary T, Biktasheva IV. BeatBox - HPC simulation environment for biophysically and anatomically realistic cardiac electrophysiology. PLoS ONE (2017) 12:e0172292. doi: 10.1371/journal.pone.0172292
45. Pervolaraki E, Anderson RA, Benson AP, Hays-Gill B, Holden AV, Moore BJR, et al. Antenatal architecture and activity of the human heart. Interf Focus (2013) 3:20120065. doi: 10.1098/rsfs.2012.0065
46. Benson AP, Hayes-Gill B, Holden AV, Matthews R, Naz A, Page S, et al. Self-terminating re-entrant cardiac arrhythmias: quantitative characterization. Comput Cardiol. (2015) 42:641–4. doi: 10.1109/CIC.2015.7410992
47. Mekkaoui C, Porayette P, Jackowski MP, Kostis WJ, Dai G, Sanders S, et al. Diffusion MRI tractography of the developing human fetal heart. PLoS ONE (2013) 8:e72795. doi: 10.1371/journal.pone.0072795
48. Pervolaraki E, Dachtler J, Anderson RA, Holden AV. Ventricular myocardium development and the role of connexins in the human fetal heart. Sci Rep. (2017) 7:12272. doi: 10.1038/s41598-017-11129-9
49. Kharche SR, Biktasheva IV, Seeman G, Zhang H, Biktashev VN. A computer simulation study of anatomy induced drift of spiral waves in the human atrium. BioMed Res Int. (2015) 2015:731386. doi: 10.1155/2015/731386
50. Winfree AT. Varieties of spiral wave behaviour — an experimentalist's approach to the theory of excitable media. Chaos (1991) 1:303–34. doi: 10.1063/1.165844
51. Biktashev VN, Holden AV, Zhang H. Tension of organizing filaments of scroll waves. Phil Trans Roy Soc Lond A (1994) 347:611–30. doi: 10.1098/rsta.1994.0070
52. Karma A. Electrical alternans and spiral wave breakup in cardiac tissue. Chaos (1994) 4:461–72. doi: 10.1063/1.166024
53. Biktashev VN, Holden AV. Re-entrant waves and their elimination in a model of mammalian ventricular tissue. Chaos (1998) 8:48–56. doi: 10.1063/1.166307
54. Zhu RJ, Millrod MA, Zambidis ET, Tung L. Variability of action potentials within and among cardiac cell clusters derived from human embryonic stem cells. Sci Rep. (2016) 6:18544. doi: 10.1038/srep18544
55. Pervolaraki E, Hodgson S, Holden AV, Benson AP. Towards computational modelling of the human fetal electrocardiogram: normal sinus rhythm and congenital heart block. Europace (2014) 16:758–65. doi: 10.1093/europace/eut377
56. Kharche SR, Biktasheva IV, Seemann G, Zhang H, Zhao J, Biktashev VN. Computational modelling of low voltage resonant drift of scroll waves in the realistic human atria. Lect Notes Comput Sci. (2015) 9126:421–9. doi: 10.1007/978-3-319-20309-6_48
57. Pervolaraki E, Anderson RA, Benson AP, Moore BJ, Zhang H, Holden AV. Diffusion tensor magnetic resonance imaging of anisotropic and orthotropic architecture of the human fetal ventricular myocardium. Proc Physiol Soc. (2012) 28:PC26. Available online at: http://www.physoc.org/proceedings/abstract/Proc%20Physiol%20Soc%2028PC26
58. Tang M, Holden AV, Anderson RA, Pervolaraki E. Contrast-enhanced magnetic resonance imaging of the human foetal heart reveals its myocardial architecture. Proc Physiol Soc. (2016) 37:PCA060. Available online at: http://www.physoc.org/proceedings/abstract/Proc%20Physiol%20Soc%2037 PCA060
59. Hu K, Scheer FAJL, Laker M, Smales C, Shea SA. Endogenous circadian rhythm in vasovagal response to head-up tilt. Circulation (2011) 123:961–U85. doi: 10.1161/CIRCULATIONAHA.110.943019
60. Jeyaraj D, Haldar SM, Wan XP, McCauley MD, Ripperger JA, Hu K, et al. Circadian rhythms govern cardiac repolarization and arrhythmogenesis. Nature (2012) 483:96–U141. doi: 10.1038/nature10852
61. Clayton RH, Murray A, Higham PD, Campbell RWF. Self-terminating ventricular tachyarrhythmias - a diagnostic dilemma. Lancet (1993) 341:93–5. doi: 10.1016/0140-6736(93)92567-D
62. Lombaert H, Peyrat JM, Croisille P, Rapacchi S, Fanton L, Cheriet F, et al. Human atlas of the cardiac fiber architecture: study on a healthy population. IEEE Tran Med Imaging (2012) 31:1436–47. doi: 10.1109/TMI.2012.2192743
Keywords: cardiac arrhythmias, anatomically realistic modeling, anisotropy, anatomy induced drift, FitzHugh-Nagumo model
Citation: Biktasheva IV, Anderson RA, Holden AV, Pervolaraki E and Wen FC (2018) Cardiac Re-entry Dynamics and Self-termination in DT-MRI Based Model of Human Fetal Heart. Front. Phys. 6:15. doi: 10.3389/fphy.2018.00015
Received: 03 November 2017; Accepted: 08 February 2018;
Published: 27 February 2018.
Edited by:
S. Sridhar, Robert Bosch Centre for Cyber- Physical Systems, Indian Institute of Science, IndiaReviewed by:
Rupamanjari Majumder, Leiden University Medical Center, NetherlandsSilvia Capuani, Consiglio Nazionale Delle Ricerche (CNR), Italy
Copyright © 2018 Biktasheva, Anderson, Holden, Pervolaraki and Wen. This is an open-access article distributed under the terms of the Creative Commons Attribution License (CC BY). The use, distribution or reproduction in other forums is permitted, provided the original author(s) and the copyright owner are credited and that the original publication in this journal is cited, in accordance with accepted academic practice. No use, distribution or reproduction is permitted which does not comply with these terms.
*Correspondence: Irina V. Biktasheva, aXZiQGxpdmVycG9vbC5hYy51aw==